REVIEW 4 major objections 4 minor
A sampling method based on highest density regions: Applications to surrogate models
T0 review · 4 major / 4 minor · reviewed 2026-08-04 · deepseek-v4-flash
Pith's one-line read Training surrogate models on uniformly drawn samples inside the input distribution's highest density region improves approximation and failure-probability estimates compared with sampling according to the distribution itself.
desk verdict A useful heuristic with an overbroad headline: the abstract's 'globally outperform' is contradicted by the paper's own RMSE results, but the low-dimensional reliability gains and the substantial benchmark make this worth reviewing after the claims are tempered. read the letter →
The pith
A machine-rendered reading of the paper's core claim, the machinery that carries it, and where it could break.
The reading
What carries the argument
The central object is the highest density region (HDR), a compact superlevel set of the input density that contains a chosen probability mass 1−α. The machinery has two parts: a numerical estimate of the threshold ℓ (a closed chi-squared form for Gaussian vectors, otherwise a Monte-Carlo-based root find) and a uniform sampler inside the HDR built from an affine map to a PCA-based bounding box plus acceptance–rejection. The HDR does the conceptual work: uniform sampling inside it redistributes training effort from the mode into the tails, exactly where reliability estimates are decided.
What would settle it
Repeat the eight-problem benchmark with a fixed polynomial basis for both sampling schemes. If the HDR advantage in leave-one-out error, RMSE, or reliability-index error shrinks or vanishes, the reported gains come from different LAR-selected bases, not from the sampling design.
Extended reading notes
Core claim
The central claim is that the experimental design can be chosen to serve the downstream task. For a random vector X with density f_X, the authors define the (1−α)-HDR as the superlevel set {x: f_X(x) ≥ ℓ} that carries probability 1−α, and sample uniformly inside it using an affine PCA-based bounding box followed by acceptance–rejection. They train polynomial chaos expansion (PCE) and polynomial chaos Kriging (PCK) surrogates on these points and compare them with surrogates trained on natural samples, holding other settings fixed. The reported result is that HDR designs globally outperform natural designs on all three error metrics, with especially pronounced improvements in the relative reli
Load-bearing premise
The comparison assumes that error differences reflect sampling quality rather than the fact that LAR basis selection may converge to different polynomial bases under each sampling scheme—a caveat the paper itself raises in Section 4.2.
Editorial extensions
If this is right
- HDR-based experimental designs are generated from the input distribution alone, so they can be inserted into existing PCE and PCK workflows with no extra model evaluations.
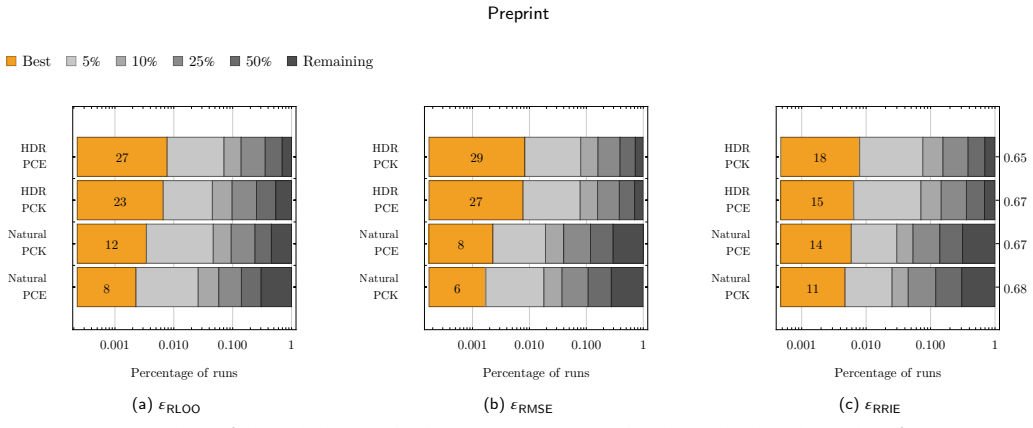
- In the pooled ranking over eight benchmark problems and five experimental-design sizes, HDR sampling takes more top ranks than natural sampling on all three error metrics, and no case showed natural sampling significantly outperforming HDR.
- Failure-probability estimates improve: HDR-trained surrogates give lower relative reliability-index errors, which matters when Pf is as small as 10^-6.
- As α increases, the training region shrinks and the leave-one-out error becomes optimistic; the paper recommends small α and cautious interpretation of RLOO under HDR sampling.
- The acceptance–rejection sampler is subject to the curse of dimensionality, so the method is recommended for low-dimensional and moderately correlated inputs (tested up to d=20).
Reading between the lines
- A fixed-basis benchmark (no LAR selection) would separate sampling quality from basis-selection effects; the paper does not run this, but it would settle whether HDR's advantage is partly an automatic sparsification effect.
- Because the validation set is drawn from the original distribution, the RMSE comparison penalises HDR by construction; a density-weighted or tail-focused error metric would likely show a larger global gain.
- Starting from an HDR design could accelerate active-learning schemes for rare events; the paper's high-dimensional toy with Pf=10^-6 hints at this but leaves it untested.
- For multimodal distributions, the HDR may be a union of components and the single PCA bounding box becomes inefficient; component-wise sampling or a transport-based sampler would be the natural extension.
Signed reviews
Editorial analysis
A structured set of objections, weighed in public.
Referee Report
Summary. The paper proposes a heuristic experimental-design strategy for surrogate modelling: instead of sampling training points according to the input distribution ('natural sampling'), it generates points uniformly inside the highest density region (HDR) of the input density at probability level 1−α. The HDR is computed numerically via a reliability-style root-finding method, and uniform samples are obtained by affine mapping of the unit cube to a PCA-based bounding box followed by acceptance–rejection. The method is tested on PCE and PCK surrogates for nine problems, with 100 repetitions per setting (about 1,400 surrogates), using three metrics: relative leave-one-out error, relative mean-square error on an external validation set, and a relative reliability-index error based on importance sampling. The paper claims that the HDR-based designs 'globally outperform' natural designs in both RMSE and failure-probability estimation. The appendices provide correct closed-form results for Gaussian HDRs and for a synthetic d-dimensional test function with exactly prescribed failure probability.
Significance. If the headline claim were supported, the method would offer a cheap, black-box way to improve surrogate-based reliability estimates. The paper has real strengths: a large and carefully replicated benchmark, inclusion of a full-scale finite-element geotechnical problem, transparent reporting of the heuristic nature of the method, and machine-checkable appendix proofs for the Gaussian HDR formula and the d-dimensional test function. However, the central empirical claim is not supported as stated: the paper's own results show HDR is worse on the Franke problem for RMSE, and worse than natural sampling for every tested α once d>3. The RRIE ranking also excludes the most accurate runs. The method may still be useful as a heuristic for low-dimensional reliability problems, but the paper needs substantial qualification and additional analysis before the 'global outperformance' claim can stand.
major comments (4)
- [Abstract and §4.1, §4.3] The abstract states that HDR designs 'globally outperform' natural designs 'both in terms of relative mean square error as well as in estimating the probability of failure.' This is contradicted by the paper's own evidence. In §4.1, Fig. 10, HDR roughly doubles RMSE on the Franke problem for both PCE (1.56×10⁻¹ → 3.12×10⁻¹) and PCK (3.2×10⁻⁴ → 6.5×10⁻⁴). In §4.3, Fig. 14b, the text explicitly says 'natural sampling outperforms HDR for any tested value of α as soon as d>3.' Because the benchmark includes d=4,5,6,7,9,10, the 'global' claim cannot be maintained. The abstract and conclusions should be revised to a qualified statement, e.g. 'often competitive or better in low dimension, especially for reliability metrics,' or 'with the exception of RMSE in higher dimensions.'
- [§4.2, Fig. 13c] The RRIE ranking used to support the failure-probability claim excludes all runs with ε_RRIE below the noise threshold ε̄_RRIE. These are the best-performing runs—those where the surrogate is indistinguishable from the reference at the Monte Carlo noise level. The displayed win counts (33 vs 25) therefore do not compare the two methods over the full distribution of replications; they compare only the noisier runs. The authors note that disqualification 'mechanically narrows the separation,' but this does not cure the selection bias. The paper should report the proportion of sub-threshold runs for each method (the right-axis numbers in Fig. 13c are aggregated) or treat sub-threshold runs as ties, and state whether HDR's advantage survives that analysis.
- [§4.2, LARS/comparability] The paper itself acknowledges a load-bearing comparability problem: 'the LARS algorithm might converge to different multi-index sets, resulting in a different selection of elements of the polynomial bases. In this context, the question of whether the results are truly comparable is legitimate.' If HDR sampling systematically produces sparser or simpler bases, then lower LOO and RMSE could reflect model complexity rather than sampling quality. The benchmark is presented as a user-perspective comparison, which is legitimate, but the causal claim that HDR sampling 'outperforms' requires isolating the sampling effect. The authors should report the distribution of selected basis sizes or run a fixed-basis comparison for at least a subset of problems.
- [§3.2.4 and Table 1] For problem F6 (sheet pile wall), the reference reliability index is not an external value: it is obtained from a PCK-based active-learning reliability scheme, as stated in §3.2.4. The table also marks the problem as not reproducible. The RRIE metric for this problem therefore compares the surrogate against another surrogate-based estimate, not against a reference 'truth.' This introduces a circularity risk for one of the seven benchmark problems in the pooled ranking. The paper should either flag this explicitly as a limitation in the RRIE analysis, or provide an independent Monte Carlo validation for F6 at a coarser tolerance.
minor comments (4)
- [Algorithm 2, line 4] The initial sample-size formula appears to be the reciprocal of the volume of the unit-diameter d-ball. The volume is π^{d/2}/(2^d Γ(d/2+1)), so the expected number of samples to obtain n accepted points is n·2^d Γ(d/2+1)/π^{d/2}. The formula as written, Γ(d/2+1)/(π^{d/2}2^d)·n, is much smaller; for d=2 it gives n/(4π)≈0.08n instead of about 1.27n. This is not fatal because the loop increments, but it makes the initial guess misleading.
- [§4.2, Fig. 13] The text says the vertical ranking 'allows us to identify under which conditions HDR performs best,' but the displayed bars aggregate over problems and training sizes. A breakdown by problem and n would better support the 'conditions' language.
- [§3.1.1] The sensitivity analysis reports a maximum relative error of 6% for the HDR level ℓ. This is fine for the method, but the paper should state explicitly that this uncertainty propagates into the boundary of the sampling region and therefore into all subsequent comparisons; a sentence in the limitations would be helpful.
- [Eq. (14) and Eq. (15)] The notation ̃ẑ or ̃g is used inconsistently for surrogate predictions; for example Eq. (14) writes ̃g with a hat on i, while the text elsewhere uses ̃g(𝒙). Please standardize.
Circularity Check
No significant circularity: the HDR sampling method is an openly heuristic benchmark study whose metrics are evaluated against independent validation sets and external references, with no prediction reducing to a fitted value or self-citation chain.
full rationale
The paper's contribution is an explicitly heuristic acceptance–rejection sampler for highest density regions, validated by benchmarking rather than derived from first principles. The three metrics (RLOO, RMSE, RRIE) are computed on independent validation sets, importance-sampling estimates, or external/reported reference values. The only tuning parameters (α, n) are fixed a priori and are not fitted to the target errors. The authors do not rely on a uniqueness theorem or on load-bearing self-citations: the PCE/PCK machinery is cited from the external UQLab and Blatman–Sudret literature, and no equation in the paper reduces an error metric to a construction input. The explicit caveat in §4.2 that LARS may converge to different multi-index sets is a comparability limitation, not a circular step, and the F6 reference reliability obtained from an active-learning PCK (§3.2.4) is transparently disclosed and used solely as a benchmark reference, not as an input to the HDR construction. The abstract's 'globally outperform' wording is stronger than some of the paper's own results, but that is an evidentiary/interpretation issue, not circularity.
Assumptions & free parameters
free parameters (2)
- alpha (HDR probability level) =
0.01 for problems F2-F8, 0.05 for F1, varied 0.001-0.1 for F9
- gamma (RRIE noise threshold quantile) =
0.01
assumptions (4)
- domain assumption The input distribution f_X (marginals and copula) is known exactly and used to define the HDR.
- standard math Uniform samples in the HDR can be obtained by acceptance/rejection from an affine PCA bounding box around the HDR.
- ad hoc to paper The heuristic that uniform coverage of the HDR improves tail/reliability accuracy is not derived from first principles.
- domain assumption For benchmark F6, the reference failure probability is obtained from a PCK active-learning surrogate rather than from direct simulation.
Cite this review
Pith. "Pith review of A sampling method based on highest density regions: Applications to surrogate models." pith.science (2026). https://pith.science/paper/6RXIE2OW
@misc{pith2026250910149,
  author       = {Pith},
  title        = {Pith review of: A sampling method based on highest density regions: Applications to surrogate models},
  year         = {2026},
  howpublished = {\url{https://pith.science/paper/6RXIE2OW}},
  note         = {Machine review of arXiv:2509.10149}
}
read the original abstract
This paper introduces a practical, one-shot design-of-experiments strategy for training surrogate models in the context of uncertainty quantification. Instead of drawing the experimental design according to the input distribution, which favours training points around its mode, we propose a heuristic method to sample uniformly within a highest density region (HDR) of the input random vector, aiming at a more homogeneous approximation accuracy over the whole domain. The approach is assessed through four error metrics: two task-agnostic accuracy measures (leave-one-out and relative mean square error) and two task-oriented measures quantifying the recovery of reference global sensitivity indices and of the probability of failure. Across the benchmark, the HDR-based designs are comparable to, or more accurate than, the distribution-based designs for most surrogate-task combinations, with the clearest gains in predictive accuracy and reliability and essentially no effect on the recovery of sensitivity indices. The method operates in a black-box context and is compatible with existing uncertainty quantification frameworks for low-dimensional and moderately correlated inputs, the curse of dimensionality affecting the sample generation rather than the design strategy itself. It is most useful whenever a single surrogate is reused across several downstream UQ tasks.
Figures


Figures from the paper (11 more)



Reviewed August 4, 2026 · model on record in the stance chip above.
Discussion (0). Continue with ORCID to comment.