REVIEW 3 major objections 5 minor 84 references
Exploring Multiple Stellar Populations in Globular Clusters with Euclid: A Theoretical Overview and Insights from NGC 6397
T0 review · 3 major / 5 minor · reviewed 2026-08-10 · deepseek-v4-flash
Pith's one-line read Euclid's near-infrared filters can distinguish first- and second-population M-dwarfs in globular clusters through oxygen-sensitive molecular absorption, and in NGC 6397 the first population makes up about 30% of M-dwarfs while the second…
desk verdict First Euclid-based detection of multiple populations among M-dwarfs in NGC 6397, with the central claim independently supported by a NIRCam cross-check; the quantitative 1P fraction and [O/Fe] depletion are model-dependent and have a temperature-grid caveat. read the letter →
The pith
A machine-rendered reading of the paper's core claim, the machinery that carries it, and where it could break.
The reading
What carries the argument
The central object is the oxygen-based molecular absorption, primarily H2O, in the atmospheres of M-dwarfs; its strength falls with decreasing [O/Fe] and its bands sit inside Euclid's JE and HE filters. The theoretical chain uses ATLAS12/SYNTHE synthetic spectra for 1P and 2P chemistries, integrated through Euclid passbands, applied to 13 Gyr Dartmouth isochrones, with BaSTI isochrones used for the abundance fit in NGC 6397. The operational diagnostic is the chromosome map ΔYE−HE versus ΔIE−JE, a two-color diagram in which stars are offset from the main sequence: it separates the two populations below the MS knee, where molecular absorption dominates the colors of cool dwarfs.
What would settle it
A decisive check would be to measure oxygen abundances spectroscopically for a sample of NGC 6397 M-dwarfs already classified as 1P and 2P by the Euclid chromosome map; if the median [O/Fe] difference between the groups is not about 0.3 dex, or if the color split persists among stars with identical [O/Fe], the molecular-absorption interpretation fails.
Extended reading notes
Core claim
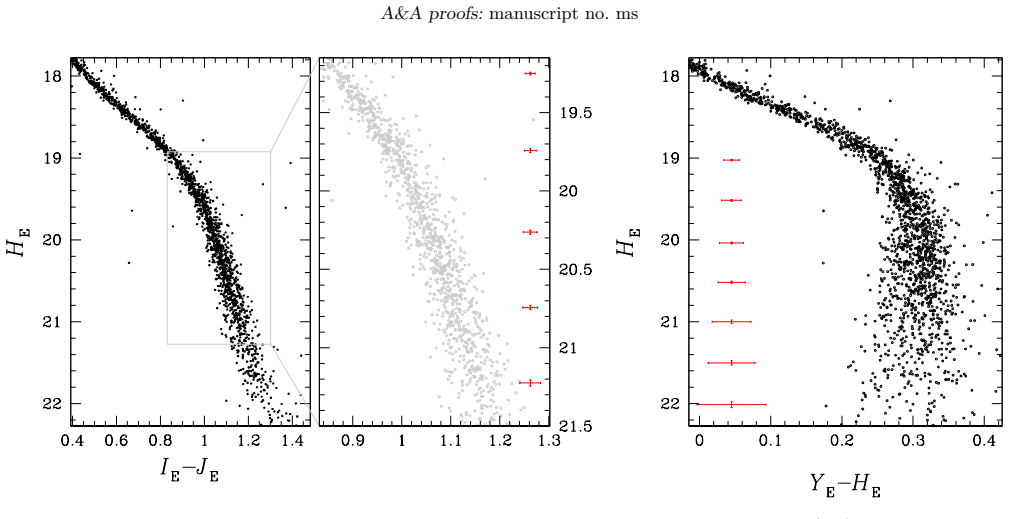
The central discovery is that oxygen-sensitive molecular absorption, mainly water vapor at wavelengths beyond about 13,000 Å, makes Euclid's near-infrared bands a direct population diagnostic for M-dwarfs: in synthetic spectra, second-population stars with lower oxygen are brighter in the HE band (and to a lesser extent JE) than first-population stars of equal luminosity, producing distinct sequences in HE versus YE−HE and HE versus IE−JE diagrams. In NGC 6397, the chromosome map built from these colors splits proper-motion-selected M-dwarfs into two groups, and simulated maps indicate that 1P stars constitute about 30% of the sample. The bulk of 2P stars are depleted by about 0.3 dex in [O/Fe] relative to an assumed 1P value of [O/Fe]=0.4, with roughly one-fifth of the 2P stars reaching [O/Fe] near 0.0; proper motions from Euclid, HST, and JWST show both populations with isotropic velocity distributions, and the 1P fraction stays nearly constant from the cluster center out to about 28 arcminutes.
Load-bearing premise
The result depends on the synthetic spectra: if the ATLAS12/SYNTHE models, including the molecular line data for H2O and other oxygen-bearing molecules, do not accurately predict the Euclid YE, JE, and HE fluxes of M-dwarfs for the assumed 1P and 2P chemistries, the color splits and the inferred 0.3 dex oxygen depletion would not follow.
Editorial extensions
If this is right
- Euclid can identify multiple populations among M-dwarfs across a wide field in a single instrument, so radial population gradients can be measured out to tens of arcminutes in one pointing.
- In NGC 6397, the 1P fraction is about 30% and nearly constant across stellar mass and radius, with at most a few-percent increase of 2P stars toward the center.
- The approximately 0.3 dex [O/Fe] depletion derived from Euclid colors agrees with independent spectroscopic and NIRCam estimates, making Euclid a viable tool for relative light-element abundances in low-mass stars.
- Both populations show isotropic proper motions with similar velocity dispersions, and the measured equipartition slope η=0.05±0.02 indicates only weak energy equipartition among the studied stars.
- For metal-rich clusters, the IE band becomes strongly oxygen-sensitive in M-dwarfs, so Euclid color-magnitude diagrams should separate populations even more clearly at higher metallicity.
Reading between the lines
- If the molecular-absorption mechanism is robust, Euclid's wide-area M-dwarf census can be pushed into cluster outskirts and tidal tails, turning population ratios into a tracer of cluster dynamics and mass loss.
- The assumed 1P [O/Fe]=0.4 sets the zero point for the depletion estimate; high-resolution spectroscopy suggesting a higher 1P oxygen content would shrink the quoted 0.3 dex toward about 0.2 dex, so cross-calibrating Euclid colors with spectroscopic oxygen abundances in a few clusters is the natural next test.
- The same chromosome-map machinery applied to Euclid's all-sky data predicts that metal-rich clusters show larger IE−YE separations between populations than metal-poor clusters, a testable pattern across a large cluster sample.
- A single-population synthetic cluster with realistic photometric errors should not reproduce the observed split; verifying this on multiple clusters would rule out reddening or binary artifacts as the source of the two groups.
Signed reviews
Editorial analysis
A structured set of objections, weighed in public.
Referee Report
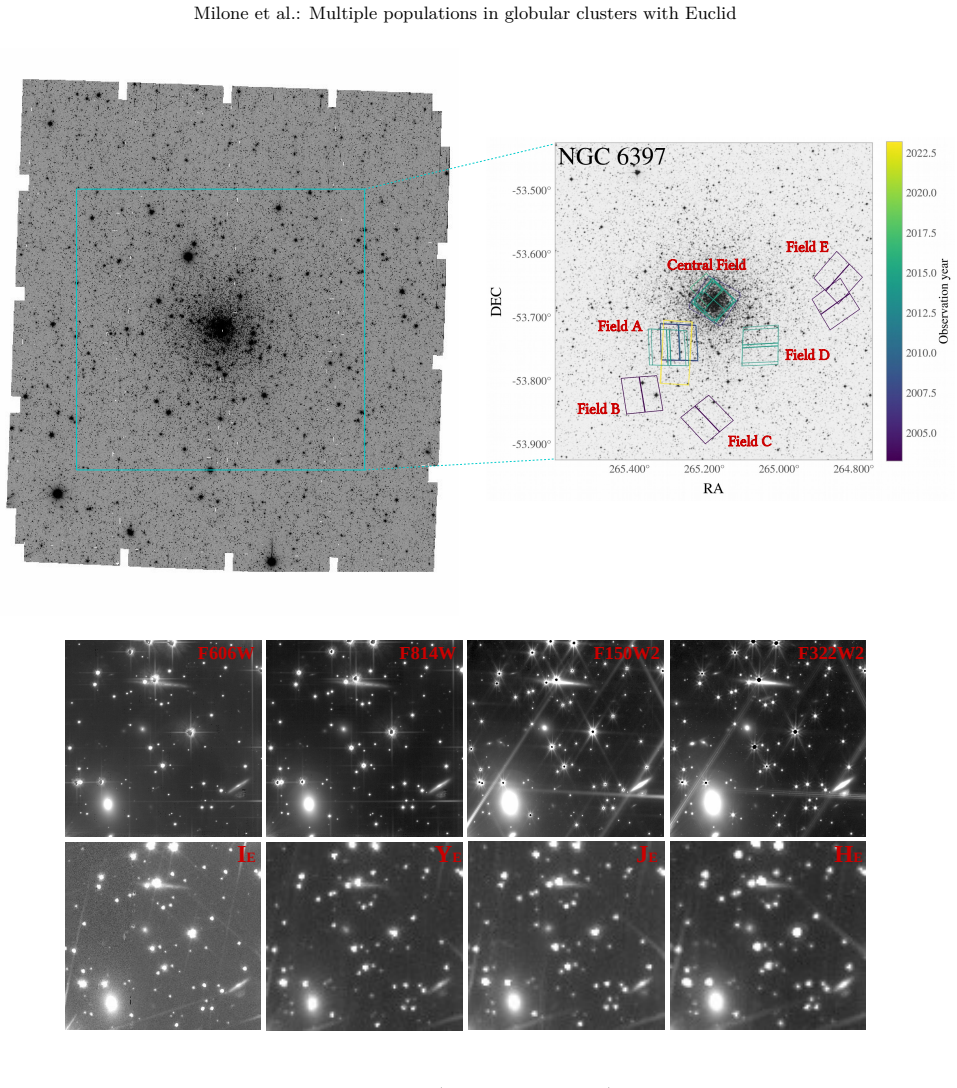
Summary. This paper investigates whether Euclid photometry can identify and characterize multiple stellar populations (1P and 2P) in globular clusters, focusing on M-dwarfs where oxygen-bearing molecular absorption (mainly water vapor) makes near-infrared colors sensitive to light-element abundance variations. The authors first present synthetic spectra and isochrones for metal-poor, intermediate, and metal-rich clusters, identifying the YE−HE and IE−JE colors and the corresponding chromosome map as the most promising diagnostics. They then analyze Euclid ERO photometry of NGC 6397, combining it with HST and JWST data for proper-motion selection and NIRCam-based population classification. The observational analysis reveals two distinct groups of M-dwarfs in the Euclid chromosome map, a 1P fraction of about 30%, an [O/Fe] depletion of roughly 0.3 dex for 2P stars relative to 1P stars, isotropic proper motions, and a 2P fraction that is nearly constant across the studied radial range of about 2–28 arcmin. The authors argue that this is the first wide-field census of multiple populations among M-dwarfs in a globular cluster.
Significance. If the quantitative results hold, the paper would establish Euclid as a new wide-field instrument for multiple-population studies, extending the HST/JWST-based M-dwarf work to much larger radial coverage and providing the first M-dwarf population census across 28 arcminutes. The central qualitative claim—that Euclid photometry separates 1P and 2P M-dwarfs—is supported by the cross-validation in Figure 12, where stars independently classified as 1P and 2P from the NIRCam chromosome map occupy distinct regions in the Euclid chromosome map. The work also benefits from careful data reduction, proper-motion cleaning, differential-reddening corrections, and an explicit discussion of the tension with the spectroscopic results of Lind et al. (2011). However, the quantitative outputs—the 30% 1P fraction and the 0.3 dex oxygen depletion—rest on synthetic models whose validity at the low effective temperatures of the faintest analyzed M-dwarfs is not demonstrated.
major comments (3)
- [Section 3; Figure 13] This concern does not undermine the qualitative identification of two populations, which is independently supported by the NIRCam cross-match in Figure 12, but it does affect the quantitative abundance claim in the abstract.
- [Section 4; Figure 10]
- [Section 5; Lind et al. discrepancy]
minor comments (5)
- [Figure 13] In the insets of the left and middle panels, the color difference is labeled δ(IE−EE); this appears to be a typo for δ(IE−JE).
- [Section 2.4] The text states that the reddening coefficients were adopted from Legnardi et al. (2023), while Table 1 lists values for the Euclid filters; a brief description of how these coefficients were computed for the Euclid bandpasses would improve reproducibility.
- [Section 4.1.1] The anisotropy parameter is defined as β=σT/σR−1, but the usual definition is β=1−σT/σR; please clarify the sign convention or adjust the definition so that the text matches the plotted quantity.
- [Section 2.3] The description of the frame alignment says the reference frame is anchored to the first-epoch images, but the master frame is later defined with the X-axis toward west; a brief clarification of the orientation convention would help.
- [General] The paper uses ‘Stetson’s and Libralato’s catalogs’ in several places; please ensure the citation style is consistent (e.g., Stetson et al. 2019 vs. Libralato et al. 2024) and that all datasets are explicitly listed in Table A.1.
Circularity Check
Two quantitative claims — 30% 1P fraction and 0.3 dex O-depletion — are best-match simulation inputs reported as findings; qualitative Euclid separation is independently supported.
-
fitted input called prediction
[Section 4, Figure 10 (right panel) and Section 5 summary bullet]
"The right panel of Figure 10 displays the simulated ChM that provides the best match with the observations and is derived as in Zennaro et al. (2019). The 1P and 2P stars comprise the 31% and 69%, respectively, of the simulated stars and are colored teal and crimson, respectively."
The 31%/69% split is the input of the simulation that is tuned to 'best match' the observed chromosome map, not an independently measured outcome. The abstract's statement that 'the 1P constitutes about 30% of the M-dwarfs' therefore restates the fitted fraction, so the quoted census is forced by the fitting procedure rather than predicted by the data.
-
fitted input called prediction
[Section 4, Figure 13; Section 5 summary bullet]
"Our analysis indicates that isochrones with [O/Fe]=0.1 provide the best match for the bulk of 2P stars ... The observations indicate that the bulk of 2P stars are depleted by ∼0.3 dex in [O/Fe] compared to the 1P stars, which exhibit [O/Fe]=0.4."
The quoted 0.3 dex depletion is the difference between the adopted 1P isochrone ([O/Fe]=0.4) and the 2P isochrone ([O/Fe]=0.1) selected as 'best match' in Figure 13. Choosing the best-matching template from a grid with 0.3-0.4 dex spacing makes the abundance offset an input of the matching procedure rather than an independent measurement. The zero point also depends on the assumed 1P [O/Fe]=0.4, which the paper itself acknowledges is about 0.3 dex lower than the value inferred by Lind et al. (2011), so the claimed depletion shifts with that assumption.
full rationale
The derivation chain is partially circular in its two headline quantitative numbers but not in its qualitative claim. The 31% 1P fraction is the input of the simulated chromosome map that is tuned to 'best match' the observed chromosome map in Section 4 (Figure 10), so the abstract's 'about 30%' is a fitted parameter restated as an empirical result. Likewise, the 'about 0.3 dex' [O/Fe] depletion is the separation between the adopted 1P isochrone ([O/Fe]=0.4) and the 2P isochrone ([O/Fe]=0.1) selected as the best match in Figure 13; the value is therefore set by the model grid rather than measured independently, and the paper itself notes that the assumed 1P oxygen zero point differs by about 0.3 dex from Lind et al. (2011), shifting the quoted depletion. The central qualitative claim that Euclid photometry separates two M-dwarf populations is not circular: it is checked against an independent NIRCam-selected 1P/2P classification in Figure 12 and against previous HST/JWST results, so the demonstrated capability of Euclid has independent empirical content. The 3500 K lower boundary of the ATLAS12 grid is a model-extrapolation concern for the faintest observed M-dwarfs, not a circularity, because it concerns physical accuracy rather than equivalence of inputs and outputs.
Assumptions & free parameters
free parameters (4)
- 1P fraction in simulated chromosome map =
31% 1P, 69% 2P
- 2P oxygen abundance [O/Fe] =
0.1 dex (bulk), 0.0 dex (extreme)
- 1P oxygen abundance [O/Fe] =
0.4
- Intrinsic pseudo-color broadening of 2P stars =
not quoted
assumptions (4)
- domain assumption The two populations seen in the Euclid chromosome map correspond to 1P and 2P stars with the assumed chemical differences (He and N enhanced, C and O depleted).
- domain assumption ATLAS12/SYNTHE synthetic spectra with the included molecular line lists accurately predict M-dwarf fluxes in the Euclid YE, JE, and HE bands.
- domain assumption Dartmouth and BaSTI isochrones with the adopted Y, [Fe/H], and [alpha/Fe] are valid for NGC 6397.
- domain assumption Differential reddening corrections with the adopted A/E(B-V) ratios and E(B-V)=0.18 adequately remove reddening variations.
Cite this review
Pith. "Pith review of Exploring Multiple Stellar Populations in Globular Clusters with Euclid: A Theoretical Overview and Insights from NGC 6397." pith.science (2026). https://pith.science/paper/6S7WN7HN
@misc{pith2026250108135,
  author       = {Pith},
  title        = {Pith review of: Exploring Multiple Stellar Populations in Globular Clusters with Euclid: A Theoretical Overview and Insights from NGC 6397},
  year         = {2026},
  howpublished = {\url{https://pith.science/paper/6S7WN7HN}},
  note         = {Machine review of arXiv:2501.08135}
}
read the original abstract
We investigate the behavior of multiple stellar populations in globular clusters (GCs) using photometric diagrams constructed with Euclid photometry. By employing synthetic spectra and isochrones that incorporate the chemical differences between first-population (1P) stars, resembling field stars, and second-population (2P) stars, enriched in helium and nitrogen but depleted in carbon and oxygen, we identify, from a theoretical perspective, the color-magnitude diagrams and the chromosome maps most effective at distinguishing these populations within GCs. Euclid photometry proves to be a powerful tool for identifying multiple populations among M-dwarfs, as 1P and 2P stars form distinct sequences in well-chosen photometric diagrams, driven by differences in the strength of oxygen-based molecular features, such as water vapor. To validate our theoretical findings, we analyzed Euclid photometry and astrometry of the GC NGC 6397, complemented by photometric and astrometric data from the Hubble Space Telescope and James Webb Space Telescope, enabling a comprehensive study of its stellar populations across a wide field of view. We find that the 1P constitutes about 30% of the M-dwarfs in NGC 6397, with the fraction of 1P stars remaining consistent across different stellar masses and throughout the entire field of view. 2P stars exhibit an [O/Fe] depletion of about 0.3 dex relative to 1P stars, and both populations display isotropic proper motions. This study represents the first comprehensive analysis of multiple populations among M-dwarfs across a wide field of view, demonstrating that Euclid photometry is a powerful instrument for investigating multiple populations in GCs.
Figures


Figures from the paper (15 more)




Reference graph
Works this paper leans on
-
[1]
Anderson, A. J. 1997, PhD thesis, University of California, Berkeley
1997
-
[2]
2022, in American Astronomical Society Meeting Ab- stracts, Vol
Anderson, J. 2022, in American Astronomical Society Meeting Ab- stracts, Vol. 240, American Astronomical Society Meeting #240, 206.01
2022
-
[3]
& King, I
Anderson, J. & King, I. R. 2000, PASP, 112, 1360
2000
-
[4]
& King, I
Anderson, J. & King, I. R. 2003, AJ, 126, 772
2003
-
[5]
& King, I
Anderson, J. & King, I. R. 2006, PSFs, Photometry, and Astronomy for the ACS/WFC, Instrument Science Report ACS 2006-01, 34 pages
2006
-
[6]
Anderson, J., Piotto, G., King, I. R., Bedin, L. R., & Guhathakurta, P. 2009, ApJ, 697, L58
work page 2009
- [7]
-
[8]
& Lardo, C
Bastian, N. & Lardo, C. 2018, ARA&A, 56, 83
2018
Show all 84 references
-
[9]
& Makino, J
Baumgardt, H. & Makino, J. 2003, MNRAS, 340, 227
2003
-
[10]
R., Nardiello, D., Salaris, M., et al
Bedin, L. R., Nardiello, D., Salaris, M., et al. 2024, Astronomische Nachrichten, 345, e20240039
2024
-
[11]
R., Piotto, G., Anderson, J., et al
Bedin, L. R., Piotto, G., Anderson, J., et al. 2004, ApJ, 605, L125
2004
-
[12]
Bellini, A., Anderson, J., & Bedin, L. R. 2011, PASP, 123, 622 Article number, page 18 of 21 Milone et al.: Multiple populations in globular clusters with Euclid
2011
-
[13]
& Bedin, L
Bellini, A. & Bedin, L. R. 2009, PASP, 121, 1419
2009
-
[14]
Branco, V., Coelho, P. R. T., Lançon, A., Martins, L. P., & Prugniel, P. 2024, A&A, 687, A142
2024
-
[15]
2023, A&A, 679, L13
Cadelano, M., Pallanca, C., Dalessandro, E., et al. 2023, A&A, 679, L13
2023
-
[16]
G., et al
Carretta, E., Bragaglia, A., Gratton, R. G., et al. 2009, A&A, 505, 117
2009
-
[17]
G., Lucatello, S., Bragaglia, A., & Bonifacio, P
Carretta, E., Gratton, R. G., Lucatello, S., Bragaglia, A., & Bonifacio, P. 2005, A&A, 433, 597
2005
-
[18]
2024, arXiv e-prints, arXiv:2409.02330
Cordoni, G., Casagrande, L., Milone, A., et al. 2024, arXiv e-prints, arXiv:2409.02330
2024 arXiv
-
[19]
S., Cohen, R
Correnti, M., Gennaro, M., Kalirai, J. S., Cohen, R. E., & Brown, T. M. 2018, ApJ, 864, 147
2018
-
[20]
S., Al-Bahlawan, A., Amiaux, J., et al
Cropper, M. S., Al-Bahlawan, A., Amiaux, J., et al. 2024, arXiv e- prints, arXiv:2405.13492 Cuillandre,J.C.,Bertin,E.,Bolzonella,M.,etal.2024,arXive-prints, arXiv:2405.13496 D’Antona, F., Bellazzini, M., Caloi, V., et al. 2005, ApJ, 631, 868 D’Antona, F., Caloi, V., Montalbán,...
2024
-
[21]
P., Renzini, A., et al
Dondoglio, E., Milone, A. P., Renzini, A., et al. 2022, ApJ, 927, 207
2022
-
[22]
2008, ApJS, 178, 89
Dotter, A., Chaboyer, B., Jevremović, D., et al. 2008, ApJS, 178, 89
2008
-
[23]
W., Conroy, C., et al
Dotter, A., Ferguson, J. W., Conroy, C., et al. 2015, MNRAS, 446, 1641
2015
-
[24]
W., Lang, D., & Goodman, J
Foreman-Mackey, D., Hogg, D. W., Lang, D., & Goodman, J. 2013, PASP, 125, 306 Gaia Collaboration, Brown, A. G. A., Vallenari, A., et al. 2021, A&A, 649, A1
2013
-
[25]
R., Burgasser, A
Gerasimov, R., Bedin, L. R., Burgasser, A. J., et al. 2024, ApJ, 971, 65
2024
-
[26]
2019, A&A Rev., 27, 8
Gratton, R., Bragaglia, A., Carretta, E., et al. 2019, A&A Rev., 27, 8
2019
-
[27]
Harris, W. E. 1996, AJ, 112, 1487
1996
-
[28]
2024, arXiv e-prints, arXiv:2405.13493
Jahnke, K., Gillard, W., Schirmer, M., et al. 2024, arXiv e-prints, arXiv:2405.13493
2024
-
[29]
P., Lagioia, E
Jang, S., Milone, A. P., Lagioia, E. P., et al. 2021, ApJ, 920, 129
2021
-
[30]
P., Legnardi, M
Jang, S., Milone, A. P., Legnardi, M. V., et al. 2022, MNRAS, 517, 5687
2022
-
[31]
S., Anderson, J., Richer, H
Kalirai, J. S., Anderson, J., Richer, H. B., et al. 2007, ApJ, 657, L93
2007
-
[32]
Kraft, R. P. 1994, PASP, 106, 553
1994
-
[33]
Kurucz, R. L. 1970, SAO Special Report, 309
1970
-
[34]
Kurucz, R. L. 1993, SYNTHE spectrum synthesis programs and line data
1993
-
[35]
Kurucz, R. L. & Avrett, E. H. 1981, SAO Special Report, 391
1981
-
[36]
P., Milone, A
Lagioia, E. P., Milone, A. P., Legnardi, M. V., et al. 2024, arXiv e- prints, arXiv:2406.16824
2024 arXiv
-
[37]
P., Milone, A
Lagioia, E. P., Milone, A. P., Marino, A. F., Cordoni, G., & Tailo, M. 2019, AJ, 158, 202
2019
-
[38]
2022, ApJS, 263, 20
Lee, J.-W. 2022, ApJS, 263, 20
2022
-
[39]
V., Milone, A
Legnardi, M. V., Milone, A. P., Armillotta, L., et al. 2022, MNRAS, 513, 735
2022
-
[40]
V., Milone, A
Legnardi, M. V., Milone, A. P., Cordoni, G., et al. 2023, MNRAS, 522, 367
2023
-
[41]
V., Milone, A
Legnardi, M. V., Milone, A. P., Cordoni, G., et al. 2024, A&A, 687, A160
2024
-
[42]
2022, Research in Astronomy and Astrophysics, 22, 095004
Li, C., Zheng, Z., Li, X., et al. 2022, Research in Astronomy and Astrophysics, 22, 095004
2022
-
[43]
R., Griggio, M., et al
Libralato, M., Bedin, L. R., Griggio, M., et al. 2024, arXiv e-prints, arXiv:2411.02487
2024
-
[44]
R., et al
Libralato, M., Bellini, A., Bedin, L. R., et al. 2015, MNRAS, 450, 1664
2015
-
[45]
2022, ApJ, 934, 150
Libralato, M., Bellini, A., Vesperini, E., et al. 2022, ApJ, 934, 150
2022
-
[46]
2011, A&A, 527, A148
Lind, K., Charbonnel, C., Decressin, T., et al. 2011, A&A, 527, A148
2011
-
[47]
D., Da Costa, G
Mackey, A. D., Da Costa, G. S., Ferguson, A. M. N., & Yong, D. 2013, ApJ, 762, 65
2013
-
[48]
F., Milone, A
Marino, A. F., Milone, A. P., Yong, D., et al. 2014, MNRAS, 442, 3044
2014
-
[49]
F., Villanova, S., Piotto, G., et al
Marino, A. F., Villanova, S., Piotto, G., et al. 2008, A&A, 490, 625
2008
-
[50]
2024, arXiv e-prints, arXiv:2405.13498
Massari, D., Dalessandro, E., Erkal, D., et al. 2024, arXiv e-prints, arXiv:2405.13498
2024
-
[51]
J., Milone, A
Mehta, V. J., Milone, A. P., Casagrande, L., et al. 2025, MNRAS, 536, 1077
2025
-
[52]
Milone, A. P. & Marino, A. F. 2022, Universe, 8, 359
2022
-
[53]
P., Marino, A
Milone, A. P., Marino, A. F., Bedin, L. R., et al. 2019, MNRAS, 484, 4046
2019
-
[54]
P., Marino, A
Milone, A. P., Marino, A. F., Bedin, L. R., et al. 2014, MNRAS, 439, 1588
2014
-
[55]
P., Marino, A
Milone, A. P., Marino, A. F., Piotto, G., et al. 2013, ApJ, 767, 120
2013
-
[56]
P., Marino, A
Milone, A. P., Marino, A. F., Piotto, G., et al. 2015, ApJ, 808, 51
2015
-
[57]
P., Marino, A
Milone, A. P., Marino, A. F., Renzini, A., et al. 2018, MNRAS, 481, 5098
2018
-
[58]
P., Piotto, G., King, I
Milone, A. P., Piotto, G., King, I. R., et al. 2010, ApJ, 709, 1183
2010
-
[59]
P., Villanova, S., Bedin, L
Milone, A. P., Villanova, S., Bedin, L. R., et al. 2006, A&A, 456, 517
2006
-
[60]
P., Stetson, P
Monelli, M., Milone, A. P., Stetson, P. B., et al. 2013, MNRAS, 431, 2126
2013
-
[61]
P., Piotto, G., et al
Nardiello, D., Milone, A. P., Piotto, G., et al. 2015, A&A, 573, A70
2015
-
[62]
Norris, J. E. 2004, ApJ, 612, L25
2004
-
[63]
2021, ApJ, 908, 102
Pietrinferni, A., Hidalgo, S., Cassisi, S., et al. 2021, ApJ, 908, 102
2021
-
[64]
R., Anderson, J., et al
Piotto, G., Bedin, L. R., Anderson, J., et al. 2007, ApJ, 661, L53
2007
-
[65]
P., Anderson, J., et al
Piotto, G., Milone, A. P., Anderson, J., et al. 2012, ApJ, 760, 39
2012
-
[66]
P., Bedin, L
Piotto, G., Milone, A. P., Bedin, L. R., et al. 2015, AJ, 149, 91
2015
-
[67]
2017, MNRAS, 469, L63
Renzini, A. 2017, MNRAS, 469, L63
2017
-
[68]
B., Anderson, J., Brewer, J., et al
Richer, H. B., Anderson, J., Brewer, J., et al. 2006, Science, 313, 936
2006
-
[69]
B., Heyl, J., Anderson, J., et al
Richer, H. B., Heyl, J., Anderson, J., et al. 2013, ApJ, 771, L15
2013
-
[70]
2019, A&A, 629, A40
Salaris, M., Cassisi, S., Mucciarelli, A., & Nardiello, D. 2019, A&A, 629, A40
2019
-
[71]
R., Chaboyer, B., et al
Sarajedini, A., Bedin, L. R., Chaboyer, B., et al. 2007, AJ, 133, 1658
2007
-
[72]
Sbordone, L., Bonifacio, P., Castelli, F., & Kurucz, R. L. 2004, Mem- orie della Societa Astronomica Italiana Supplementi, 5, 93
2004
-
[73]
2011, A&A, 534, A9
Sbordone, L., Salaris, M., Weiss, A., & Cassisi, S. 2011, A&A, 534, A9
2011
-
[74]
2022, A&A, 662, A112
Scaramella, R., Amiaux, J., Mellier, Y., et al. 2022, A&A, 662, A112
2022
-
[75]
2022, A&A, 662, A92
Schirmer, M., Jahnke, K., Seidel, G., et al. 2022, A&A, 662, A92
2022
-
[76]
1969, ApJ, 158, L139
Spitzer, Jr., L. 1969, ApJ, 158, L139
1969
-
[77]
Stetson, P. B. 2000, PASP, 112, 925
2000
-
[78]
B., Pancino, E., Zocchi, A., Sanna, N., & Monelli, M
Stetson, P. B., Pancino, E., Zocchi, A., Sanna, N., & Monelli, M. 2019, MNRAS, 485, 3042
2019
-
[79]
& van der Marel, R
Trenti, M. & van der Marel, R. 2013, MNRAS, 435, 3272
2013
-
[80]
A., & Asplund, M
Yong, D., Grundahl, F., Johnson, J. A., & Asplund, M. 2008, ApJ, 684, 1159
2008
-
[81]
P., Marino, A
Zennaro, M., Milone, A. P., Marino, A. F., et al. 2019, MNRAS, 487, 3239
2019
-
[82]
F., et al
Ziliotto, T., Milone, A., Marino, A. F., et al. 2023, ApJ, 953, 62
2023
-
[83]
P., Cordoni, G., et al
Ziliotto, T., Milone, A. P., Cordoni, G., et al. 2025, arXiv e-prints, arXiv:2502.03140 Article number, page 19 of 21 A&A proofs: manuscript no. ms Appendix A: HST and JWST images The TableA provides the main information on the images of NGC6397 collected byHST and JWST and us...
2022 arXiv
-
[84]
Notably, the MS width, WF110W,F160W, measured 2.0 magnitudes below the MS knee, exhibits strong correlations with both cluster mass and internal oxy- gen variation
M-dwarfs, Dondoglio and collaborators concluded that the properties of multiple populations vary significantly be- tween clusters. Notably, the MS width, WF110W,F160W, measured 2.0 magnitudes below the MS knee, exhibits strong correlations with both cluster mass and internal o...
2022
Reviewed August 10, 2026 · model on record in the stance chip above.
Discussion (0). Continue with ORCID to comment.