REVIEW 2 major objections 5 minor 24 references
Mathematical analysis of a two-strain disease model with amplification
T0 review · 2 major / 5 minor · reviewed 2026-08-14 · deepseek-v4-flash
Pith's one-line read The paper establishes a threshold dichotomy for a two-strain SIR model with amplification: the long-term winner is decided by comparing $R_{0s}$ and $R_{0m}$ with each other and with 1.
desk verdict The coexistence-stability proof is false as stated; the paper's useful insight about amplification needs a corrected analysis before it is citable. read the letter →
The pith
A machine-rendered reading of the paper's core claim, the machinery that carries it, and where it could break.
The reading
What carries the argument
The load-bearing object is the next-generation matrix $K=-T\Sigma^{-1}$ for the infection subsystem, whose dominant eigenvalues are $R_{0s}$ and $R_{0m}$. These two numbers set the susceptible compartment size at each endemic equilibrium, appear as eigenvalues in the local stability calculations, and their ordering relative to each other and to one determines which equilibrium attracts the system. The amplification parameter $\rho$ couples $I_s$ to $I_m$ in the transition matrix $\Sigma$, but it does not alter the reproduction numbers themselves, which is why the invasion conditions reduce to comparisons among $R_{0s}$, $R_{0m}$, and 1.
What would settle it
Replace the mass-action terms by frequency-dependent terms $\beta_s I_s S/N$ and $\beta_m I_m S/N$ in equations (6)-(8), recompute the equilibria, and check whether the condition $R_{0m}>\max[R_{0s},1]$ still forces extinction of the susceptible strain; any shift in the boundary would show the homogeneous-mixing assumption is load-bearing. Alternatively, fit the model to a longitudinal dataset in which strain replacement is observed and test whether the endpoint follows the two reproduction numbers regardless of the estimated amplification rate.
Extended reading notes
Core claim
At its core, the paper argues that the reduced system (6)-(8) has exactly three equilibria and that their stabilities are ordered by the reproduction numbers. The disease-free equilibrium is globally asymptotically stable when $\max[R_{0s},R_{0m}]<1$; the resistant-only equilibrium $E_1$ is globally asymptotically stable when $R_{0m}>\max[R_{0s},1]$; and the coexistence equilibrium $E_2$ exists and is locally asymptotically stable when $R_{0s}>\max[R_{0m},1]$. The expressions $R_{0s}=\Lambda\beta_s/(\mu\chi_s)$ and $R_{0m}=\Lambda\beta_m/(\mu\chi_m)$, with $\chi_s=\omega_s+\phi_s+\mu$ and $\chi_m=\omega_m+\phi_m+\mu$, show that neither reproduction number contains $\rho$. The paper further shows that the susceptible strain need not be the most prevalent at equilibrium even when $R_{0s}>R_{0m}$, because resistant prevalence is sustained by both direct transmission and the amplification flux.
Load-bearing premise
The load-bearing premise is the mass-action incidence structure in equations (6)-(8), with constant contact rates and homogeneous mixing; if the force of infection is frequency-dependent, density-dependent in another way, or contact rates change with treatment, the invasion thresholds can shift and the predicted resistant-only or coexistence regimes need not hold.
Editorial extensions
If this is right
- When $R_{0m}>\max[R_{0s},1]$, every solution in the feasible region approaches the resistant-only equilibrium, so removing susceptible infections faster cannot prevent resistant persistence.
- When $R_{0s}>\max[R_{0m},1]$, the strains coexist stably, and the resistant strain can be more prevalent than the susceptible strain even though its own reproduction number is smaller.
- Raising the susceptible-strain treatment rate lowers total equilibrium prevalence, but the resistant-strain prevalence responds non-monotonically and can overshoot its resistant-only equilibrium when amplification is high.
- Because $\rho$ appears in neither $R_{0s}$ nor $R_{0m}$, an intervention that changes only the amplification proportion changes equilibrium prevalences but not the invasion thresholds.
Reading between the lines
- If the same model used frequency-dependent rather than mass-action incidence, the threshold comparisons would likely change; testing this alternative would reveal how much of the dichotomy depends on homogeneous mixing.
- The structure suggests a broader principle for one-way mutation or amplification models: each strain's invasion criterion is its own single-strain reproduction number, so competitive outcomes may often reduce to comparing those numbers rather than fitting the full coupled dynamics.
- A natural empirical check is to fit $R_{0s}$, $R_{0m}$, and $\rho$ to longitudinal strain-prevalence data from a treated population and test whether the observed endpoint tracks the reproduction-number ordering; residual mismatches would point to missing mechanisms such as superinfection or within-host competition.
Signed reviews
Editorial analysis
A structured set of objections, weighed in public.
Referee Report
Summary. The manuscript develops a four-compartment SIR model with two pathogen strains, drug-susceptible and drug-resistant, coupled by an amplification term that moves treated susceptible-infected individuals into the resistant-infected compartment. The authors use the next-generation matrix to define species-specific reproduction numbers R0s and R0m, show they are independent of the amplification rate rho, derive three equilibria (disease-free, resistant-only, and coexistence), and state threshold results: if R0m > max(R0s,1) the susceptible strain is eliminated while the resistant strain persists, whereas if R0s > max(R0m,1) both strains persist. Stability is addressed with Routh-Hurwitz conditions and Lyapunov functions, followed by a PRCC sensitivity analysis and numerical simulations of equilibrium prevalence.
Significance. The subject is of public-health interest because it addresses how inadequate treatment can generate drug-resistant strains, and the derived equilibrium expressions are explicit. The basic reproduction number calculation is standard and correct, and the result that R0s and R0m do not depend on the amplification rate is clearly established. The numerical work illustrates the baseline behavior. However, the central qualitative claim is not established by the proofs as written, because the coexistence-stability lemma is false; if the authors repair this, the paper could make a meaningful contribution to the literature on resistance emergence.
major comments (2)
- [§3.3, Lemma 3] The proof asserts that the Routh-Hurwitz condition A1A2>A3 is satisfied, but this assertion is not demonstrated and is in fact false. For the valid parameter set μ=Λ=10^-4, χs=1, χm=10^-3, ωs=0.9999, ϕs=0, ωm=0, ϕm=0.0009, ρ=1, βs=2, βm=1.5×10^-3, one obtains R0s=2 and R0m=1.5, so E2 exists by equation (14). Using the paper's definitions, Ψ≈0.25002, A1=4.5×10^-4, A2≈2.51×10^-5, A3=2.5×10^-8, and A1A2≈1.13×10^-8, which is strictly less than A3. The Routh-Hurwitz criterion therefore fails and E2 is locally unstable. This invalidates the proof of the coexistence branch of the central claim (abstract and §5-6) and the equilibrium prevalence analysis in Section 4 that uses the E2 formulas. The authors should either prove a stabilization condition for the parameter region, add the missing condition A1A2>A3 to the theorem, or replace the local-stability argument with a rigorous persistence/coexistence proof.
- [§3.2, Lemma 2] The global stability proof for E1 combines the statement Is(t)→0 with a Lyapunov analysis of the reduced system on the invariant plane Is=0. As written, the step from 'the plane Is=0 attracts all solutions' to 'the full 3D system converges to E1' is an implicit limiting argument. This step should be justified with an explicit theorem on asymptotically autonomous systems (or a direct Lyapunov argument on the full system), otherwise the resistant-only branch of the central claim is not fully proven.
minor comments (5)
- [Abstract] The phrase 'if (R0s,R0m)>1' is ambiguous; it should read 'if max(R0s,R0m)>1'.
- [§3.3] The line 'A3 = det(J2) < 0' is inconsistent with the Routh-Hurwitz notation; since the condition is A3>0 with A3=-det(J2), this line should be corrected.
- [§3.1] In the proof of Lemma 1, the bound S(t) ≤ S0 used in equation (16) requires the initial condition to lie in the feasible region D; this restriction should be stated before the integration.
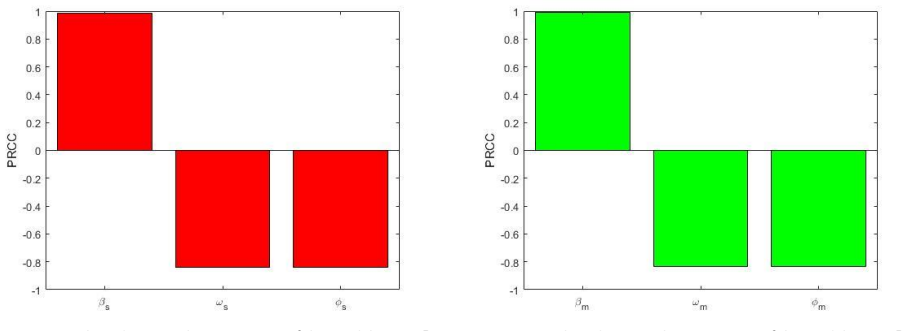
- [Section 4] The PRCC analysis states that 100,000,000 simulations are performed with uniform distributions, but the ranges of the parameter distributions are not reported, so the sensitivity results are not reproducible. Please provide these ranges.
- [Section 4, Table 2] The sensitivity indices are computed for R0s and R0m, but the table caption should specify this explicitly.
Circularity Check
No significant circularity: R0 thresholds are derived from the model via the next-generation matrix, and the only self-citation is non-load-bearing.
full rationale
The paper's central claims are not circular. The reproduction numbers R0s and R0m are computed from the model equations (6)-(8) using the standard next-generation matrix method, and the threshold statements in the abstract follow from the eigenvalues and Routh-Hurwitz analysis of those same equations. No parameter is fitted to data and then renamed as a prediction; the sensitivity analysis is descriptive rather than part of the derivation. The self-citation to Meehan et al. [16] for the claim that the reproduction numbers are independent of the amplification rate ρ is not load-bearing, because the explicit formulas (a) and (b) in the same paper contain no ρ, so the claim is established directly by the paper's own algebra. The proof of Lemma 3 is flagged by external scrutiny as containing an unsupported or incorrect Routh-Hurwitz step, but that is a mathematical correctness concern, not a circularity concern, since the asserted inequality is not assumed as an input to the derivation. The derivation chain is self-contained against the model equations, and no circular step of the kinds enumerated is present.
Assumptions & free parameters
free parameters (2)
- Baseline contact rates beta_s and beta_m =
not stated
- PRCC parameter distributions and ranges =
not stated
assumptions (4)
- domain assumption The population is homogeneously mixed and incidence is mass action (beta S I).
- domain assumption Recovered individuals have lifelong immunity to both strains.
- ad hoc to paper Amplification moves individuals directly from Is to Im at rate rho*omega_s.
- standard math Next generation matrix method yields the relevant invasion thresholds.
Cite this review
Pith. "Pith review of Mathematical analysis of a two-strain disease model with amplification." pith.science (2026). https://pith.science/paper/6SBBU4R5
@misc{pith2026190807837,
  author       = {Pith},
  title        = {Pith review of: Mathematical analysis of a two-strain disease model with amplification},
  year         = {2026},
  howpublished = {\url{https://pith.science/paper/6SBBU4R5}},
  note         = {Machine review of arXiv:1908.07837}
}
abstract
We investigate a two-strain disease model with amplification to simulate the prevalence of drug-susceptible (s) and drug-resistant (m) disease strains. We model the emergence of drug resistance as a consequence of inadequate treatment, i.e. amplification. We perform a dynamical analysis of the resulting system and find that the model contains three equilibrium points: a disease-free equilibrium; a mono-existent disease-endemic equilibrium with respect to the drug-resistant strain; and a co-existent disease-endemic equilibrium where both the drug-susceptible and drug-resistant strains persist. We found two basic reproduction numbers: one associated with the drug-susceptible strain $R_{0s}$; the other with the drug-resistant strain $R_{0m}$,and showed that at least one of the strains can spread in a population if ($R_{0s}$,$R_{0m}$) > 1 (epidemic).Furthermore, we also showed that if $R_{0m}$ > max($R_{0s}$,1), the drug-susceptible strain dies out but the drug-resistant strain persists in the population; however if $R_{0s}$ > max($R_{0m}$,1), then both the drug-susceptible and drug-resistant strains persist in the population. We conducted a local stability analysis of the system equilibrium points using the Routh-Hurwitz conditions and a global stability analysis using appropriate Lyapunov functions. Sensitivity analysis was used to identify the most important model parameters through the partial rank correlation coefficient (PRCC) method. We found that the contact rate of both strains had the largest influence on prevalence. We also investigated the impact of amplification and treatment rates of both strains on the equilibrium prevalence of infection; results suggest that poor quality treatment make coexistence more likely but increase the relative abundance of resistant infections.
Figures


Reference graph
Works this paper leans on
-
[1]
M.O. Fofana, S. Shrestha, G.M. Knight, T. Cohen, R.G. White, F. Cobelens, D.W. Dowdy, A multistrain mathematical model to investigate the role of pyrazinamide in the emergence of extensively drug-resistant tuberculosis, Antimicrobial agents and chemotherapy 61(3) (2017) 00498- 16
work page 2017
-
[2]
O. Sharomi, A. Gumel, Dynamical analysis of a multi -strain model of HIV in the presence of anti- retroviral drugs, Journal of Biological Dynamics 2(3) (2008) 323-345
work page 2008
- [3]
-
[4]
R. Laxminarayan, A. Duse, C. Wattal, A.K. Zaidi, H.F. Wertheim, N. Sumpradit, E. Vlieghe, G.L. Hara, I.M. Gould, H. Goossens, Antibiotic resistance —the need for global solutions, The Lancet Infectious Diseases 13(12) (2013) 1057-1098
work page 2013
- [5]
- [6]
- [7]
-
[8]
P.J. Dodd, C. Sismanidis, J.A. Seddon, Global burden of drug -resistant tuberculosis in children: a mathematical modelling study, The Lancet Infectious Diseases 16(10) (2016) 1193-1201
work page 2016
Show all 24 references
-
[9]
Mistry, M
N. Mistry, M. Tolan i, D. Osrin, Drug -resistant tuberculosis in Mumbai, India: An agenda for operations research, Operations Research for Health Care 1(2-3) (2012) 45-53
2012
-
[10]
McBryde, M.T
E.S. McBryde, M.T. Meehan, T.N. Doan, R. Ragonnet, B.J. Marais, V. Guernier, J.M. Trauer, The risk o f global epidemic replacement with drug -resistant Mycobacterium tuberculosis strains, International Journal of Infectious Diseases 56 (2017) 14-20
2017
-
[11]
Davies, Drug-resistant tuberculosis, Journal of the Royal Society of Medicine 94(6) (2001) 261-263
P.D.O. Davies, Drug-resistant tuberculosis, Journal of the Royal Society of Medicine 94(6) (2001) 261-263
2001
-
[12]
Stengel, Mutation and control of the human immuno deficiency virus, Mathematical Biosciences 213(2) (2008) 93-102
R.F. Stengel, Mutation and control of the human immuno deficiency virus, Mathematical Biosciences 213(2) (2008) 93-102
2008
-
[13]
Diekmann, J
O. Diekmann, J. Heesterbeek, M.G. Roberts, The construction of next -generation matrices for compartmental epidemic models, Journal of the Royal Society Interface 7(47) (2009) 873-885
2009
-
[14]
van den Driessche, Reproduction numbers of infectious disease models, Infectious Disease Modelling 2(3) (2017) 288-303
P. van den Driessche, Reproduction numbers of infectious disease models, Infectious Disease Modelling 2(3) (2017) 288-303
2017
-
[15]
Childs, N.N
L.M. Childs, N.N. Abuelezam, C. Dye, S. Gupta, M.B. Murray, B.G. Williams, C.O. Buckee, Modelling challenges in context: Lessons from malaria, HIV, and tuberculosis, Epidemics 10 (2015) 102-107
2015
-
[16]
Meehan, D.G
M.T. Meehan, D.G. Cocks, J.M. Trauer, E.S. McBryde, Coupled, multi -strain epidemic models of mutating pathogens, Mathematical Biosciences 296 (2018) 82-92
2018
-
[17]
Y. Yang, J. Li, Z. Ma, L. Liu, Global stability of two models with incomplete treatment for tuberculosis, Chaos, Solitons & Fractals 43(1-12) (2010) 79-85
2010
-
[18]
Ullah, M.A
S. Ullah, M.A. Khan, M. Farooq, T. Gul, Modeling and analysis of Tuberculosis (TB) in Khyber Pakhtunkhwa, Pakistan, Mathematics and Computers in Simulation (2019)
2019
-
[19]
Trauer, J.T
J.M. Trauer, J.T. Denholm, E.S. McBryde, Construction of a mathematical model for tuberculosis transmission in highly endemic regions of the Asia-Pacific, Journal of Theoretical Biology 358 (2014) 74-84
2014
-
[20]
DeJesus, C
E.X. DeJesus, C. Kaufman, Routh-Hurwitz criterion in the examination of eigenvalues of a system of nonlinear ordinary differential equations, Physical Review A 35(12) (1987) 5288. 22
1987
-
[21]
Bremermann, H
H.J. Bremermann, H. Thieme, A competitive exclusion principle for pathogen virulence, Journal of Mathematical Biology 27(2) (1989) 179-190
1989
-
[22]
Korobeinikov, P.K
A. Korobeinikov, P.K. Maini, A Lyapunov function and global properties for SIR and SEIR epidemiological models with nonlinear incidence, Mathematical Biosciences and Engineering 1(1) (2004) 57-60
2004
-
[23]
Chitnis, J.M
N. Chitnis, J.M. Hyman, J.M. Cushing, Determining important parameters in the spread of malaria through the sensitivity analysis of a mathematical model, Bulletin of Mathematical Biology 70(5) (2008) 1272
2008
-
[24]
Munita, C.A
J.M. Munita, C.A. Arias, Mechanisms of antibiotic resistance, Microbiology Spectrum 4(2) (2016) 0016
2016
Reviewed August 14, 2026 · model on record in the stance chip above.
Discussion (0). Continue with ORCID to comment.