REVIEW 4 major objections 4 minor 1 cited by
The survey of planetary nebulae in Andromeda (M31) VII. Predictions of a major merger simulation model compared with chemodynamical data of the disc and inner halo substructures
T0 review · 4 major / 4 minor · reviewed 2026-08-09 · deepseek-v4-flash
Pith's one-line read This paper claims M31's inner-halo substructures and hot thick disc are the remnant of a major 1:4 merger that happened roughly 3 Gyr ago, and that a single simulation with a simple chemical model can explain their kinematics…
desk verdict A useful, honest modeling comparison with genuinely new predictions, but the phase-space matches lean on an adjustable viewing angle and a single snapshot, so the 'strong independent arguments' wording overreaches. read the letter →
The pith
A machine-rendered reading of the paper's core claim, the machinery that carries it, and where it could break.
The reading
What carries the argument
The central object is a 1:4 wet major-merger N-body hydrodynamical simulation (model #336 of the H18 library, with 20 million particles), combined with a chemical model: the initial stellar and gaseous discs of the two progenitors are given linear oxygen abundance gradients calibrated by the stellar mass-metallicity relation at z about 1 and by the oxygen abundances of M31 planetary nebulae, and the simulation then advects and enriches those particles. At redshift zero, density-based clustering (DBSCAN) is used to separate the multiple components of the GSS and the two shelves in the three-dimensional particle distribution, and projected phase-space diagrams of projected radius versus line-of-sight velocity are used to identify wedges, chevrons, and stream-like ridges for comparison with observations.
What would settle it
A wide-field spectroscopic survey of M31's inner halo that includes stars with [M/H] below -0.5 dex should detect the metal-poor W-shelf component and the main-progenitor wedge in the NE shelf if the model is correct; their absence would weaken the major-merger interpretation. Alternatively, rotating the simulation by the permitted +7 to +10 degrees in kinetic angle should substantially change the density of GSS-component [3] and the visibility of coherent phase-space features, so an orientation-independent match would be a stronger test.
Extended reading notes
Core claim
On the paper's own terms, the major-merger model predicts (i) multiple distinct components within each of the three substructures, (ii) high mean metallicity and large spread in the GSS and NE and W shelves that match photometric and spectroscopic measurements, (iii) simulated phase-space diagrams that qualitatively reproduce the wedges, chevrons, and stream features seen in the DESI data, (iv) a large distance spread along the GSS as suggested by tip-of-the-red-giant-branch studies, and (v) phase-space ridges produced by several wraps of the secondary as well as by main-progenitor disc stars scattered onto the same orbits. The authors read these as independent arguments for a major satellite merger in M31 about 3 Gyr ago, and as a coherent explanation for the hot thick disc, the star formation burst, and the substructures that make M31 look so different from the Milky Way.
Load-bearing premise
The comparison treats one snapshot of an ongoing simulation, viewed at a specific orientation, as the present-day M31, and the third rotation angle (kinetic angle) is only known to about plus or minus ten degrees, so the detailed alignment of the predicted phase-space ridges with the DESI data could shift or disappear if the real galaxy is oriented differently or is at a different merger phase.
Editorial extensions
If this is right
- The GSS is expected to be a composite of overlapping loops at different line-of-sight distances, not a single trailing tidal tail, so future distance measurements along the stream should reveal multiple peaks rather than one distance.
- The NE shelf should show a double-wedge pattern, one wedge from the secondary debris and one from main-disc stars dragged along, with distinct apocentres that differ from minor-merger predictions.
- The W shelf should contain a relatively metal-poor main-progenitor component that the current DESI metallicity cut at [M/H] > -0.5 dex would miss, so a deeper survey is a direct test.
- The metallicity kink seen along the GSS at projected radii near 40-50 kpc can be explained by superposition of wedges without invoking a steep initial metallicity gradient.
- Photometric metallicities that assume a single old stellar age for the substructures are likely biased toward younger, more metal-rich stars, since selecting model stars younger than 3.5 Gyr improves the match to those measurements.
Reading between the lines
- If the major-merger picture holds, M31 becomes a nearby laboratory for studying how a 1:4 merger heats a disc, rebuilds a thin disc from infalling gas, and populates the inner halo with multi-wrap debris; the same physics should be visible in other massive spirals observed with future wide-field spectrographs.
- The model's predicted mixing of main-progenitor disc stars into the GSS and shelves is a distinctive signature: it could be tested chemically by looking for stars with disc-like kinematics but old, metal-rich abundances that do not come from the satellite.
- A natural extension would be to simulate the same merger with several slightly different initial orbits and viewing angles and ask whether the observed DESI wedges are a common outcome or a fine-tuned accident; the paper itself notes that the third viewing angle has about ten degrees of freedom.
- The discrepancy between photometric and spectroscopic metallicity spreads (photometric spreads of about one dex versus model spreads of 0.3-0.5 dex) suggests that age-metallicity degeneracy and line-of-sight superposition are contributing to the observed scatter, which future resolved-star studies with independent age indicators could quantify.
Editorial analysis
A structured set of objections, weighed in public.
Referee Report
Summary. This paper extends the Hammer et al. (2018) 1:4 major-merger simulation of M31 by assigning initial oxygen-abundance gradients to the stellar and gaseous discs of the two progenitors, calibrated with the mass-metallicity relation and planetary-nebula abundances, and then compares the z=0 remnant with chemodynamical data for the M31 disc and the GSS, NE shelf, and W shelf. The model produces multi-component structures in the inner halo, predicted line-of-sight distance spreads, projected phase-space ridges, wedges, and chevrons, and metallicity distributions that are compared with DESI, SPLASH, PAndAS, and PN datasets. The central claim is that the overall agreement provides strong and independent support for a major satellite merger in M31 about 3 Gyr ago.
Significance. If the central claim holds, M31 would be a recent major-merger remnant rather than a quiet spiral like the Milky Way, providing a coherent explanation for the hot disc, the 2-4 Gyr star formation episode, and the inner-halo substructures. The paper's main strength is that the substructure phase-space and metallicity predictions are not fitted to the substructure data: the model is taken from H18, the initial chemical setup is calibrated to disc-scale relations, and the substructure comparisons are then made a posteriori. The paper also states its principal limitations explicitly, including the single-snapshot nature of the simulation and the ±10° uncertainty in the kinetic angle (Appendix D). The comparisons cover multiple independent observational datasets, and the model makes several falsifiable predictions, most notably the multi-component LOS structure of the GSS and the two-wedge structure of the NE and W shelves.
major comments (4)
- [Section 5 / Appendix D] The phase-space ridge comparison rests on a single snapshot and a kinetic angle constrained only to about ±10°, and the paper's own Figure D.1 shows that a +7° change substantially reduces the density of GSS-component [3], which is the component associated with the DESI chevron '1cr/1cb' in Section 5.1. Because the matched features in Figure 12 are identified visually and the model ridges in Figures 7, 9, and 11 are drawn by hand, the claimed 'strong and independent arguments' for a major merger would be considerably strengthened by a robustness analysis: e.g., a scan over the allowed kinetic-angle range and over nearby snapshots, reporting which claimed counterparts survive. As written, the central comparison may be projection- and epoch-dependent.
- [Section 5 / Figures 7, 9, 11, 12] The association between simulated and observed phase-space ridges is made qualitatively by visual inspection of overplotted dashed lines, with phrases such as 'reminiscent of' and 'plausible counterparts' used throughout Section 5. A quantitative comparison would remove the risk of cherry-picking features: for each substructure one could compute a density map in (R_proj, V_LOS) for the simulation, apply the DESI selection function, and use a statistical measure (e.g., a 2D correlation or a likelihood ratio) to test whether the simulated overdensities coincide with the observed wedges and chevrons. Without such a test, the phase-space agreement is suggestive but not yet a quantitative falsifiable prediction.
- [Section 3.2.2 / Table 1 / Figure 2] The initial metallicity gradient of -0.1 dex/kpc is chosen because it reproduces the mean oxygen abundance of the old PNe (Section 3.2.2), so the close agreement for the old disc population shown in the upper panel of Figure 2 is a calibration rather than an independent prediction. The comparison is also only visual: no quantitative goodness-of-fit is reported for the two histograms, and the young-star distribution is offset by about 0.1 dex with a larger width. This does not invalidate the substructure predictions, which are not fitted to the substructure data, but the wording in Section 3.2.2 ('good agreement', 'an important result') should distinguish calibrated from predicted quantities.
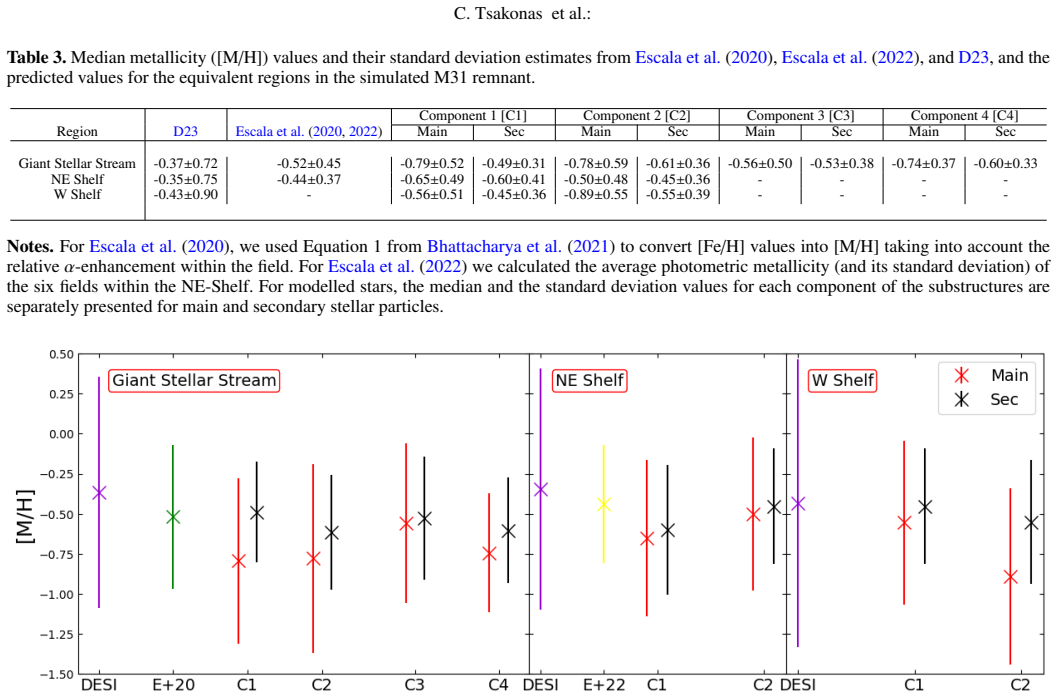
- [Section 6 / Table 3 / Figures 14-16] The claim that predicted metallicities are 'generally consistent' with observations hides several discrepancies of order 0.3-0.5 dex in Table 3: for example, the DESI GSS median is -0.37 dex while the corresponding model components have medians of -0.78 to -0.53 dex, and the DESI W-shelf value is -0.43 dex while W-component [2] from the main progenitor has -0.89 dex. Moreover, the model's sigma[M/H] of about 0.3-0.5 dex is systematically narrower than the photometric sigma[M/H] of about 0.7-1.0 dex from Conn et al. (2016) and Ogami et al. (2025). The age-bias argument in Appendix E is plausible, but it is invoked without a quantitative model of the photometric selection; a quantitative accounting (e.g., applying the D23 color cut and the TRGB-bright-star selection to the simulation) would make the comparison convincing.
minor comments (4)
- [Section 2.1] The abstract and conclusions state a merger '~3 Gyr ago', but Section 2.1 gives the coalescence time interval as 1.8-3 Gyr ago; please harmonize the timing statement throughout.
- [Section 4.1] In the paragraph after Figure 6, 'the S-components [1], [2], and [4]' appears to be a typo for 'GSS-components [1], [2], and [4]'.
- [Section 2.2] The choice of PA = 30° instead of the commonly cited PA = 38° is stated without a reference or a quantitative test; a brief justification or citation would help the reader assess the orientation uncertainty.
- [Equation (1) and Section 6] The assumption that [M/H] = [Fe/H] with alpha/Fe = 0.0 is used globally, but Section 6 converts the Escala et al. (2020) values using an alpha-enhancement correction; the paper should state explicitly where the solar-alpha assumption is applied and where it is relaxed.
Circularity Check
No significant circularity: the model's substructure metallicity and phase-space predictions are checked against external data not used in the model calibration.
full rationale
The paper's derivation chain is not circular. The H18 major-merger simulation is prior work by overlapping authors, but the new chemodynamical predictions are compared against datasets that were not used to build or calibrate the model: DESI (D23), Escala et al. (2020, 2022), Conn et al. (2016), Ogami et al. (2025), and the PNe samples of Bhattacharya et al. (2022) for the disc. The initial metallicity gradient is constrained using the MZR and checked against old PNe in the M31 disc (Section 3.2.2); the substructure metallicity predictions in Section 6 are for different spatial populations (halo tidal debris) and are not the fitted quantity. The phase-space ridges, wedges, and chevrons in Figures 7, 9, and 11 are outputs of the simulation and are subsequently matched to DESI features; no phase-space observable was used as a fitting target. The paper discloses the main limitations in Section 5 and Appendix D: a single snapshot and a ±10° freedom in the kinetic angle, with Figure D.1 showing sensitivity of GSS-component [3]. This is a robustness and selection-effect caveat, not a circular reduction, because the orientation was chosen to match surface-brightness morphology rather than the phase-space ridges or metallicities. Self-citations to H18 and Bhattacharya et al. (2023) define the model and prior interpretations but are not the sole support for the central claim, which is independently checked against external benchmarks.
Assumptions & free parameters
free parameters (5)
- Initial central oxygen abundance, main progenitor =
9.0 dex (12+log(O/H))
- Initial central oxygen abundance, secondary progenitor =
8.75 dex
- Initial metallicity gradient =
-0.1 +/- 0.05 dex/kpc (all four discs)
- DBSCAN eps and minPts per substructure =
eps=3.9/250, 4.1/78 (GSS); 2/100 (NE); 2.6/137 (W)
- Kinetic angle (LOS alignment) =
best fit value with +/-10 deg leeway
assumptions (5)
- domain assumption The H18 model #336 is a representative M31 analogue.
- domain assumption Instantaneous recycling chemical enrichment (SN II only; no SN Ia) is adequate for the stellar populations probed.
- domain assumption The adopted MZR of Rodrigues et al. (2008) at z~1 describes the progenitor metallicities.
- standard math [M/H] = [Fe/H] with alpha/Fe = 0.
- domain assumption Stars older/younger than 3.5 Gyr map to old/young PNe populations.
Cite this review
Pith. "Pith review of The survey of planetary nebulae in Andromeda (M31) VII. Predictions of a major merger simulation model compared with chemodynamical data of the disc and inner halo substructures." pith.science (2026). https://pith.science/paper/6TYV6MIJ
@misc{pith2026250200886,
  author       = {Pith},
  title        = {Pith review of: The survey of planetary nebulae in Andromeda (M31) VII. Predictions of a major merger simulation model compared with chemodynamical data of the disc and inner halo substructures},
  year         = {2026},
  howpublished = {\url{https://pith.science/paper/6TYV6MIJ}},
  note         = {Machine review of arXiv:2502.00886}
}
read the original abstract
The nearest giant spiral, M31, exhibits a kinematically hot stellar disc, a global star formation episode ~2-4 Gyr ago, and conspicuous substructures in its stellar halo that are suggestive of a recent accretion event. Recent chemodynamical measurements in the M31 disc and inner halo can be used as additional constraints for N-body hydrodynamical simulations that successfully reproduce the disc age-velocity dispersion relation and star formation history as well as the morphology of the inner halo substructures. We combined a simulation of a major merger (mass ratio 1:4) with a well-motivated chemical model to predict abundance distributions and gradients in the merger remnant at z=0. We computed the projected phase space and the [M/H] distributions for the substructures in the M31 inner halo, namely, the Giant Stellar Stream (GSS) and the North-East (NE) and Western (W) shelves, and compared them with recent measurements for the M31 stars in the inner halo. This major merger model predicts (i) multiple distinct components within each of the substructures; (ii) a high mean metallicity and large spread in the GSS and NE and W Shelves which explain various photometric and spectroscopic metallicity measurements; (iii) simulated phase space diagrams that qualitatively reproduce various features identified in the projected phase space of the substructures in published data from the DESI; (iv) a large distance spread in the GSS, as suggested by previous tip of the RGB measurements; and (v) phase space ridges caused by several wraps of the secondary as well as up-scattered main M31 disc stars that also have plausible counterparts in the observed phase spaces. These results provide further strong and independent arguments for a major satellite merger in M31 ~3 Gyr ago and a coherent explanation for many of the observational results that make M31 appear so different from the Milky Way.
Figures


Figures from the paper (12 more)




Forward citations
Cited by 1 Pith paper
-
ChemZz I: Comparing Oxygen and Iron Abundance Patterns in the Milky Way, the Local Group and Cosmic Noon
After placing local and distant galaxy abundances on a common scale, the authors find Milky Way high-alpha disc patterns at z~2-3, evidence for alpha-bimodality in M31, and place the MW and GSE on the z~3 mass-metalli...
Reference graph
Works this paper leans on
-
[3]
Amorisco , N. C. 2017, , 464, 2882
2017
-
[2]
write newline
" write newline "" before.all 'output.state := FUNCTION n.dashify 't := "" t empty not t #1 #1 substring "-" = t #1 #2 substring "--" = not "--" * t #2 global.max substring 't := t #1 #1 substring "-" = "-" * t #2 global.max substring 't := while if t #1 #1 substring * t #2 global.max substring 't := if while FUNCTION word.in bbl.in " " * FUNCTION format....
-
[1]
, " * write output.state after.block = add.period write newline
ENTRY address archiveprefix author booktitle chapter edition editor howpublished institution eprint journal key month note number organization pages publisher school series title type volume year label extra.label sort.label short.list INTEGERS output.state before.all mid.sentence after.sentence after.block FUNCTION init.state.consts #0 'before.all := #1 ...
-
[4]
2022, , 666, A109
Arnaboldi , M., Bhattacharya , S., Gerhard , O., et al. 2022, , 666, A109
2022
-
[5]
J., & Scott , P
Asplund , M., Grevesse , N., Sauval , A. J., & Scott , P. 2009, , 47, 481
2009
-
[6]
J., Ferguson , A
Bernard , E. J., Ferguson , A. M. N., Barker , M. K., et al. 2012, , 420, 2625
2012
-
[7]
J., Ferguson , A
Bernard , E. J., Ferguson , A. M. N., Richardson , J. C., et al. 2015, , 446, 2789
2015
-
[8]
2023, arXiv e-prints, arXiv:2305.03293
Bhattacharya , S. 2023, arXiv e-prints, arXiv:2305.03293
Show all 110 references
-
[9]
2019 a , , 631, A56
Bhattacharya , S., Arnaboldi , M., Caldwell , N., et al. 2019 a , , 631, A56
2019
-
[10]
2022, , 517, 2343
Bhattacharya , S., Arnaboldi , M., Caldwell , N., et al. 2022, , 517, 2343
2022
-
[11]
2021, , 647, A130
Bhattacharya , S., Arnaboldi , M., Gerhard , O., et al. 2021, , 647, A130
2021
-
[12]
2023, , 522, 6010
Bhattacharya , S., Arnaboldi , M., Hammer , F., et al. 2023, , 522, 6010
2023
-
[13]
2019 b , , 624, A132
Bhattacharya , S., Arnaboldi , M., Hartke , J., et al. 2019 b , , 624, A132
2019
-
[14]
2018, , 481, 3210
Bla \ n a D \' az , M., Gerhard , O., Wegg , C., et al. 2018, , 481, 3210
2018
-
[15]
B., Kawata , D., Gibson , B
Brook , C. B., Kawata , D., Gibson , B. K., & Freeman , K. C. 2004, , 612, 894
2004
-
[16]
M., Smith , E., Ferguson , H
Brown , T. M., Smith , E., Ferguson , H. C., et al. 2007, , 658, L95
2007
-
[17]
M., Smith , E., Ferguson , H
Brown , T. M., Smith , E., Ferguson , H. C., et al. 2006, , 652, 323
2006
-
[18]
Bullock , J. S. & Johnston , K. V. 2005, , 635, 931
2005
-
[19]
E., Kalirai , J
Cohen , R. E., Kalirai , J. S., Gilbert , K. M., et al. 2018, , 156, 230
2018
-
[20]
R., McMonigal , B., Bate , N
Conn , A. R., McMonigal , B., Bate , N. F., et al. 2016, , 458, 3282
2016
-
[21]
J., Jonsson , P., Primack , J
Cox , T. J., Jonsson , P., Primack , J. R., & Somerville , R. S. 2006, , 373, 1013
2006
-
[22]
2020 a , , 492, 821
Curti , M., Maiolino , R., Cirasuolo , M., et al. 2020 a , , 492, 821
2020
-
[23]
2020 b , , 491, 944
Curti , M., Mannucci , F., Cresci , G., & Maiolino , R. 2020 b , , 491, 944
2020
-
[24]
J., Fouesneau , M., Hogg , D
Dalcanton , J. J., Fouesneau , M., Hogg , D. W., et al. 2015, , 814, 3
2015
-
[25]
J., Williams , B
Dalcanton , J. J., Williams , B. F., Lang , D., et al. 2012, , 200, 18
2012
-
[26]
2023 a , arXiv e-prints, arXiv:2306.12302
Dey , A., Najita , J., Filion , C., et al. 2023 a , arXiv e-prints, arXiv:2306.12302
2023 arXiv
-
[27]
R., Koposov , S
Dey , A., Najita , J. R., Koposov , S. E., et al. 2023 b , , 944, 1
2023
-
[28]
E., Guhathakurta , P., Seth , A
Dorman , C. E., Guhathakurta , P., Seth , A. C., et al. 2015, , 803, 24
2015
-
[29]
& Bell , E
D'Souza , R. & Bell , E. F. 2021, , 504, 5270
2021
-
[30]
M., Fardal , M., et al
Escala , I., Gilbert , K. M., Fardal , M., et al. 2022, , 164, 20
2022
-
[31]
M., Kirby , E
Escala , I., Gilbert , K. M., Kirby , E. N., et al. 2020, , 889, 177
2020
-
[32]
M., Wojno , J., Kirby , E
Escala , I., Gilbert , K. M., Wojno , J., Kirby , E. N., & Guhathakurta , P. 2021, , 162, 45
2021
-
[33]
N., Gilbert , K
Escala , I., Kirby , E. N., Gilbert , K. M., Cunningham , E. C., & Wojno , J. 2019, , 878, 42
2019
-
[34]
A., Babul , A., Geehan , J
Fardal , M. A., Babul , A., Geehan , J. J., & Guhathakurta , P. 2006, , 366, 1012
2006
-
[35]
A., Babul , A., Guhathakurta , P., Gilbert , K
Fardal , M. A., Babul , A., Guhathakurta , P., Gilbert , K. M., & Dodge , C. 2008, , 682, L33
2008
-
[36]
A., Guhathakurta , P., Babul , A., & McConnachie , A
Fardal , M. A., Guhathakurta , P., Babul , A., & McConnachie , A. W. 2007, , 380, 15
2007
-
[37]
A., Guhathakurta , P., Gilbert , K
Fardal , M. A., Guhathakurta , P., Gilbert , K. M., et al. 2012, , 423, 3134
2012
-
[38]
A., Weinberg , M
Fardal , M. A., Weinberg , M. D., Babul , A., et al. 2013, , 434, 2779
2013
-
[39]
Ferguson , A. M. N., Irwin , M. J., Ibata , R. A., Lewis , G. F., & Tanvir , N. R. 2002, , 124, 1452
2002
-
[40]
Ferguson, A. M. N. & Mackey, A. D. 2016, Substructure and Tidal Streams in the Andromeda Galaxy and its Satellites, ed. H. J. Newberg & J. L. Carlin (Cham: Springer International Publishing), 191--217
2016
-
[41]
S., Johnston , K
Font , A. S., Johnston , K. V., Guhathakurta , P., Majewski , S. R., & Rich , R. M. 2006, , 131, 1436
2006
-
[42]
2021, , 647, A131
Gajda , G., Gerhard , O., Bla \ n a , M., et al. 2021, , 647, A131
2021
-
[43]
M., Torrey , P., Bhagwat , A., et al
Garcia , A. M., Torrey , P., Bhagwat , A., et al. 2025, arXiv e-prints, arXiv:2503.03804
2025 arXiv
-
[44]
J., Fardal , M
Geehan , J. J., Fardal , M. A., Babul , A., & Guhathakurta , P. 2006, , 366, 996
2006
-
[45]
M., Fardal , M., Kalirai , J
Gilbert , K. M., Fardal , M., Kalirai , J. S., et al. 2007, , 668, 245
2007
-
[46]
M., Guhathakurta , P., Kollipara , P., et al
Gilbert , K. M., Guhathakurta , P., Kollipara , P., et al. 2009, , 705, 1275
2009
-
[47]
M., Kirby , E
Gilbert , K. M., Kirby , E. N., Escala , I., et al. 2019, , 883, 128
2019
-
[48]
M., Wojno , J., Kirby , E
Gilbert , K. M., Wojno , J., Kirby , E. N., et al. 2020, , 160, 41
2020
-
[49]
C., Williams , B
Gregersen , D., Seth , A. C., Williams , B. F., et al. 2015, , 150, 189
2015
-
[50]
M., Reitzel , D
Guhathakurta , P., Rich , R. M., Reitzel , D. B., et al. 2006, , 131, 2497
2006
-
[51]
& Piekenbrock, M
Hahsler, M. & Piekenbrock, M. 2025, dbscan: Density-Based Spatial Clustering of Applications with Noise (DBSCAN) and Related Algorithms, r package version 1.2.2
2025
-
[52]
2005, , 430, 115
Hammer , F., Flores , H., Elbaz , D., et al. 2005, , 430, 115
2005
-
[53]
2009, , 507, 1313
Hammer , F., Flores , H., Puech , M., et al. 2009, , 507, 1313
2009
-
[54]
B., Wang , J
Hammer , F., Yang , Y. B., Wang , J. L., et al. 2018, , 475, 2754
2018
-
[55]
R., Millman , K
Harris , C. R., Millman , K. J., van der Walt , S. J., et al. 2020, , 585, 357
2020
-
[56]
2020, , 58, 205
Helmi , A. 2020, , 58, 205
2020
-
[57]
& Johnston , K
Hendel , D. & Johnston , K. V. 2015, , 454, 2472
2015
-
[58]
F., Cox , T
Hopkins , P. F., Cox , T. J., Younger , J. D., & Hernquist , L. 2009, , 691, 1168
2009
-
[59]
F., Hernquist , L., Cox , T
Hopkins , P. F., Hernquist , L., Cox , T. J., Younger , J. D., & Besla , G. 2008, , 688, 757
2008
-
[60]
Hubble , E. P. 1929, , 69, 103
1929
-
[61]
Hunter , J. D. 2007, Computing in Science and Engineering, 9, 90
2007
-
[62]
Ibata , R., Chapman , S., Ferguson , A. M. N., et al. 2004, , 351, 117
2004
-
[63]
Ibata , R., Chapman , S., Ferguson , A. M. N., et al. 2005, , 634, 287
2005
-
[64]
Ibata , R., Irwin , M., Lewis , G., Ferguson , A. M. N., & Tanvir , N. 2001, , 412, 49
2001
-
[65]
S., Guhathakurta , P., Gilbert , K
Kalirai , J. S., Guhathakurta , P., Gilbert , K. M., et al. 2006, , 641, 268
2006
-
[66]
2014, , 66, L10
Kirihara , T., Miki , Y., & Mori , M. 2014, , 66, L10
2014
-
[67]
Kirihara , T., Miki , Y., Mori , M., Kawaguchi , T., & Rich , R. M. 2017, , 464, 3509
2017
-
[68]
2023, , 956, L14
Kobayashi , C., Bhattacharya , S., Arnaboldi , M., & Gerhard , O. 2023, , 956, L14
2023
-
[69]
Kwitter , K. B. & Henry , R. B. C. 2022, , 134, 022001
2022
-
[70]
R., Dolphin , A
Lewis , A. R., Dolphin , A. E., Dalcanton , J. J., et al. 2015, , 805, 183
2015
-
[71]
Longobardi , A., Arnaboldi , M., Gerhard , O., & Mihos , J. C. 2015, , 579, L3
2015
-
[72]
& Mannucci , F
Maiolino , R. & Mannucci , F. 2019, , 27, 3
2019
-
[73]
2014, , 443, 2452
Martig , M., Minchev , I., & Flynn , C. 2014, , 443, 2452
2014
-
[74]
W., Ibata , R., Martin , N., et al
McConnachie , A. W., Ibata , R., Martin , N., et al. 2018, , 868, 55
2018
-
[75]
W., Irwin , M
McConnachie , A. W., Irwin , M. J., Ibata , R. A., et al. 2009, , 461, 66
2009
-
[76]
W., Irwin , M
McConnachie , A. W., Irwin , M. J., Ibata , R. A., et al. 2003, , 343, 1335
2003
-
[77]
R., Kuijken , K., Merrifield , M
Merrett , H. R., Kuijken , K., Merrifield , M. R., et al. 2003, , 346, L62
2003
-
[78]
R., Merrifield , M
Merrett , H. R., Merrifield , M. R., Douglas , N. G., et al. 2006, , 369, 120
2006
-
[79]
Merrifield , M. R. & Kuijken , K. 1998, , 297, 1292
1998
-
[80]
Milo s evi \'c , S., Mi \'c i \'c , M., & Lewis , G. F. 2022, , 511, 2868
2022
-
[81]
Milo s evi \'c , S., Mi \'c i \'c , M., & Lewis , G. F. 2024, , 527, 4797
2024
-
[82]
I., Cavichia , O., et al
Moll \'a , M., D \' az , \'A . I., Cavichia , O., et al. 2019, , 482, 3071
2019
-
[83]
& Rich , R
Mori , M. & Rich , R. M. 2008, , 674, L77
2008
-
[84]
2004, , 418, 989
Nordstr \"o m , B., Mayor , M., Andersen , J., et al. 2004, , 418, 989
2004
-
[85]
2025, , 536, 530
Ogami , I., Tanaka , M., Komiyama , Y., et al. 2025, , 536, 530
2025
-
[86]
R., Frenk , C
Okamoto , T., Eke , V. R., Frenk , C. S., & Jenkins , A. 2005, , 363, 1299
2005
-
[87]
2014, , 444, 237
Pillepich , A., Vogelsberger , M., Deason , A., et al. 2014, , 444, 237
2014
-
[88]
C., Ferguson , A
Richardson , J. C., Ferguson , A. M. N., Johnson , R. A., et al. 2008, , 135, 1998
2008
-
[89]
2021, , 917, 64
Roca-F \`a brega , S., Kim , J.-H., Hausammann , L., et al. 2021, , 917, 64
2021
-
[90]
2008, , 492, 371
Rodrigues , M., Hammer , F., Flores , H., et al. 2008, , 492, 371
2008
-
[91]
Rubin , V. C. & Ford , W. Kent, J. 1970, , 159, 379
1970
-
[92]
2014, , 442, 160
Sadoun , R., Mohayaee , R., & Colin , J. 2014, , 442, 160
2014
-
[93]
P., Opitsch , M., Fabricius , M
Saglia , R. P., Opitsch , M., Fabricius , M. H., et al. 2018, , 618, A156
2018
-
[94]
& Cassisi, S
Salaris, M. & Cassisi, S. 2005, Evolution of stars and stellar populations (John Wiley & Sons)
2005
-
[95]
R., Dolphin , A
Savino , A., Weisz , D. R., Dolphin , A. E., et al. 2025, , 979, 205
2025
-
[96]
S., Bailin , J., Couchman , H., et al
Stinson , G. S., Bailin , J., Couchman , H., et al. 2010, , 408, 812
2010
-
[97]
2016, in Society of Photo-Optical Instrumentation Engineers (SPIE) Conference Series, Vol
Tamura , N., Takato , N., Shimono , A., et al. 2016, in Society of Photo-Optical Instrumentation Engineers (SPIE) Conference Series, Vol. 9908, Ground-based and Airborne Instrumentation for Astronomy VI, ed. C. J. Evans , L. Simard , & H. Takami , 99081M
2016
-
[98]
2010, , 708, 1168
Tanaka , M., Chiba , M., Komiyama , Y., et al. 2010, , 708, 1168
2010
-
[99]
2024, pandas-dev/pandas: Pandas
The pandas development Team . 2024, pandas-dev/pandas: Pandas
2024
-
[100]
B., Rosas-Guevara , Y., Bower , R
Tissera , P. B., Rosas-Guevara , Y., Bower , R. G., et al. 2019, , 482, 2208
2019
-
[101]
2007, , 382, 1050
Tornatore , L., Borgani , S., Dolag , K., & Matteucci , F. 2007, , 382, 1050
2007
-
[102]
A., Heckman , T
Tremonti , C. A., Heckman , T. M., Kauffmann , G., et al. 2004, , 613, 898
2004
-
[103]
L., Evans , N
Watkins , L. L., Evans , N. W., & van de Ven , G. 2013, , 430, 971
2013
-
[104]
White , S. D. M. & Rees , M. J. 1978, , 183, 341
1978
-
[105]
Wiersma , R. P. C., Schaye , J., Theuns , T., Dalla Vecchia , C., & Tornatore , L. 2009, , 399, 574
2009
-
[106]
F., Dolphin , A
Williams , B. F., Dolphin , A. E., Dalcanton , J. J., et al. 2017, , 846, 145
2017
-
[107]
L., Gilbert , K
Wojno , J. L., Gilbert , K. M., Kirby , E. N., et al. 2023, , 951, 12
2023
-
[108]
Wyse , R. F. G. 2001, in Astronomical Society of the Pacific Conference Series, Vol. 230, Galaxy Disks and Disk Galaxies, ed. J. G. Funes & E. M. Corsini , 71--80
2001
-
[109]
L., Prantzos , N., et al
Yin , J., Hou , J. L., Prantzos , N., et al. 2009, , 505, 497
2009
-
[110]
A., Berczik , P., Grebel , E
Zinchenko , I. A., Berczik , P., Grebel , E. K., Pilyugin , L. S., & Just , A. 2015, , 806, 267
2015
Reviewed August 9, 2026 · model on record in the stance chip above.
Discussion (0). Continue with ORCID to comment.