REVIEW 2 major objections 7 minor 6 references
Defence Against the Modern Arts: the Curse of Statistics -- FRStat
T0 review · 2 major / 7 minor · reviewed 2026-08-14 · deepseek-v4-flash
Pith's one-line read FRStat, a statistical tool proposed to support fingerprint identifications, is not safe for casework: its language is mismatched, its ratio is not a likelihood ratio, and its model understates the risk that different donors look alike.
desk verdict A serious critical audit of FRStat that mostly holds up, though its flashiest quantitative claim pools scores from different sampling designs and is weaker than its conceptual arguments. read the letter →
The pith
A machine-rendered reading of the paper's core claim, the machinery that carries it, and where it could break.
The reading
What carries the argument
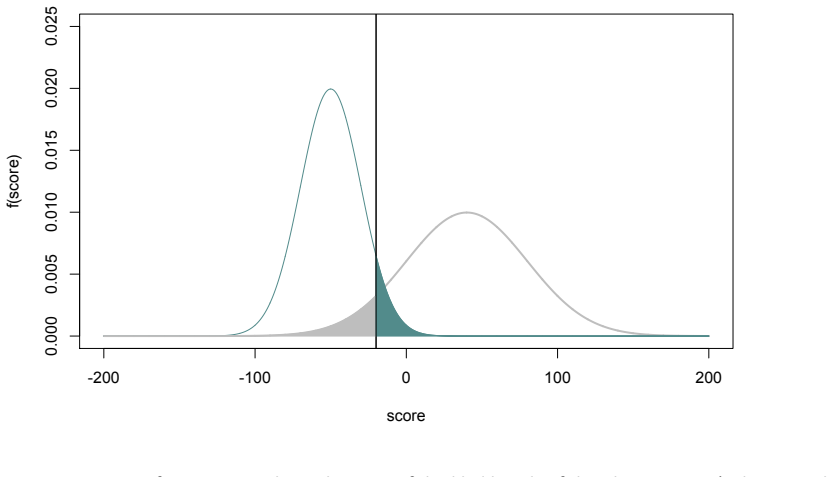
The load-bearing machinery is the pair of sampling distributions FRStat constructs. For each number of corresponding features from 5 to 15, a mixture of logistic distributions—a weighted sum of symmetric, bell-shaped curves with heavier tails than the normal distribution—is fitted to two fixed datasets: 1,996 same-source similarity scores and 2,000 different-source scores. FRStat then reads the left tail of the mated distribution as the false-exclusion risk $\alpha$, the right tail of the non-mated distribution as the false-identification risk $\beta$, and reports the ratio $\alpha/\beta$. The paper's analytical lever is the distinction between these tail areas and the values of the probability densities at the observed score: the 2017 reporting language and a score-based likelihood ratio both require the density at the point, while FRStat's numbers are tail areas, so the two quantities can disagree about which source hypothesis the evidence supports. The paper also uses the Kolmogorov-Smirnov test—a fit test based on the largest gap between observed and proposed distributions—to show why the original fit testing was blind to the bad tail fit, where a tail-weighted Anderson-Darling test would have detected it.
What would settle it
Take a set of latent prints and, for each, retrieve the most similar non-mated control print from a database of at least 100 million prints; run FRStat on those pairs at 15 features and compare the observed proportion of scores above 0, 25, and 50 with the model's expected proportions of 0.073%, 0.007%, and 0.0007%. If the observed proportions match the model, the paper's underestimation claim is refuted; if they are closer to the paper's observed 1.29%, 0.51%, and 0.11%, the claim is supported.
Extended reading notes
Core claim
On the paper's own terms, the central discovery is that FRStat's three reported numbers—the false-exclusion risk $\alpha$, the false-identification risk $\beta$, and the ratio $\alpha/\beta$—do not mean what the tool's accompanying language says they mean. FRStat computes tail probabilities from precomputed, case-independent score distributions, while the 2017 reporting language describes the probability of observing the exact amount of correspondence; the ratio of these tail probabilities is not a likelihood ratio and does not converge to one. Re-analysing the data in the tool's own publication, the paper finds that the mixture-of-logistic model under-predicts high similarity scores between different-donor pairs by large factors, and that when FRStat is scored as a deterministic decision rule, its false-identification rates at realistic thresholds exceed the roughly 1% rate of subjective examination. The conclusion is that FRStat as currently designed cannot support casework conclusions.
Load-bearing premise
The paper's quantitative claim that FRStat underestimates false-identification risk depends on pooling non-mated scores from random-pair experiments with scores from deliberately selected, highly similar pairs; if the selected pairs are more extreme than the casework comparisons FRStat actually faces, the observed tail frequencies and the claimed underestimation are inflated.
Editorial extensions
If this is right
- If the paper is right, FRStat's reported $\alpha$ and $\beta$ cannot be used in the 2017 reporting language without misstating what the numbers mean: the statement describes a probability at the observed level of correspondence, while FRStat supplies tail probabilities.
- The $\alpha/\beta$ ratio has no justified tipping point at one; treating values above one as supporting a common source is an unsupported inference that in the paper's simulations can disagree with the likelihood ratio and overstate the weight of evidence for the prosecution.
- The logistic-mixture tails understate the frequency of high similarity scores between different donors, so the false-identification risk delivered to a court is too low in exactly the high-similarity cases where FRStat is used.
- As a deterministic decision rule, FRStat would need extremely high thresholds to reach the roughly 1% false-positive rate of subjective examination, and at those thresholds most genuine identifications would be missed; at lower, realistic thresholds its error rates exceed the subjective process.
Reading between the lines
- Extending the paper's logic, any score-based forensic tool that learns its different-source distribution from random pairs and fits a thin-tailed parametric model should be expected to understate rare near-match events; courts should ask for tail-weighted validation before admitting such tools.
- The paper's own pooling caveat leaves a decisive test open: re-fit FRStat's non-mated model using only AFIS-selected near-matching pairs, the population the tool actually meets; if the underestimation persists the claim strengthens, and if it disappears the quantitative conclusion is limited to the pooled sample.
- A practical reform implied by the paper is to report $\alpha$ and $\beta$ separately, with intervals, rather than only the ratio $\alpha/\beta$; the ratio conceals the absolute risk of erroneous identification, which is the quantity a fact-finder needs.
Signed reviews
Editorial analysis
A structured set of objections, weighed in public.
Referee Report
Summary. This paper is a critical methodological review of FRStat, a statistical tool developed by the U.S. Defense Forensic Science Center (DFSC) to support probabilistic statements in fingerprint examination reports. The author, Cedric Neumann, argues that FRStat is unsafe for casework on four grounds: (1) the DFSC's reporting language misuses probability terminology and does not correspond to the numbers FRStat actually computes; (2) FRStat's ratio of two tail probabilities is not a likelihood ratio, does not converge to one, and can be misleading; (3) the mixture-of-logistic distributions used to model non-mated similarity scores underestimate the frequency of high scores from different donors, thereby underestimating the risk of erroneous identification; and (4) the validation experiments reported by Swofford et al. show error rates worse than subjective fingerprint examination. The paper concludes that using FRStat in casework would 'rapidly lead to miscarriages of justice.' The manuscript includes a re-analysis of Swofford et al.'s published data, simulation results comparing Kolmogorov-Smirnov and Anderson-Darling goodness-of-fit tests, and reproductions/extensions of the original validation tables.
Significance. If its claims are correct, the paper has substantial practical importance: FRStat has already been introduced in at least one military court and offered in a civilian case, so a rigorous demonstration that its statistical outputs are misinterpreted or miscalibrated would be of direct value to courts and forensic practitioners. The conceptual distinctions drawn in Section 2—between tail probabilities, likelihoods, densities, and probability masses—are correct and clearly explained, and the Anderson-Darling simulation in Section 4.3 is a well-constructed illustration of the poor power of the Kolmogorov-Smirnov test for tail departures. The paper also makes a strong, verifiable point that a ratio of tail probabilities does not have the semantics of a likelihood ratio. However, the quantitative strength of the central 'dangerous in casework' claim relies on pooling data from different sampling designs, and the manuscript does not fully establish that the pooled data represent operational casework conditions. The paper is valuable as a cautionary analysis, but some of its strongest quantitative conclusions need additional support.
major comments (2)
- [Section 4.3, Table 1] The comparison that drives the claim that FRStat 'vastly underestimates' the risk of erroneous identification pools non-mated scores from three sampling designs: 2,000 random non-mated pairs (Figure 5), 500 random cross-comparisons (Table 4), and 200 AFIS-selected highly similar non-mated pairs (Tables 5a/5b). Footnote 13 concedes that combining these scores 'may be questionable.' Because 30 of the 35 observed scores above zero come from the 200 AFIS-selected pairs, while the 2,500 random comparisons contribute only 5, the pooled observed tail rate of 1.29% is strongly driven by the extreme AFIS subsample. The model's expected rate of 0.073% was derived from the random-pair training data, so the comparison is not made on a common population. To establish the magnitude of the under-estimation in typical casework, the author should either provide evidence that AFIS-selected top candidates are representative of the casework 'cannot exclude' subset, or report the tail counts separately for each sampling design and show that the under-estimation persists within each design. Without this, the central quantitative claim is overstated.
- [Section 4.4, Tables 2 and 3] The conclusion that FRStat would produce rates of erroneous identification 'far superior' to the roughly 1% subjective error rate of fingerprint examiners is based on error rates estimated from AFIS-selected non-mated pairs. The text asserts that this experiment 'is intended to be similar to the casework situation where an examiner fails to exclude an innocent donor,' but no data or citation is provided to show that AFIS top candidates have the same distribution of similarity scores as the comparisons that actually reach the FRStat stage in casework. If the AFIS-selected pairs are more similar than typical 'cannot exclude' comparisons, the error rates in Tables 2 and 3 are upper bounds rather than expected operational error rates, and the stated contrast with the 1% subjective error rate is misleading. The paper should either supply empirical information about the score distribution of casework comparisons that reach FRStat, or substantially soften the claim that FRStat is 'more inefficient and risky' than the subjective process it supplements.
minor comments (7)
- [Abstract] The abstract refers to 'DFCS' in the phrase 'the language used by the DFCS'; this should be 'DFSC' (Defense Forensic Science Center).
- [Section 4.3, Footnote 13] The caveat about pooling data from different sampling conditions is substantive and central to the interpretation of Table 1; it should be moved from a footnote into the main text so that readers cannot miss the limitation.
- [Table 1] The expected counts in Table 1 are presented as '73 in 100,000' without showing the corresponding tail probabilities of the fitted mixture model; adding these probabilities would make the calculation transparent and checkable.
- [Section 4.2, Figure 4] The caption of Figure 4 labels the axes 'Loge(LRSS)' and 'Loge(FRStat)', while the text refers to 'FRStat-like values'; the caption should clarify that the y-axis is the logarithm of the ratio of tail probabilities, not a likelihood ratio.
- [Section 4.3, simulation] The simulation in Section 4.3 resamples from the same 2,000 scores, so the p-values are dependent across iterations; the text acknowledges this, but it would help to state more explicitly that the departure from uniformity in the upper-left panel cannot be interpreted in the usual way.
- [Table 3, caption] The caption says 'Swofford and al. (2018)'; it should read 'Swofford et al. (2018)'.
- [Section 5, Conclusion] The phrase 'This series of paper is intended to help' is grammatically awkward; it should be 'This series of papers is intended to help.'
Circularity Check
No significant circularity: the paper critiques an external tool using re-analysis of published data and standard probability arguments; self-citations are background, not load-bearing.
full rationale
The paper does not derive its conclusions from its own fitted parameters. Its central claim—that FRStat is unsafe for casework—is a critique of an external tool (Swofford et al. 2018). The quantitative tail-underestimation argument compares Swofford et al.'s stated mixture-of-logistics parameters with the observed frequencies reported in Swofford et al.'s own experiments (Table 1). The model expectations are computed from the external model, not fitted to the paper's conclusion; no prediction is produced from parameters estimated inside this paper. The convergence-to-likelihood-ratio argument rests on an explicit toy simulation (Figure 4) and on the logical distinction between tail probabilities and likelihoods, not on an unverified self-citation. Self-citations to Neumann et al. 2007, Neumann et al. 2019, Ommen et al. 2017/2018, and Ausdemore et al. 2019 are used as background references or as pointers to results reproduced in the paper; they are not load-bearing inputs to the derivation. The pooling caveat in footnote 13 concerns external validity of the observed tail frequencies, not a circular reduction. Overall, the derivation chain is self-contained against the published FRStat data and standard probability theory; at most there are minor, non-load-bearing self-citations, so the paper is not materially circular.
Assumptions & free parameters
assumptions (4)
- domain assumption The similarity score returned by FRStat is a continuous random variable, so the DFSC language should use density or likelihood rather than probability of an exact value.
- ad hoc to paper The combined non-mated score datasets from different experiments (random pairs and AFIS-selected pairs) are representative of casework non-mated scores.
- standard math The Anderson-Darling test is more powerful than the Kolmogorov-Smirnov test for detecting tail misfit.
- domain assumption The toy model in Figure 4 using normal distributions illustrates the general non-convergence of FRStat values to likelihood ratios.
Cite this review
Pith. "Pith review of Defence Against the Modern Arts: the Curse of Statistics -- FRStat." pith.science (2026). https://pith.science/paper/7CEYCW5P
@misc{pith2026190801408,
  author       = {Pith},
  title        = {Pith review of: Defence Against the Modern Arts: the Curse of Statistics -- FRStat},
  year         = {2026},
  howpublished = {\url{https://pith.science/paper/7CEYCW5P}},
  note         = {Machine review of arXiv:1908.01408}
}
read the original abstract
For several decades, legal and scientific scholars have argued that conclusions from forensic examinations should be supported by statistical data and reported within a probabilistic framework. Multiple models have been proposed to quantify the probative value of forensic evidence. Unfortunately, several of these models rely on ad-hoc strategies that are not scientifically sound. The opacity of the technical jargon that is used to present these models and their results and the complexity of the techniques involved make it very difficult for the untrained user to separate the wheat from the chaff. This series of paper is intended to help forensic scientists and lawyers recognise issues in tools proposed to interpret the results of forensic examinations. This paper focuses on the tool proposed by the Latent Print Branch of the U.S. Defense Forensic Science Center (DFSC) and called FRStat. In this paper, I explore the compatibility of the results outputted by FRStat with the language used by the DFCS to report the conclusions of their fingerprint examinations, as well as the appropriateness of the statistical modelling underpinning the tool and the validation of its performance.
Figures


Figures from the paper (1 more)

Reference graph
Works this paper leans on
-
[1]
Introduction The Latent Print Branch of the U.S. Defense Forensic Science Center (DFSC) has recently made significant changes in their operating procedures to account for numerous criticisms directed at the field of fingerprint examination over the past decades. In particular, in 2015, the DFSC issued an information paper where it announced its decision t...
work page 2015
-
[2]
The risk of making an erroneous identification increases when the level of similarity between a trace and a control impression decreases, while the risk of making an erroneous exclusion increases when the level of similarity increases. Overall, FRStat is designed to estimate the risks of erroneous identification and exclusion for a given level of similari...
work page 2017
-
[4]
Contrary to most statistical tests, FRStat estimates a rate of type II error: estimating the type II error enables accepting H0 with a certain level of risk, instead of merely failing to reject it when the risk of type II error is unknown. 3.2 FRStat’s test statistic For a given comparison between a latent and a control impression, FRStat’s test statistic...
arXiv 2018
-
[5]
(2018) only present the rates of correct exclusions for the different values of the decision rule
Tables 4, 5a and 5b in Swofford et al. (2018) only present the rates of correct exclusions for the different values of the decision rule. Table 3 below presents the corresponding rates of erroneous identifications. Feature quantity Number of pairs <1 <10 <100 <1,000 <10,000 <100,000 5 99 0.566 0.788 0.980 1.000 1.000 1.000 6 99 0.687 0.747 0.980 1.000 1.0...
work page 2018
-
[6]
The DFSC language does not use appropriate probabilistic language. In fact, the 2017 DFSC language abuses several notions of probability theory and is technically meaningless. In addition, the DFSC language does not reflect the numbers outputted by FRStat and cannot be used to report them. In this paper, I suggest using following more appropriate language...
work page 2018
-
[7]
When the range of values considered by the probability statement goes from the lowest possible value to some value, or from some value to the largest possible value that a random variable can take, the term tail probability is used; 8. Probability densities can take values larger than 1 while probability masses (and probabilities) cannot; 9. The likelihoo...
work page 2018
Reviewed August 14, 2026 · model on record in the stance chip above.
Discussion (0). Continue with ORCID to comment.