REVIEW 4 major objections 5 minor 6 references
Modeling the impact of dilution on the microbial degradation time of dispersed oil in marine environments
T0 review · 4 major / 5 minor · reviewed 2026-08-14 · deepseek-v4-flash
Pith's one-line read Oil plume dilution delays microbial oil degradation by about a week, a stochastic encounter model shows.
desk verdict Extends MODEM with dilution to show encounter-limited degradation is likely in the ocean, but the 'one-week' delay is hostage to an unexamined initial plume size and fixed diffusivities. read the letter →
The pith
A machine-rendered reading of the paper's core claim, the machinery that carries it, and where it could break.
The reading
What carries the argument
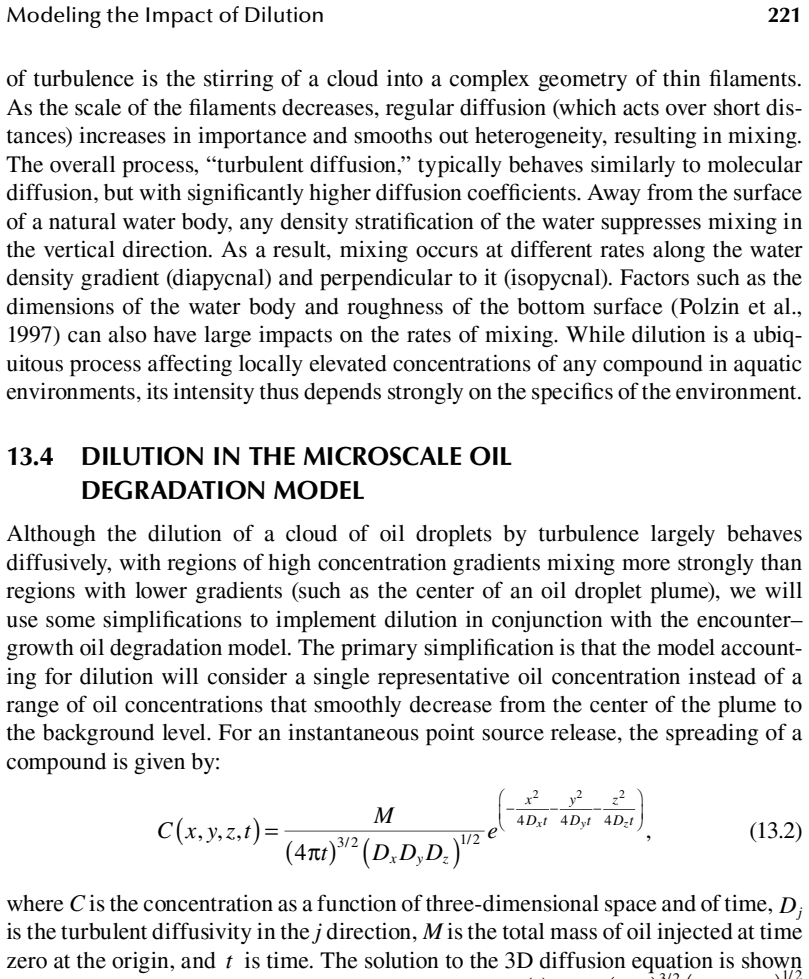
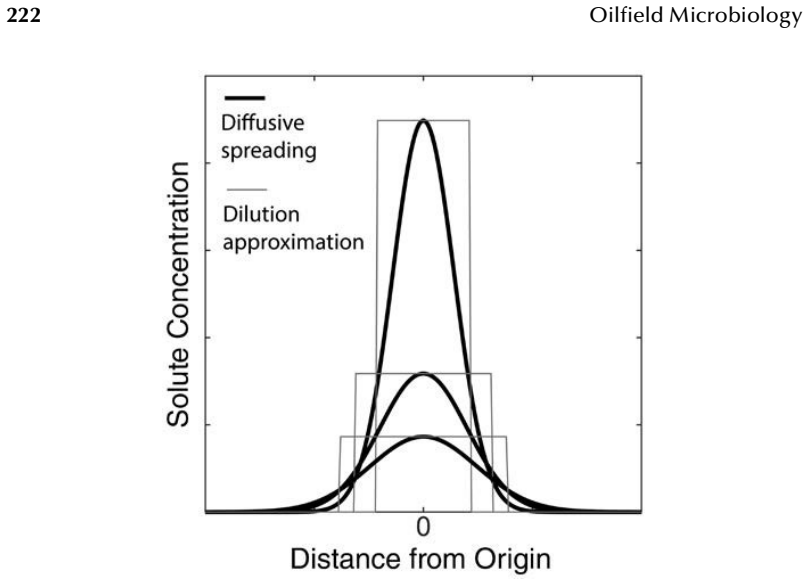
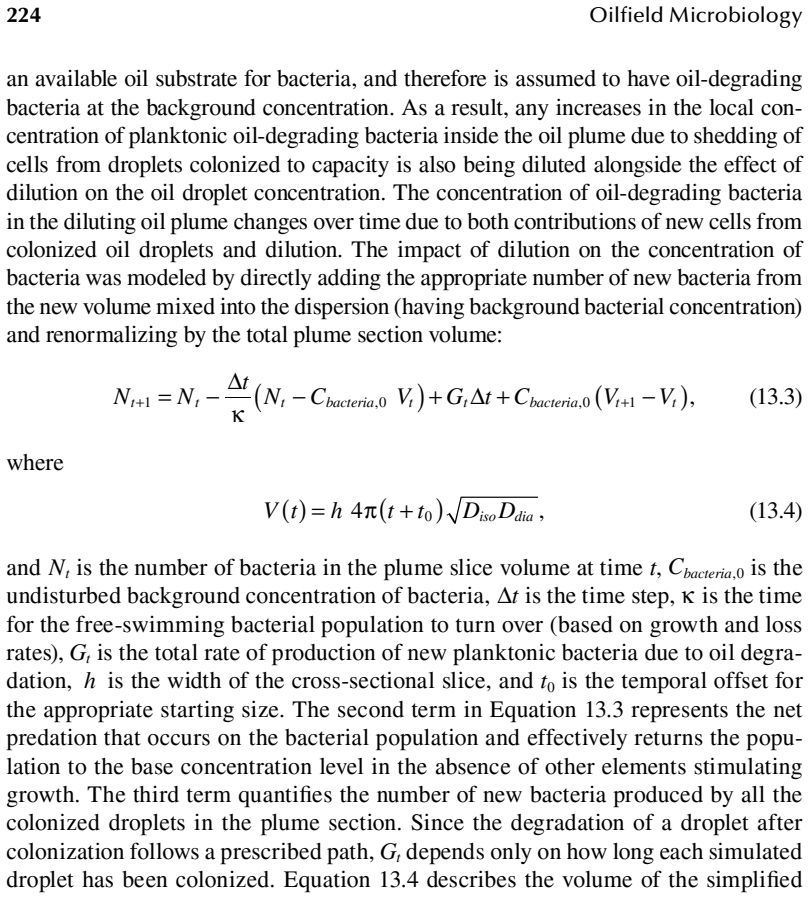
The machinery is an extension of the Microscale Oil Degradation Model (MODEM), which tracks millions of individual oil droplets. Each droplet is colonized by a first bacterium according to a Poisson process with rate $\lambda = 4\pi (r_b + r_d)(D_b + D_d) C_b$, where $C_b$ is the ambient bacterial concentration; after colonization, droplet degradation and bacterial shedding follow a deterministic trajectory capped by surface-area capacity. Dilution is added by replacing the plume with a uniform expanding volume whose vertical cross-section grows as $V(t) = 4\pi h \sqrt{D_{\mathrm{iso}} D_{\mathrm{dia}}}\,(t+t_0)$, with isopycnal diffusivity $D_{\mathrm{iso}} = 0.07$ m$^2$/s and diapycnal diffusivity $D_{\mathrm{dia}} = 10^{-5}$ m$^2$/s. This volume relation couples two dilution effects: it lowers the oil concentration available for encounters, and it returns the bacterial concentration toward background by entraining oil-free water.
What would settle it
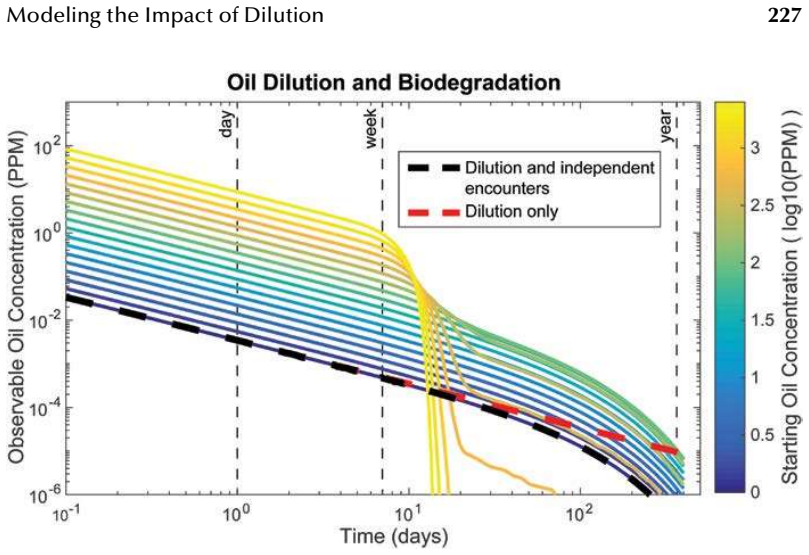
A controlled mesocosm experiment with a dispersed-oil plume, a turbulent diffusivity near the assumed values, and a tracer to separate dilution from biodegradation: the model predicts no enhanced degradation (only slow exponential decay) and a deviation from the dilution-only curve beginning roughly one week after release, whereas the no-dilution picture predicts a rapid cascade with more than 90% oil loss within 20 days at starting concentrations near 10 ppm.
Extended reading notes
Core claim
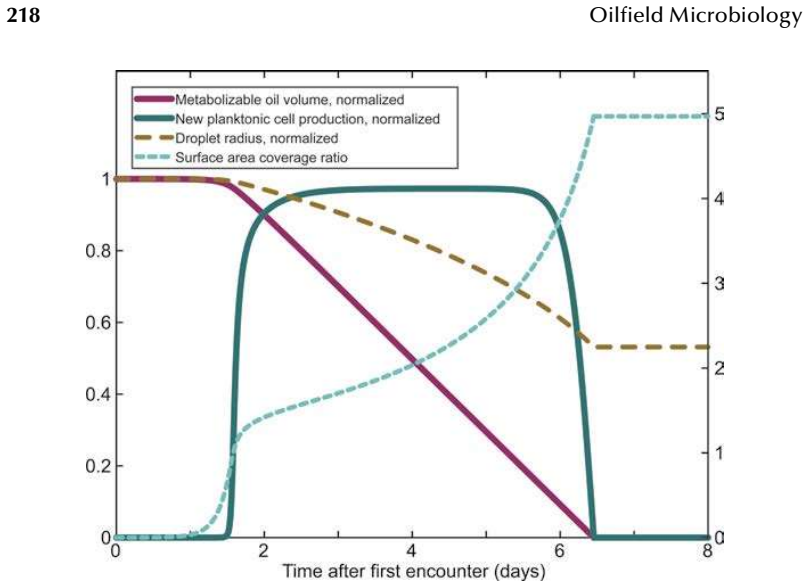
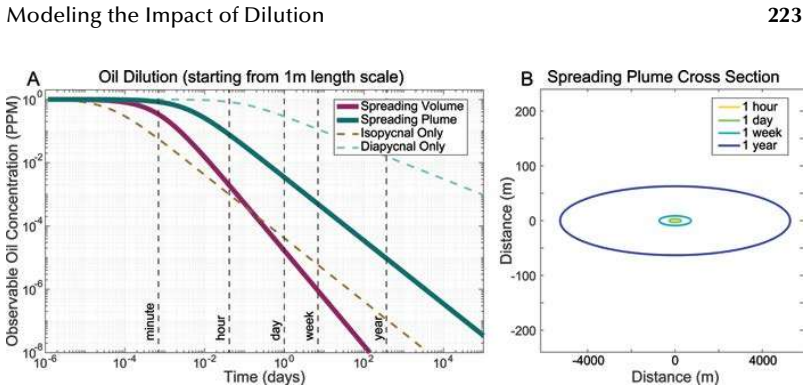
The central claim is that dilution and biodegradation interact through the encounter rate between bacteria and oil droplets, not just through a dilution factor on oil mass. In the model, the initial lag before the first bacterium finds a droplet is long enough that, under the assumed mixing rates, the plume's oil concentration drops by roughly two orders of magnitude within a week. By the time oil-degrading bacteria have grown and begun shedding new cells, the diluted bacterial concentration cannot rise far above background, so the cascade of fast degradation seen in undiluted high-concentration simulations never starts. The result is that the onset of significant biodegradation is delayed by approximately one week and that degradation proceeds at the low-concentration exponential rate even for starting oil concentrations that would trigger rapid degradation without dilution.
Load-bearing premise
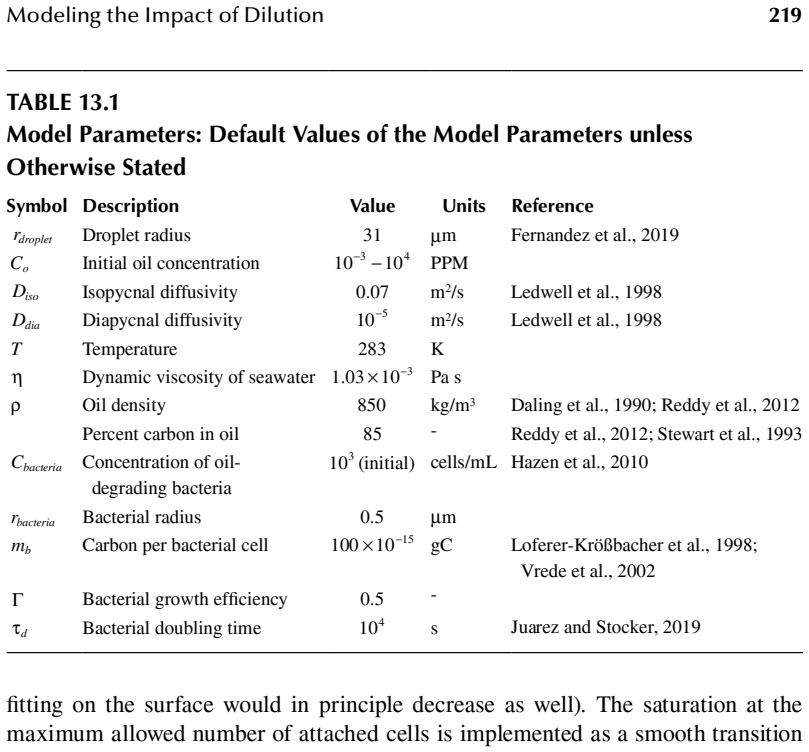
The load-bearing premise is that turbulent mixing of a real plume can be represented by constant diffusivities (0.07 m2/s horizontally and 10-5 m2/s vertically) taken from a single deep-ocean tracer experiment, together with a 1-meter initial plume size; if real mixing is faster or scale-dependent, the one-week delay and the persistence of encounter-limited conditions could shift substantially.
Editorial extensions
If this is right
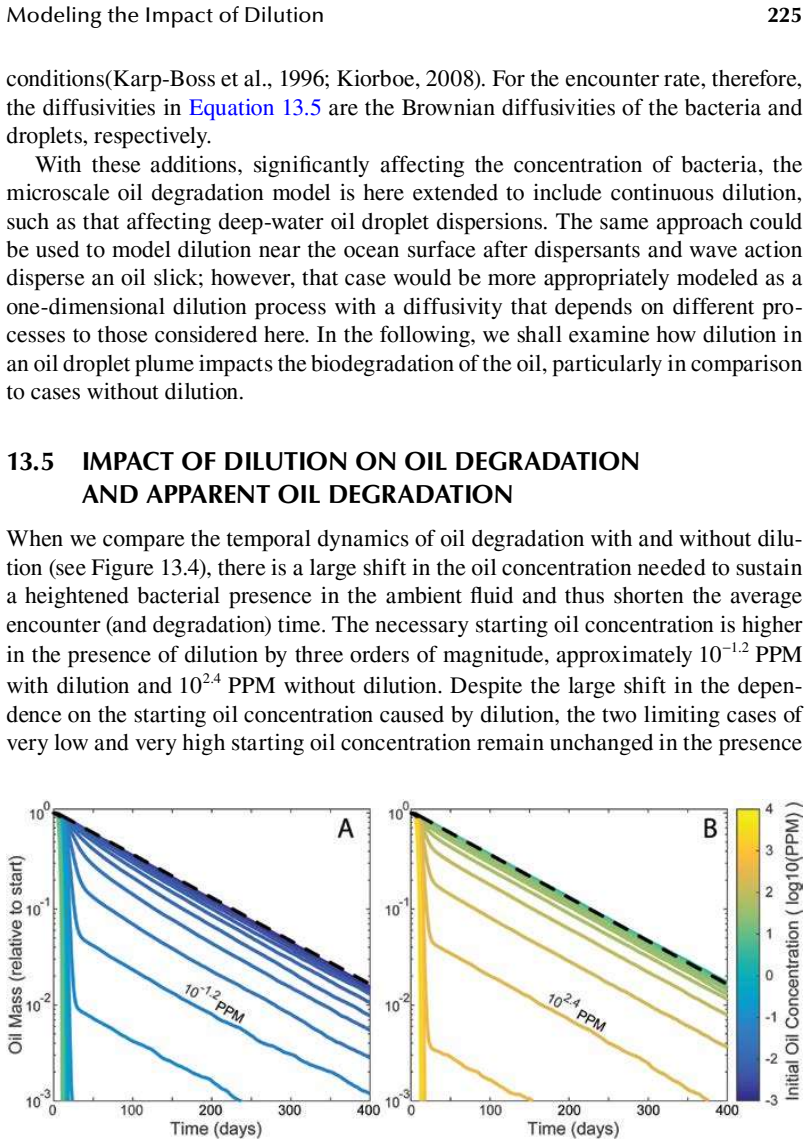
- Starting oil concentrations below roughly $10^{-1.2}$ ppm with dilution degrade at the same slow exponential rate as in the absence of dilution, whereas the threshold for enhanced degradation is raised by about three orders of magnitude.
- The window for effective intervention is the first week after oil enters the water, because afterward the plume concentration has fallen too far for oil-degrading bacteria to meaningfully boost local encounter rates.
- Strategies that act directly on encounters, such as increasing droplet size or seeding oil-degrading bacteria near the source, can accelerate degradation even under strong dilution because they do not rely on ambient bacterial population growth.
- Field measurements of dispersed-oil biodegradation will be difficult even when microbes are actively degrading, because the signal appears late and at oil concentrations below roughly $10^{-2}$ ppm, which are hard to detect accurately.
- Comparison with a deep-sea plume event suggests that observed bacterial enrichments of only two- to three-fold would leave encounter rates nearly unchanged, leaving open the possibility that droplets were diluted to very low concentrations before degradation became significant.
Reading between the lines
- If scale-dependent diffusivity is included, early dilution of a small plume may be even faster than assumed, which would strengthen the encounter-limited conclusion; for larger plumes, mixing can be slower, potentially shortening the delay, so the one-week estimate is a central expectation rather than a bound.
- The same encounter-dilution coupling should apply to other patchy marine resources, such as marine snow aggregates or decomposing particles, where dilution of colonizers may keep remineralization slow; the paper's mechanism is general to any dilute, slowly colonized substrate.
- A testable extension is to replace the single representative concentration with a full concentration field from a hydrodynamic model, which would reveal whether spatial heterogeneity inside the plume creates localized zones where the bacterial cascade can still ignite.
- The model implies that dispersant use that only shrinks droplet size without enhancing encounter rates could inadvertently prolong persistence by pushing droplets into a size range where encounters are rare and dilution dominates.
Signed reviews
Editorial analysis
A structured set of objections, weighed in public.
Referee Report
Summary. This chapter extends the authors' MODEM model to account for the dilution of a dispersed oil plume in the marine environment. The model represents a plume cross-section that spreads diffusively in two dimensions, tracks the concentration of oil-degrading bacteria as it is affected by growth, turnover, dilution, and shed cells from colonized droplets, and uses a Monte Carlo scheme to simulate stochastic encounters between bacteria and oil droplets. The central result is that dilution delays the onset of enhanced biodegradation by approximately one week, because by the time bacterial populations can grow, the oil concentration has already fallen, keeping the plume in an encounter-limited regime where degradation follows a slow exponential decay. The model also predicts that the threshold initial oil concentration needed to trigger accelerated degradation is about three orders of magnitude higher with dilution than without.
Significance. The paper addresses a real gap in oil spill modeling: most models parameterize microbial degradation with first-order half-lives and neglect the encounter-limited nature of bacterial colonization of droplets. The qualitative insight—that dilution suppresses the positive feedback between bacterial growth and droplet colonization, and that field concentrations are likely too low for laboratory-derived degradation rates to apply—is important and mechanistically sound. The model uses standard diffusion and encounter-kernel equations, and the Monte Carlo implementation is described in enough detail to be replicated in principle. However, the strength of the headline quantitative claim (the one-week delay) is not matched by the support provided: the delay is governed by an arbitrarily chosen initial plume size and by fixed diffusivities, with no sensitivity analysis, and one controlling parameter, the bacterial turnover time κ, is never assigned a value. The paper is therefore best viewed as a preliminary modeling study whose qualitative conclusions are likely robust but whose quantitative predictions require further validation.
major comments (4)
- [Section 13.4, Eq. (13.3)] The bacterial turnover time κ appears in the population balance for the bacterial concentration but is never assigned a numerical value or a literature source anywhere in the manuscript. This parameter sets the rate at which the bacterial concentration relaxes to the background level, and it directly controls whether a plume can sustain an enhanced bacterial population, and therefore the timing of the transition to accelerated degradation. Please provide the value used in the simulations, or state explicitly that κ is a free parameter and justify the chosen range.
- [Section 13.4, Eq. (13.4) and Figure 13.3] The temporal offset t0 is chosen so that the initial plume cross-section is a 1 m diameter disk. For the two-dimensional dilution model used here, the dilution-only oil concentration decays as t0/(t+t0), so the time required to dilute to any fixed fraction is proportional to t0 = A0/[4π sqrt(D_iso D_dia)]. Changing the assumed initial cross-section diameter from 1 m to 10 m changes t0 by a factor of 100 and shifts the dilution-limited delay accordingly. The paper provides no sensitivity analysis over the initial plume size, despite this choice being central to the claimed 'approximately one week' delay. Please either justify the 1 m value with field observations or demonstrate that the delay remains within a plausible range for a realistic distribution of initial plume sizes.
- [Section 13.4, 'we will neglect the dependence of the diffusivity on the length scales'] The model uses constant diffusivities D_iso = 0.07 m2/s and D_dia = 1e-5 m2/s from a single North Atlantic tracer release experiment (Ledwell et al., 1998). The authors correctly acknowledge that turbulent diffusivity increases with plume size (Okubo, 1971), yet they do not test how the results depend on the diffusivity values. Since the dilution rate determines the time available for bacterial growth, the one-week delay and the claim that dilution 'outpaces' bacterial production are quantitatively sensitive to these choices. A sensitivity analysis over D_iso and D_dia, or a scale-dependent diffusivity parameterization, is needed to support the quantitative conclusions. The qualitative direction likely holds, but the paper's central number is not yet robust.
- [Table 13.1 and Sections 13.2–13.3] Several key parameter values, including the maximum surface capacity of bacteria on a droplet and the bacterial doubling time, are drawn from companion manuscripts listed as 'Submitted' (Fernandez et al., 2019; Juarez and Stocker, 2019). Because these manuscripts are not publicly available, a reader cannot reproduce the model results or assess the sensitivity of the conclusions to these parameters. Please provide the necessary values, functional forms, or a detailed description directly in the chapter, or indicate that they are available as supplementary material.
minor comments (5)
- [Whole manuscript] The text contains numerous OCR artifacts (e.g., 'G' for 'F', 'ê' for 'fi', garbled superscripts in Table 13.1 and Figure labels). A clean proofread of the typeset version is needed before publication.
- [Section 13.3 and Eq. (13.2)] The derivation of the plume cross-section volume in Eq. (13.4) from the three-dimensional point-source solution in Eq. (13.2) should be made explicit. In particular, state that Eq. (13.4) is the volume of a slice of height h, and that h cancels from the final concentration and encounter-rate expressions.
- [Section 13.5, Figure 13.4] The text states that dilution raises the starting oil concentration needed to accelerate degradation 'by three orders of magnitude.' Please specify the exact criterion used for this threshold (e.g., the concentration at which the time to degrade 90% of the oil drops below some value), since the factor depends on the chosen definition.
- [Section 13.6] The Deepwater Horizon comparison is illustrative, but the paragraph could more explicitly acknowledge that the model's parameter choices (e.g., 62 μm droplet diameter, 1 m initial plume size) are not calibrated to the Deepwater Horizon case, and that the comparison is therefore qualitative.
- [References] The two 'Submitted' references (Fernandez et al., 2019; Juarez and Stocker, 2019) should be updated if they have been accepted or published, and the format of the Joint Analysis Group technical report should be completed.
Circularity Check
No circularity: the one-week dilution delay is an emergent model output, not a re-labeled input or self-justifying parameter.
full rationale
The claimed `approximately a week` delay is not an input or fitted target; it emerges from integrating the encounter kernel (Eq. 13.1), the dilution volume (Eq. 13.4), and the coupled bacterial-abundance update (Eq. 13.3), using diffusivities from Ledwell et al. (1998), bacterial concentrations from Hazen et al. (2010), and growth parameters listed in Table 13.1. No parameter is fitted to the predicted delay, and no observed delay is renamed as a prediction. The initial 1 m plume-cross-section size and the fixed isopycnal/diapycnal diffusivities are assumptions that set the quantitative timescale, and the absence of a sensitivity analysis is a robustness or correctness concern, not a circular reduction. The self-citations to Fernandez et al. (2019) and Juarez and Stocker (2019) supply the prior MODEM framework and unpublished biological parameters; these are load-bearing model components, but they do not assume the conclusion being tested—namely, that dilution suppresses the bacterial cascade and maintains encounter-limited degradation. The paper therefore does not exhibit any step in which an equation or parameter is equivalent by construction to the predicted delay or to the encounter-limited outcome.
Assumptions & free parameters
free parameters (3)
- Plume initial cross-section size (temporal offset t0) =
1 m diameter disk; t0 derived from Eq. 13.4 (~1.5 h)
- Bacterial population turnover time kappa =
not stated
- Maximum attached-bacteria capacity (surface coverage limit) =
somewhat larger than a monolayer (unpublished)
assumptions (6)
- domain assumption The dispersion of oil droplets can be treated as a dissolved solute for dilution purposes.
- domain assumption Turbulent shear does not significantly enhance bacterium-droplet encounter rates; the diffusive encounter kernel with Brownian diffusivities applies.
- domain assumption Entrained water contains bacteria at background concentration and no bioavailable oil substrate.
- domain assumption After a droplet is colonized, subsequent encounters are negligible because surface growth doubles faster than new arrivals.
- domain assumption A monodispersion of 62 um droplets with the same surface-area-to-volume ratio approximates the polydispersion.
- standard math Standard diffusion equation solution and Smoluchowski encounter kernel are valid for the plume and encounter calculations.
Cite this review
Pith. "Pith review of Modeling the impact of dilution on the microbial degradation time of dispersed oil in marine environments." pith.science (2026). https://pith.science/paper/7CGXP2GV
@misc{pith2026190808078,
  author       = {Pith},
  title        = {Pith review of: Modeling the impact of dilution on the microbial degradation time of dispersed oil in marine environments},
  year         = {2026},
  howpublished = {\url{https://pith.science/paper/7CGXP2GV}},
  note         = {Machine review of arXiv:1908.08078}
}
read the original abstract
Dispersants aid the breakup of crude oil masses and increase the available interfacial surface area for bacteria to degrade insoluble hydrocarbons in the marine environment. However, this common view neglects key aspects of the microscale interactions between bacteria and oil droplets, particularly the encounters between these elements that are required for degradation to occur. This chapter discusses a biophysical model for hydrocarbon consumption of suspended oil droplets under conditions of rapid dilution that occur in natural environments. Based on the model, which includes typical biological growth parameters, dilution is found to produce an effective delay in the onset of biodegradation by approximately a week. The steady and rapid reduction in oil concertation, due to dilution, is found to outpace the production of oil-degrading bacteria that result from colonization of degrading oil droplets, maintaining the process in an encounter-limited state. This mechanistic model provides a baseline for better understanding of microscale biodegradation in dilute oil environments and can help inform the design of mitigation strategies in marine systems.
Figures
Figures from the paper (7 more)

Reference graph
Works this paper leans on
-
[1]
215 1 3Modeling the Impact oG Dilution on the Microbial Degradation oG Dispersed Oil in Marine EnvironmentsVicente I. Fernandez, Roman Stocker, and Gabriel JuarezCONTENTS13.1 Introduction ..................................................................................................21513.2 The Microscale Oil Degradation Model—MODEM .......................
work page 1982
-
[1997]
can also have large impacts on the rates oG mixing. While dilution is a ubiq-uitous process aGGecting locally elevated concentrations oG any compound in aquatic environments, its intensity thus depends strongly on the speciêcs oG the environment.13.4 DILUTION IN THE MICROSCALE OIL DEGRADATION MODELAlthough the dilution oG a cloud oG oil droplets by turbul...
work page 2015
-
[1998]
or characterized mixing Grom hydrodynamic measurements (Hibiya et al., 2006; Polzin et al., 1997), as well as numerical modeling results (Simmons et al., 2004).While droplets will spread even in completely still water with a diGGusiv-ity governed by Brownian motion, most suspended oil droplets are suGêciently large (>10 μm) that this contribution to dilut...
work page 2006
-
[2017]
and a grid spacing ranging Grom 10 to 1000 meters (French-McCay, 2004; Reed et al., 1999). At these modeling length scales, microscale structure and heterogeneity, such as droplet size or bacterial trajectories, are replaced with empirical relations obtained Grom êeld measurements or laboratory experiments. Microbial deg-radation, Gor example, is typicall...
work page 2004
-
[2018]
Modeling distribution, Gate, and concentrations oG Deepwater Horizon Oil in subsurGace waters oG the GulG oG Mexico. In Oil Spill Environmental Forensics Case Studies New York: Elsevier Inc., 683–735.Hazen, T.C., et al. (2010). Deep-sea oil plume enriches indigenous oil-degrading bacteria. Science 330, 204–208.Head, I.M., Jones, D.M., Röling, W.F.M. (2006...
work page 2010
-
[2019]
There are two distinct stages considered in the degradation model: encounter and growth
This model Gocuses on the physical encounters between oil-degrading bacteria and oil droplets as a Gunction oG droplet size distribution and oil concentration and predicts the decrease in oil mass as a result oG the biological degradation. There are two distinct stages considered in the degradation model: encounter and growth. For a given oil droplet, the...
work page 2019
Reviewed August 14, 2026 · model on record in the stance chip above.
Discussion (0). Continue with ORCID to comment.