REVIEW 3 major objections 4 minor 21 references
Principal Cross-Border Flow Patterns in the European Electricity Markets
T0 review · 3 major / 4 minor · reviewed 2026-08-14 · deepseek-v4-flash
Pith's one-line read Most of Europe's cross-border electricity swings reduce to a France–Germany seesaw.
desk verdict A genuinely new descriptive result on real European cross-border flows, but the headline France–Germany dipole and variance shares are not yet robust to the paper's own data-curation choices, especially the omission of 20 eastern borders. read the letter →
The pith
A machine-rendered reading of the paper's core claim, the machinery that carries it, and where it could break.
The reading
What carries the argument
Principal Component Analysis (PCA), applied to the covariance matrix of mean-free net import/export vectors and of border flow vectors, is the dimension-reduction tool that does the work. Its normalized eigenvectors are spatial patterns, and its normalized eigenvalues give the share of total variance each pattern explains. Flow tracing is the second mechanism: using partial flow conservation and perfect mixing at nodes, it decomposes each hour's physical flows into country-to-country transfers, which reveals multi-border physical paths beneath the commercial trades.
What would settle it
Run the same principal component analysis on a gap-free hourly data set, or on a differently imputed version, for the same borders and years, and check the eigenvalue shares. If the first import/export component no longer explains about 38% of the variance, or the first four components no longer come close to 75%, then the reported patterns describe the filling procedure rather than the European grid.
Extended reading notes
Core claim
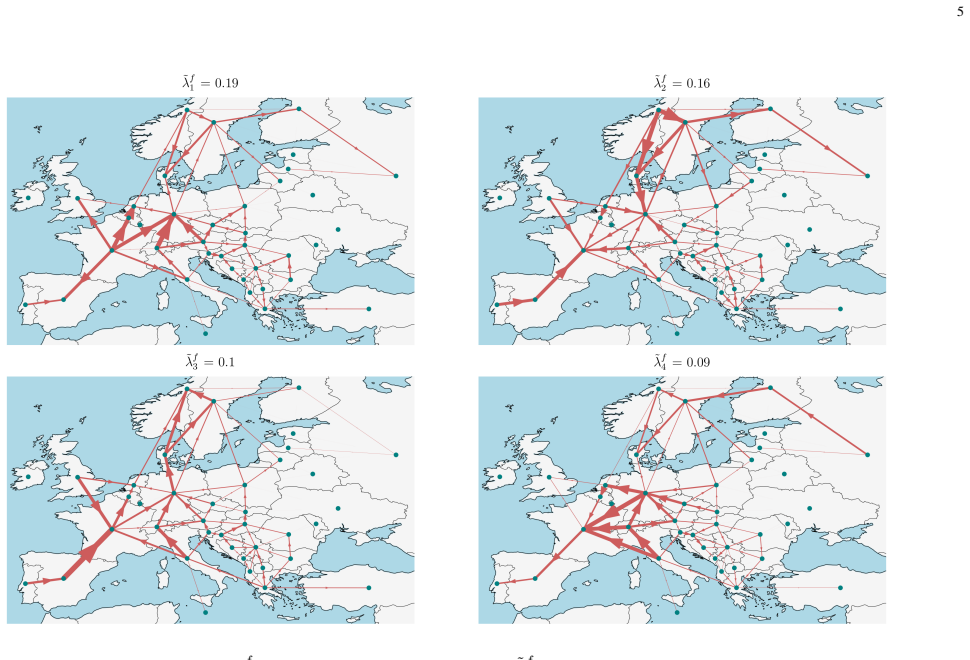
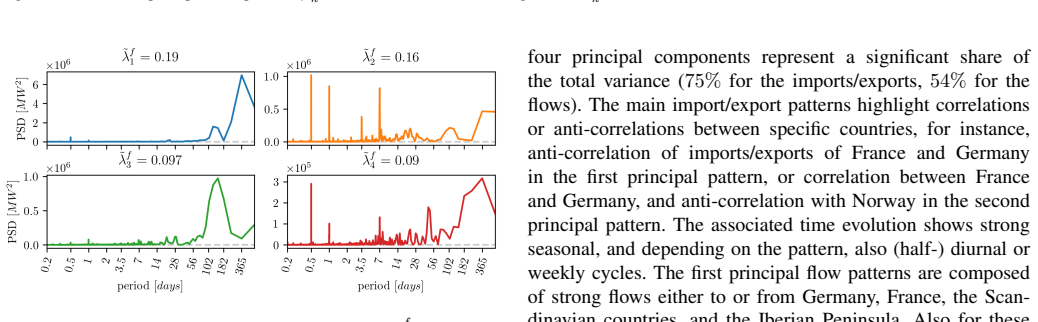
On its own terms, the paper establishes that the cleaned 2017–2018 hourly flow data can be compressed to a few dominant patterns. The first principal import/export component is a dipole: when France's net imports are up, Germany's are down, and conversely; this one axis explains $\tilde\lambda^p_1 = 38\%$ of the variance in national import/export time series. Components two to four add patterns involving Norway, Germany, Italy, and Switzerland, bringing the four-component total to about 75%. The corresponding four principal flow patterns explain 54% of the variance in border flows and combine seasonal, diurnal, half-diurnal, and weekly cycles. Applying flow tracing to the average patterns shows that a large share of physical power travels from exporter to importer across more than one national border, not only between neighbours.
Load-bearing premise
The cleaned two-year data set preserves the true variance structure of the hourly flows: filling gaps with an average week per border and rescaling each month to official totals must not inject artificial periodicities or erase genuine variability.
Editorial extensions
If this is right
- If the central claim is right, the default mental picture of European power exchange should be a France–Germany seesaw: the two largest net exporters move against each other hour by hour, and this single axis dominates the variability.
- A four-pattern description, covering 75% of import/export variance and 54% of flow variance, is sufficient for many modelling and monitoring purposes in the 2017–2018 period, so analyses can work with a handful of modes rather than thirty-three country balances or dozens of borders.
- Physical transfers routinely cross more than two borders, so infrastructure and cost-compensation decisions that look only at adjacent borders will miss a substantial part of the actual power routes.
- The temporal signatures attach to specific patterns: the first import/export mode is seasonal, while the second and third carry diurnal and half-diurnal cycles; flow patterns also show weekly and half-weekly cycles, giving mechanistic explanations a concrete target.
Reading between the lines
- A direct testable extension would regress the first principal amplitude on German and French wind and solar generation; if the France–Germany dipole tracks residual load, the pattern is a market-and-weather effect rather than a grid-structural one.
- If the eigenvalue shares are tracked over later years, sudden shifts in the 38% or 75% figures would signal structural change from market redesign or transmission expansion faster than inspecting individual border flows.
- Consumption-based carbon accounting should, where possible, use traced country-to-country transfers rather than direct trade statistics, because multi-border physical paths are common enough to change the attribution.
- Comparing these physical-flow PCA modes with PCA applied to commercial schedules would separate market behaviour from physical grid constraints; the paper lists this as future work, and a reader can infer it as the natural next test.
Signed reviews
Editorial analysis
A structured set of objections, weighed in public.
Referee Report
Summary. The paper analyzes hourly ENTSO-E cross-border physical flow data for 2017-2018, constructs country-level net import/export time series via the incidence matrix, applies Principal Component Analysis to identify dominant spatial patterns, and applies flow tracing to attribute average transfers. The headline results are that the first import/export component is a France-Germany anti-correlated dipole carrying 38% of the variance, the first four import/export components cover about 75% of the variance, and the first four flow components cover about 54% of the variance. The paper also reports spectral properties of the component amplitudes and average flow-transfer patterns between countries.
Significance. If the results are robust, the paper provides a clear, quantitatively grounded description of the dominant spatiotemporal structures in European cross-border electricity flows, which is relevant not only for electricity-market analysis but also for infrastructure planning and for the emerging literature on flow-based accounting. The methodological core, standard PCA and flow tracing, is sound and transparently described. The paper also makes a useful contribution by applying these tools to a relatively new public dataset and by explicitly acknowledging the limitations of the data curation. However, the central claims rest on the covariance structure of partially reconstructed data, and the absence of robustness checks for the two most consequential curation choices (border exclusion and gap imputation) currently leaves the magnitude and even the existence of the headline dipole open to question.
major comments (3)
- [Section II, Eq. (2), Fig. 4] The PCA of net import/export time series p_n(t) is computed exclusively from the 58 included borders, and Eq. (2) sums only those borders. The 20 omitted borders, which carry about 12% of absolute flows and are concentrated in Eastern Europe (pink links in Fig. 1), are absent from the incidence-sum, so Germany's net position excludes its flows to Poland and the Czech Republic and similar omissions affect other countries. Because the headline result is the France-Germany dipole with a reported 38% variance share, the covariance between France and Germany is computed from an incomplete Germany. The manuscript acknowledges that the resulting aggregated balances do not correspond to official statistics, but it does not test whether the leading PCA patterns survive the omission. I ask for a sensitivity analysis, for example repeating the PCA with border subsets, comparing against official country-level net positions, or otherwise quantifying how the eigenvalue shares and loadings change when the omitted borders are accounted for.
- [Section II, gap imputation and monthly rescaling] The manuscript states that gaps in the filtered data are filled using an average week per border and that the hourly series are then scaled to monthly official totals. Since PCA diagonalizes the covariance matrix of these reconstructed hourly series, both the imputation and the rescaling can modify the variance structure that determines the reported eigenvalue shares and the spectral peaks in Figs. 5 and 7. The paper does not report the total number of imputed hours across all borders, nor does it test sensitivity to the imputation rule (for example, excluding imputed hours or using deterministic interpolation). A quantitative statement of the share of imputed data and a robustness check would make the variance shares credible.
- [Section IV, Figs. 4 and 6] The eigenvalue shares such as 38% and 75% are point estimates from a single two-year data window, and the hourly time series are strongly autocorrelated, so the effective number of independent observations is much smaller than the raw number of hours. Without confidence intervals or a bootstrap analysis, the reader cannot tell whether the observed gap between the first and subsequent eigenvalues is statistically meaningful or whether the reported ordering of patterns is stable. I ask the authors to provide at least a block-bootstrap or similar assessment of the uncertainty of the eigenvalue shares and component loadings.
minor comments (4)
- [Section II, Eq. (1)] The phrase 'For α = 1 this measures counts the number' is grammatically incomplete; it should read 'this counts the number' or 'this metric counts the number'.
- [Section II, paragraph after Eq. (1)] The sentence '36 borders being represented by a complete data sets with Gαl = 0' has a plural agreement error: 'a complete data sets' should be 'complete data sets'.
- [Fig. 1] The color coding of countries according to average net import/export is not accompanied by a legend that is accessible to color-blind readers; please add explicit labels or a grayscale-friendly pattern.
- [Figs. 5 and 7] The power spectral density plots would benefit from labeled units on both axes and a clear statement of how the spectra were normalized; currently the y-axis units are ambiguous.
Circularity Check
No circularity: the PCA and flow-tracing results are computed directly from external ENTSO-E data with no fitted parameters.
full rationale
The paper's central claims, such as the first import/export principal component being a France–Germany dipole with 38% of variance and the first four components covering 75% of import/export variance, are obtained by applying standard PCA to hourly ENTSO-E cross-border flow data. The data are external and independent of the analysis, and the target quantities are not defined in terms of any parameter fitted by the authors. The flow-tracing results likewise follow from a standard matrix inversion of Eq. (6), a well-established method in the literature, including the authors' prior work; those citations are methodological support rather than self-referential justification of the empirical findings. The only author-chosen values are the data-curation thresholds (alpha = 1.5 and G_alpha < 200 in Eq. (1)), which select the borders studied but are not fitted to the reported variance shares or principal patterns. The paper explicitly acknowledges that removing 20 borders means the aggregated nodal injections do not correspond to the official ENTSO-E balances; this is a data-completeness limitation, not a circular step. No equation is derived from its own output, no fitted input is renamed as a prediction, and no load-bearing uniqueness claim is imported from the authors' prior work. The derivation chain is therefore self-contained with respect to the external dataset, and no circularity is present.
Assumptions & free parameters
free parameters (3)
- gap weight exponent alpha =
1.5
- gap measure cutoff =
200
- number of reported principal components =
4
assumptions (3)
- domain assumption The cleaned hourly data set faithfully represents true physical cross-border flows.
- domain assumption Proportional mixing (perfect mixing) in flow tracing.
- standard math PCA on covariance matrices captures the relevant structure.
Cite this review
Pith. "Pith review of Principal Cross-Border Flow Patterns in the European Electricity Markets." pith.science (2026). https://pith.science/paper/7DG5DJPA
@misc{pith2026190802848,
  author       = {Pith},
  title        = {Pith review of: Principal Cross-Border Flow Patterns in the European Electricity Markets},
  year         = {2026},
  howpublished = {\url{https://pith.science/paper/7DG5DJPA}},
  note         = {Machine review of arXiv:1908.02848}
}
read the original abstract
The interconnected European Electricity Markets see considerable cross-border trade between different countries. In conjunction with the structure and technical characteristics of the power grid and its operating rules, the corresponding commercial flows translate into actual physical flows on the interconnection lines. From the interplay of different physical, technical, and economic factors thus emerge complex spatiotemporal power flow patterns. Using Principal Component Analysis, in this contribution hourly time-series of cross-border physical flows between European countries in 2017 and 2018 are analyzed. The most important patterns in the time series of imports/exports and cross-border physical flows are identified. Their spatial and temporal structure, as well as their contribution to the overall variance is described. Additionally, we apply a tracing technique to the overall flow patterns, which allows identifying the physical power transfers between European countries through the common grid infrastructure.
Figures


Figures from the paper (5 more)


Reference graph
Works this paper leans on
-
[1]
European Commission, “Energy Union Package. A Framework Strategy for a Resilient Energy Union with a Forward-Looking Climate Change Policy,” 2015
work page 2015
- [2]
-
[3]
The Flow-Based Market Coupling in Central Western Europe: Concepts and definitions,
K. V . den Bergh, J. Boury, and E. Delarue, “The Flow-Based Market Coupling in Central Western Europe: Concepts and definitions,” The Electricity Journal, vol. 29, no. 1, pp. 24 – 29, 2016
work page 2016
-
[4]
Fourth report on the State of the Energy Union,
European Commission, “Fourth report on the State of the Energy Union,” 2019
work page 2019
- [5]
-
[6]
——, “Transparency Platform,” 2017. [Online]. Available: https: //transparency.entsoe.eu/
work page 2017
-
[7]
The ENTSO-E Trans- parency Platform - A review of Europe’s most ambitious electricity data platform,
L. Hirth, J. M ¨uhlenpfordt, and M. Bulkeley, “The ENTSO-E Trans- parency Platform - A review of Europe’s most ambitious electricity data platform,” Applied Energy, vol. 225, pp. 1054–1067, 2018
work page 2018
-
[8]
Real-time carbon accounting method for the European electricity markets,
B. Tranberg, O. Corradi, B. Lajoie, T. Gibon, I. Staffell, and G. B. Andresen, “Real-time carbon accounting method for the European electricity markets,” Energy Strategy Reviews, vol. 26, p. 100367, 2019
work page 2019
Show all 21 references
-
[9]
Flow tracing as a tool set for the analysis of networked large-scale renewable electricity systems,
J. H ¨orsch, M. Sch ¨afer, S. Becker, S. Schramm, and M. Greiner, “Flow tracing as a tool set for the analysis of networked large-scale renewable electricity systems,” International Journal of Electrical Power & Energy Systems, vol. 96, pp. 390 – 397, 2018
2018
-
[10]
electricityMap,
Tomorrow, “electricityMap,” 2018. [Online]. Available: https://www. electricitymap.org
2018
-
[11]
Amprion Market Report 2019,
Amprion, “Amprion Market Report 2019,” 2019
2019
-
[12]
Principal Mismatch Patterns Across a Simplified Highly Renewable European Electricity Network,
M. Raunbak, T. Zeyer, K. Zhu, and M. Greiner, “Principal Mismatch Patterns Across a Simplified Highly Renewable European Electricity Network,” Energies, vol. 10, no. 12, p. 1934, 2017
1934
-
[13]
Principal flow patterns across renewable electricity net- works,
F. Hofmann, M. Sch ¨afer, T. Brown, J. H ¨orsch, S. Schramm, and M. Greiner, “Principal flow patterns across renewable electricity net- works,” EPL (Europhysics Letters) , vol. 124, p. 18005, 2018
2018
-
[14]
Contributions of individual generators to loads and flows,
D. Kirschen, R. Allan, and G. Strbac, “Contributions of individual generators to loads and flows,” IEEE Transactions on Power Systems , vol. 12, pp. 52–60, 1997
1997
-
[15]
Tracing the flow of electricity,
J. W. Bialek, “Tracing the flow of electricity,” IEE Proceedings - Generation, Transmission and Distribution , vol. 143, no. 4, pp. 313– 320, 1996
1996
-
[16]
Power flow tracing in a simplified highly renewable European electricity networks,
B. Tranberg, A. Thomsen, R. Rodriguez, G. Andresen, M. Sch ¨afer, and M. Greiner, “Power flow tracing in a simplified highly renewable European electricity networks,” New Journal of Physics , vol. 17, p. 105002, 2015
2015
-
[17]
Flow- based analysis of storage usage in a low-carbon european electricity scenario,
B. Tranberg, M. Sch ¨afer, T. Brown, J. H ¨orsch, and M. Greiner, “Flow- based analysis of storage usage in a low-carbon european electricity scenario,” in 2018 15th International Conference on the European Energy Market (EEM) , 2018, pp. 1–5
2018
-
[18]
Power Statistics,
ENTSO-E, “Power Statistics,” 2017. [Online]. Available: https: //www.entsoe.eu/data/power-stats/
2017
-
[19]
Guidelines for Monthly Statistics Data Collection,
——, “Guidelines for Monthly Statistics Data Collection,” 2016
2016
-
[20]
Study on the further issues relating to the inter-TSO compensation mechanism,
CONSENTEC and Frontier Economics, “Study on the further issues relating to the inter-TSO compensation mechanism,” 2006
2006
-
[21]
On a new regulatory framework for the inter-transmission system operator compensation,
ACER, “On a new regulatory framework for the inter-transmission system operator compensation,” 2013
2013
Reviewed August 14, 2026 · model on record in the stance chip above.
Discussion (0). Continue with ORCID to comment.