REVIEW 3 major objections 4 minor 5 references
Mapping Firms' Locations in Technological Space: A Topological Analysis of Patent Statistics
T0 review · 3 major / 4 minor · reviewed 2026-08-14 · deepseek-v4-flash
Pith's one-line read Firms whose patent portfolios branch off into unique trajectories tend to post higher revenue, EBIT, and market value: one extra unit of flare length is associated with about 40%, 39%, and 31% higher performance, respectively, even after…
desk verdict The first economics application of TDA/Mapper is a genuinely useful measurement paper, but the performance regression is over-sold and the unexamined single-linkage clustering choice leaves the central correlation less secure than it looks. read the letter →
The pith
A machine-rendered reading of the paper's core claim, the machinery that carries it, and where it could break.
The reading
What carries the argument
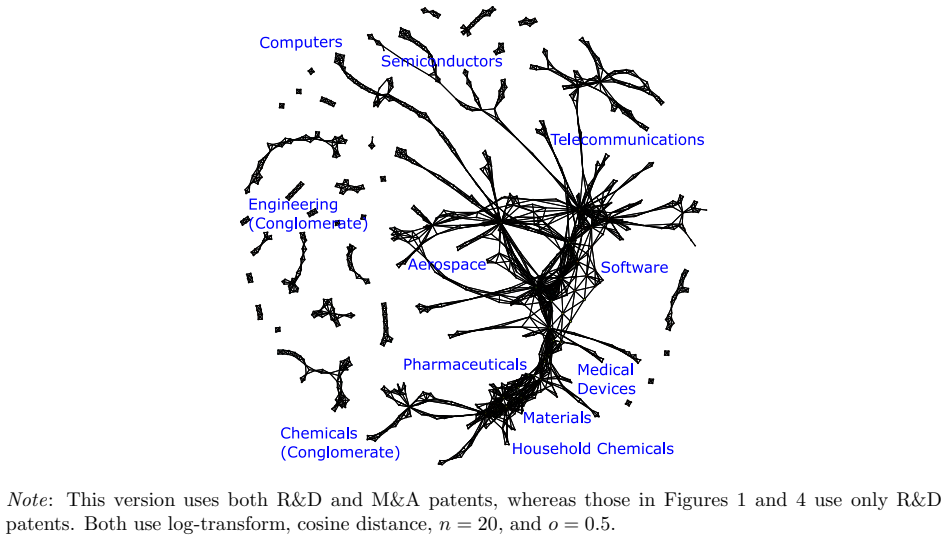
The machinery is the Mapper shape graph together with the graph-theoretic flare measure. Mapper projects the 430-dimensional point cloud of logged patent counts by firm-year onto a two-dimensional PCA filter, covers the image with a 20-by-20 grid of overlapping squares, clusters the points in each square using single linkage with cosine distance, and links clusters that share points. The resulting graph's nodes contain firm-years; for each firm, one takes the subgraph of nodes containing that firm, marks interior nodes whose neighbors all remain in the subgraph, and computes each interior node's exit distance to the outside. A connected component of the interior is a flare if it connects to the rest of the graph (an island if it does not), and the firm's flare length is the largest finite exit distance across its flares. The regressions use this single number as the key regressor.
What would settle it
Run the same construction with a different filter function (say, a single principal axis or a random projection) or a systematically different cover, and re-estimate column 3 of Table 3; if the 0.34 coefficient on flare length loses significance or changes sign under a small parameter perturbation, the flare-performance link is a tuning artifact. Alternatively, permute patent-class labels across firm-years and recompute flare lengths: if the permuted data still yield positive performance correlations, the measure is not capturing genuine technological uniqueness.
Extended reading notes
Core claim
The paper's central claim is that a firm's technological uniqueness, measured graph-theoretically as flare length in a Mapper shape graph, is positively and significantly associated with firm performance. In the authors' own terms, the regressions in Table 3 report that an extra unit of flare length is associated with 40%, 39%, and 31% higher revenue, EBIT, and market value, respectively, after controlling for log patent count. The association is not an artifact of industry composition or survivorship: it persists within sectors and industries and in balanced-panel subsamples, and F-tests reject the joint insignificance of the flare and island indicators for all three performance measures. The paper presents this as a predictive relationship, not a causal one, and interprets it through the industrial-organization idea of product differentiation: firms whose patent portfolios move in directions no one else follows tend to be the firms with stronger market outcomes.
Load-bearing premise
The load-bearing premise is that the shape graph is built with the right choices—the PCA filter, 20-by-20 cover with 50% overlap, single-linkage clustering heuristic, and cosine distance—so that the resulting flare lengths are a faithful signature of uniqueness rather than an artifact of those settings.
Editorial extensions
If this is right
- A one-unit longer flare is associated with roughly 40% higher revenue, 39% higher EBIT, and 31% higher market value in the baseline specification that controls for log patent count.
- The flare and island indicators add statistically significant predictive power beyond patent count: the F-test restricting both coefficients to zero is rejected at the 1% level or better for all three performance measures.
- Positive flare-performance associations persist within sectors and industries and in balanced-panel subsamples, so the result is not solely an industry-composition or survivorship artifact.
- Alternative distance metrics (Euclidean, correlation, and min-complement) yield similar regression coefficients, so the association is not tied to the cosine-distance choice alone.
- Because flare length is relative to the whole graph, a firm's measured uniqueness depends on the trajectories of all other firms in the sample, matching the idea of product differentiation in industrial organization.
Reading between the lines
- The relative nature of flare length suggests a natural extension: use a firm's flare length as an outcome in studies of mergers, entry, or R&D competition, since it shifts when rivals change their patenting.
- The same Mapper-plus-flare pipeline could be exported to other high-dimensional economic objects, such as product characteristics or trade baskets, to quantify uniqueness wherever a point cloud has meaningful continuity.
- A testable extension is a bootstrap or subsample analysis that resamples firms and re-estimates flare lengths, producing confidence intervals for the 0.27–0.34 coefficients and checking how much of the association is driven by the graph's dependence on the full sample.
- One could test the proposed mechanism directly: if long flares proxy for sustained growth and differentiation, flare length should also predict intermediate outcomes like patent citations or R&D productivity years before financial performance is observed.
Signed reviews
Editorial analysis
A structured set of objections, weighed in public.
Referee Report
Summary. The paper introduces a topological data analysis approach, based on the Mapper algorithm, to characterize the evolution of 333 large firms' patent portfolios across 430 USPTO classes during 1976–2005. Each firm-year is a point in a 430-dimensional space; the Mapper graph is built using PCA as a filter, a 20×20 overlapping cover, single-linkage clustering, and cosine distance. The authors then define a graph-theoretic notion of a 'flare'—a connected component of a firm's induced subgraph that is not an island—and a 'flare length' measuring how far the firm's unique trajectory extends from the graph's main body. They document that 40.3% of firms exhibit flares and that flare length is positively associated with revenue, EBIT, and market value in 2005, even after controlling for log patent count. They interpret this as evidence that technological uniqueness predicts firm performance. The paper also compares Mapper with Jaffe's (1989) global clustering, arguing that the graph reveals industry connectedness that discrete clusters obscure.
Significance. If the central empirical claim holds, the paper makes a useful methodological contribution by bringing TDA into empirical economics, providing a principled way to summarize high-dimensional patent data without collapsing it into a fixed cluster partition. The formal graph-theoretic definitions and proofs in Sections 2.4–2.5 and Appendix B are rigorous and clearly presented. The authors are careful to describe the analysis as correlational rather than causal. The comparison with Jaffe's clustering is instructive and shows complementary value. The main question is whether the flare-length measure is robust to the analyst-chosen Mapper parameters, especially the clustering algorithm, since the performance correlations in Table 3 are built on the baseline flare lengths.
major comments (3)
- [Abstract and Section 5, Eq. (5), Table 3] The abstract states that the flare-performance association 'continues to hold after we control for portfolio size, firm survivorship, industry classification, and firm fixed effects.' The regression specification in Eq. (5) and Table 3 contains only log(patents) as a control; no industry classification or firm fixed effects appear in any regression table. The 'within-sector' evidence in Appendix Figures 10 and 11 is scatter plots, not regressions that control for industry, and a firm fixed effect cannot be estimated in this cross-sectional 2005-outcome design. The full-text v5 abstract, by contrast, only claims control for portfolio size and firm survivorship. The overstatement should be corrected, or the additional controls should actually be implemented and reported.
- [Section 2.3 and Appendix Table 6] The sensitivity analysis varies the cover resolution n, overlap o, and distance metric, but never re-estimates the Mapper graph with an alternative clustering algorithm or an alternative filter function. This is a load-bearing gap because single-linkage clustering has a well-known chaining tendency: points connected by thin bridges can be merged into elongated clusters, and in a Mapper cover such chains can produce long graph branches. Since flare length is defined as graph distance from the boundary of the firm's subgraph, chaining artifacts could directly inflate the flare lengths that drive the Table 3 correlations. The paper should either re-estimate flares with e.g., average-linkage or DBSCAN and show that the distribution of flare lengths and the Table 3 coefficients are stable, or explicitly temper the robustness claims.
- [Section 5, Table 3] The regression includes a dummy 1{k_i = ∞} for islands-only firms, but it is not stated how k_i is coded in the regression for those firms. If k_i is set to 0 for islands-only observations, the coefficient on flare length measures only finite flares; if set to some large number, the coefficient is not directly interpretable. The paper should state the coding explicitly and discuss how the islands-only coefficient is identified, especially because it changes sign from positive to negative once log(patents) is added.
minor comments (4)
- [Appendix Table 6] In the 'Correl' columns, the Log(Patents) coefficient is reported as 0.28 with standard error 0.22 in the revenue regression, which is inconsistent with the 0.04 standard errors in the other distance-metric columns and is likely a typographical error.
- [Section 2.3] The text says that n = 15 and 25 and o = 30% produce 'qualitatively similar Mapper graphs,' but no figure or table quantitatively compares flare lengths or downstream regressions under those parameters. A brief quantitative comparison would make this sensitivity claim verifiable.
- [Section 3] The sample selection rule—firms that acquired at least four firms with patents—is noted but its implications are not discussed. The results apply to large, M&A-active firms, and the paper would benefit from an explicit statement that the findings may not generalize to smaller or non-M&A firms.
- [Section 5] The regressions report ordinary standard errors; because the outcome variables are cross-sectional and likely heteroskedastic, robust standard errors should be reported to confirm the significance claims.
Circularity Check
No significant circularity: flare length is computed from patent data alone, and the performance regressions are a standard in-sample association.
full rationale
The paper's central measure, flare length, is defined purely in graph-theoretic terms from the Mapper graph constructed on firms' patent-class vectors (Sections 2.3-2.5, Definitions 5-11). No financial performance variable enters the construction of the Mapper graph or the computation of flare length; the regressions in Section 5 (equation 5 and Table 3) then relate this precomputed graph measure to 2005 revenue, EBIT, and market value while controlling for log patent count. The Mapper tuning choices (n=20, overlap 0.5, cosine distance, single-linkage with the Singh-Memoli-Carlsson heuristic) are explicitly presented as analyst specifications, and the paper varies n, overlap, and distance metric in sensitivity analyses (Appendix Table 6). These choices are not fitted to the outcome variables and are not renamed as predictions. Self-citations in the paper (Ozcan 2015 as data source; Igami and Subrahmanyam 2019 for hard-disk-drive context; Hiraoka et al. 2016 as an illustrative TDA application) are provenance or background references and are not load-bearing for the flare-performance claim. No equation in the paper makes flare length equal to a performance variable by construction, and no fitted parameter is relabeled as a predicted outcome. The closest concern, the analyst-chosen clustering and cover parameters, is a robustness matter rather than circularity, because the parameters are not tuned to the dependent variables and alternative choices yield broadly similar results.
Assumptions & free parameters
free parameters (2)
- Mapper cover resolution n =
20
- Mapper cover overlap o =
0.5
assumptions (4)
- domain assumption Patent class counts are a valid representation of a firm's inventive activities.
- ad hoc to paper The Mapper graph with the chosen filter, cover, and clustering preserves the topological features relevant to technological uniqueness.
- domain assumption Cosine distance is an appropriate dissimilarity measure for patent portfolios.
- domain assumption The 5-year moving window and log(+1) transform provide a meaningful smoothing of annual patent counts.
Cite this review
Pith. "Pith review of Mapping Firms' Locations in Technological Space: A Topological Analysis of Patent Statistics." pith.science (2026). https://pith.science/paper/7HOWN3W5
@misc{pith2026190900257,
  author       = {Pith},
  title        = {Pith review of: Mapping Firms' Locations in Technological Space: A Topological Analysis of Patent Statistics},
  year         = {2026},
  howpublished = {\url{https://pith.science/paper/7HOWN3W5}},
  note         = {Machine review of arXiv:1909.00257}
}
read the original abstract
Where do firms innovate? Mapping their locations and directions in technological space is challenging due to its high dimensionality. We propose a new method to characterize firms' inventive activities via topological data analysis (TDA) that represents high-dimensional data in a shape graph. Applying this method to 333 major firms' patents in 1976--2005 reveals substantial heterogeneity: some firms remain undifferentiated; others develop unique portfolios. Firms with unique trajectories, which we define and measure graph-theoretically as "flares" in the Mapper graph, perform better. This association is statistically and economically significant, and continues to hold after we control for portfolio size, firm survivorship, industry classification, and firm fixed effects. By contrast, existing techniques -- such as principal component analysis (PCA) and Jaffe's (1989) clustering method -- struggle to track these firm-level dynamics.
Figures


Figures from the paper (7 more)




Reference graph
Works this paper leans on
-
[1]
Arora, Ashish, Sharon Belenzon, and Lia Sheer (2019). “Matching patents to Compustat firms, 1980-2015: Dynamic reassignment, name changes, and own ership structures”. Athey, Susan and Guido W Imbens (2017). “The state of applied eco nometrics: Causality and policy evaluation”. In: Journal of Economic Perspectives 31(2), pp. 3–32. Azoulay, Pierre, Christian...
arXiv 2019
-
[2]
Topological persis- tence and simplification
Elsevier, pp. 129–213. Edelsbrunner, Herbert and John Harer (2010). Computational topology: an introduction . American Mathematical Society. Edelsbrunner, Herbert, David Letscher, and Afra Zomorodian (2 000). “Topological persis- tence and simplification”. In: Proceedings 41st Annual Symposium on Foundations of Computer Science. IEEE, pp. 454–463. Epstein,...
work page 2010
-
[4]
Elsevier, pp. 1083–1127. Nelson, Richard (1962). “Introduction”. In: The Rate and Direction of Inventive Activity: Economic and Social Factors . Ed. by Committee on Economic Growth of the Social Sci- ence Research Council Universities-National Bureau Committee fo r Economic Research. Princeton University Press: Princeton, NJ. Nicolau, Monica, Arnold J Lev...
work page 1962
-
[551]
Towards a new approach to reveal dynamical organization of the brain using topological data analysis
Saggar, Manish et al. (2018). “Towards a new approach to reveal dynamical organization of the brain using topological data analysis”. In: Nature communications 9(1), pp. 1–14. Sampat, Bhaven and Heidi L Williams (2019). “How do patents affect f ollow-on innovation? Evidence from the human genome”. In: American Economic Review 109(1), pp. 203–36. Singh, Gur...
work page 2018
-
[1236]
Majumdar, Sourav and Arnab Kumar Laha (2020). “Clustering and classification of time series using topological data analysis with applications to finance”. I n: Expert Systems with Applications, p. 113868. Moser, Petra and Shmuel San (2020). Immigration, Science, and Invention. Evidence from the Quota Acts . Tech. rep. Myers, Kyle (2020). “The Elasticity of ...
work page 2020
Reviewed August 14, 2026 · model on record in the stance chip above.
Discussion (0). Continue with ORCID to comment.