REVIEW 2 major objections 5 minor 41 references
Speculative Execution for Guided Visual Analytics
T0 review · 2 major / 5 minor · reviewed 2026-08-14 · deepseek-v4-flash
Pith's one-line read Speculative Execution for Visual Analytics proposes that analytics systems should proactively precompute alternative model states in isolated sandboxes, leaving the user's current model untouched until a proposal is explicitly accepted.
desk verdict Useful concept paper that formalizes speculative execution for visual analytics, but its confirmation-bias and effectiveness claims outrun the evidence; the adaptive-ranking and auto-completion loop may even amplify bias. read the letter →
The pith
A machine-rendered reading of the paper's core claim, the machinery that carries it, and where it could break.
The reading
What carries the argument
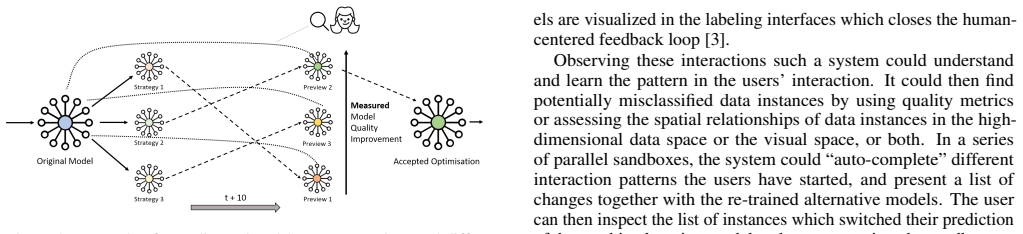
The load-bearing mechanism is the sandbox: an isolated computation environment initialized with a copy of the current model, so any speculative computation always yields a valid model state that can replace the current one if accepted. The paper pairs sandboxes with a Speculative Execution Component that monitors user interactions and a Model Quality Monitor that triggers alternatives from metric declines; delta-visualizations then make the difference between current and proposed states explicit. Speculation dimensions—temporal, optimization strategies, model parameters, input transformations, algorithm modifications—define which aspects of the model a sandbox may alter, and interaction triggers are organized by semantic complexity levels from finishing an in-progress interaction to recognizing repeated interaction patterns.
What would settle it
In a controlled study with a SpecEx-enabled labeling interface, show users a fixed set of speculative label-reassignment sandboxes and record accept and reject choices; the central claim is falsified if accepted sandboxes match user intent no better than randomly generated ones. A second test: if users presented with a metric-optimal sandbox that conflicts with their semantic judgment accept it as often as they reject it, the claimed guidance benefit is not operating.
Extended reading notes
Core claim
The paper's central claim is that Speculative Execution (SpecEx) belongs in Visual Analytics as a first-class interaction concept. SpecEx is defined as the proactive, near-real-time computation of competing model alternatives that do not influence the current model state; alternatives are computed in sandboxes triggered by either user interactions or model quality measures, and are presented through delta-visualizations so a user can accept or reject each proposal. The authors report that they have implemented and successfully tested this workflow for optimizing an incremental hierarchical topic model, where users chose between speculative optimization strategies and overrode metric-ranked suggestions based on semantic judgment. The other four scenarios—implicit steering of labeling, user guidance against confirmation bias, cooperative analysis, and visualization-only precomputation—are presented as hypothetical but concrete demonstrations of the same pattern's range.
Load-bearing premise
The interaction-triggered half of Speculative Execution depends on the system correctly guessing what the user intends from low-level interactions; if that mapping cannot be made reliable, the system cannot know which speculative alternatives to compute, and the claimed reduction of the user-model gap loses its trigger mechanism.
Editorial extensions
If this is right
- Users can experiment with model changes without fear of breaking the current model, because acceptance is explicit.
- Incremental models can forecast several optimization paths ahead of time, letting users steer with semantic judgment rather than only metric values.
- Repetitive interaction patterns, such as labeling, could be auto-completed in parallel sandboxes, cutting explicit interaction overhead.
- Alternative feature weights or parameters proposed by the system can expose mismatches between the model and the user's mental model, creating a check on confirmation bias.
- Because sandboxes are modular, existing Visual Analytics systems can be retrofitted rather than redesigned.
Reading between the lines
- The authors do not claim this explicitly, but SpecEx is effectively a user-facing counterpart to CPU branch prediction: the same speculative-computation principle is applied to human-in-the-loop decision making, and its payoff depends on idle resources being cheap relative to the cost of waiting for user decisions.
- A testable extension: in an interactive labeling system, measure whether SpecEx-proposed label reassignments are accepted at a rate exceeding chance; acceptance rates would directly gauge the reliability of user-intention guessing.
- SpecEx could be combined with progressive computation to compute low-fidelity sandboxes first and refine only the ones users examine, making the near-real-time requirement more feasible on large data.
- If acceptance and rejection feedback is used to re-rank future sandboxes, the system learns a personalized notion of model quality that pure metrics cannot capture, but the paper leaves the ranking mechanism unspecified.
Signed reviews
Editorial analysis
A structured set of objections, weighed in public.
Referee Report
Summary. The paper introduces Speculative Execution (SpecEx) for Visual Analytics: a concept in which a system proactively computes alternative, competing model configurations in isolated "sandboxes," triggered either by user interactions or by model-quality metrics, and presents them via delta-visualizations. The authors define the key terms, propose a modular implementation architecture, describe five usage scenarios (only one of which, topic-model optimization, has been implemented, in prior work [11]), and discuss speculation dimensions, design principles, and open research questions. The paper argues that SpecEx can shorten the gap between users and models, reduce confirmation bias, and speed up model optimization.
Significance. If adopted, the SpecEx concept gives VA systems a principled way to offer safe, sandboxed model alternatives that the user can accept or reject, and its implementation architecture is modular enough to be retrofitted to existing systems. The catalog of speculation dimensions (Section 5.2) and the explicit list of open questions (Section 5.4) are useful contributions, and the paper is honest about the fact that four of the five scenarios are hypothetical. However, the claimed benefits are largely asserted rather than demonstrated, and the confirmation-bias claim is in tension with the adaptive ranking and interaction auto-completion mechanisms described in the paper.
major comments (2)
- [Sections 3.1, 3.2, 4.2, 5.4] The abstract and Section 4.3 present reduced confirmation bias as a benefit of SpecEx, but the described mechanisms of ranking accepted sandbox schemas higher over time (Section 3.1) and learning from user acceptances can reinforce, rather than reduce, confirmation bias. Section 3.2 acknowledges that the adaptation 'has to be carefully considered to avoid creating and confirming biases,' yet no concrete safeguard is given. In Scenario 4.2 (Implicit Steering), the auto-completion of a labeling pattern applies the user's initial labels to additional instances, which actively propagates a possibly biased model. Since Section 5.4 defers the study of how presentation styles impact biases to future work, the claimed bias-reduction benefit is not supported by the mechanisms described; please either add a concrete debiasing mechanism (for example, forcing diversity among proposed sandboxes) or explicitly qualify the claim as an open hypothesis.
- [Sections 5.1 and 5.4] The interaction-triggered branch of SpecEx, which is essential for the claimed ability to 'shorten the gap between users and models' and for Scenarios 4.2 and 4.3, depends on reliable User Intention Guessing. Section 5.4 explicitly states that mapping interactions to concrete goals is 'an open field of research,' and Section 5.1 describes the levels of semantic complexity without providing a concrete mechanism beyond extrapolation and pattern repetition. Since the only implemented system reported in Section 4.1 is metric-triggered, the paper should clearly separate the validated metric-triggered case from the hypothetical interaction-triggered case in the abstract and introduction, rather than presenting the benefits of interaction-driven SpecEx as established.
minor comments (5)
- [Section 4, introductory paragraph] The sentence 'The individual components that that are "active" in each of the scenarios' contains a duplicated 'that'; please remove the second occurrence.
- [Section 4.4] The phrase 'non-information-seeking (NISQ), i.e., rhetorical' is imprecise, because rhetorical questions are one subtype of non-information-seeking questions rather than a synonymous category; please adjust the wording.
- [Reference [11]] The citation reads 'to appear, IEEE Trans. on Visualization and Computer Graphics, 2018,' but the current manuscript is dated 2019; please update to the final publication details.
- [Section 5.3, Search Space Size] The sentence 'This example shows that the Speculative Execution reduces the factorial search space to a linear one' overgeneralizes: the comparison between 196 sandboxes and the full tree space is specific to the chosen numbers k=280, b=10, and n=7, and the number of sandboxes is linear in k/b and n but not generally linear in the number or arity of all speculation dimensions.
- [Section 5.3, Runtime] The phrase 'the aim should be on focused and short computations of less than 500ms' is awkward; consider rephrasing to 'the design should aim for focused computations of less than 500ms.'
Circularity Check
No circularity found: the paper is a conceptual/design-space proposal with no fitted inputs, no derived predictions, and no load-bearing self-citation chain.
full rationale
The paper introduces the concept of Speculative Execution for Visual Analytics through a definition, an implementation architecture, and five usage scenarios. It contains no equations, no fitted parameters, and no quantitative derivation that could reduce to its own inputs. The central claims about reducing confirmation bias, shortening the human-model gap, and speeding optimization are presented as conceptual opportunities, and the paper explicitly flags the open problems: Section 5.4 states that mapping interactions to concrete sandbox goals "is an open field of research," and Section 3.2 warns that adaptation "has to be carefully considered to avoid creating and confirming biases." The only empirical anchor is the self-cited implementation in Section 4.1 [11], but that is used as an illustrative application of the concept, not as the source from which the concept is derived. No passage exhibits a specific reduction of a prediction to its input, nor a self-citation that substitutes for a missing proof or derivation. Thus the paper is self-contained as a conceptual contribution, and the presence of self-citation is not load-bearing.
Assumptions & free parameters
assumptions (3)
- domain assumption User interactions can be interpreted as expressions of intent.
- domain assumption Model quality metrics can be combined into a trigger-decision that anticipates when users want alternative models.
- domain assumption Delta-visualizations enable users to compare model states accurately enough to accept or reject sandboxes.
invented entities (2)
-
Computational sandbox (VA context)
-
Model Delta Visualization
Cite this review
Pith. "Pith review of Speculative Execution for Guided Visual Analytics." pith.science (2026). https://pith.science/paper/7IXB6IVE
@misc{pith2026190802627,
  author       = {Pith},
  title        = {Pith review of: Speculative Execution for Guided Visual Analytics},
  year         = {2026},
  howpublished = {\url{https://pith.science/paper/7IXB6IVE}},
  note         = {Machine review of arXiv:1908.02627}
}
read the original abstract
We propose the concept of Speculative Execution for Visual Analytics and discuss its effectiveness for model exploration and optimization. Speculative Execution enables the automatic generation of alternative, competing model configurations that do not alter the current model state unless explicitly confirmed by the user. These alternatives are computed based on either user interactions or model quality measures and can be explored using delta-visualizations. By automatically proposing modeling alternatives, systems employing Speculative Execution can shorten the gap between users and models, reduce the confirmation bias and speed up optimization processes. In this paper, we have assembled five application scenarios showcasing the potential of Speculative Execution, as well as a potential for further research.
Figures


Reference graph
Works this paper leans on
-
[11]
M. El-Assady, F. Sperrle, O. Deussen, D. Keim, and C. Collins. Vi- sual Analytics for Topic Model Optimization based on User-Steerable Speculative Execution. to appear, IEEE Trans. on Visualization and Computer Graphics, 2018
work page 2018
-
[1]
D. Arnott. Cognitive biases and decision support systems development: a design science approach. Information Systems Journal, 16(1):55–78, 2006
work page 2006
-
[2]
J. Bernard, M. Hutter, M. Zeppelzauer, D. Fellner, and M. Sedlmair. Comparing visual-interactive labeling with active learning: An experi- mental study. IEEE Trans. on Visualization and Computer Graphics, 24(1):298–308, Jan 2018. doi: 10.1109/TVCG.2017.2744818
arXiv 2018
-
[3]
J. Bernard, M. Zeppelzauer, M. Sedlmair, and W. Aigner. VIAL: a unified process for visual interactive labeling. The Visual Computer, pp. 1–19, Mar 2018
work page 2018
-
[4]
D. M. Blei, A. Y . Ng, and M. I. Jordan. Latent Dirichlet Allocation. Journal of Machine Learning Research, pp. 993–1022, 2003
work page 2003
-
[5]
E. T. Brown, A. Ottley, H. Zhao, Q. Lin, R. Souvenir, A. Endert, and R. Chang. Finding waldo: Learning about users from their interactions. IEEE Trans. on Visualization and Computer Graphics, 20(12):1663– 1672, Dec 2014. doi: 10.1109/TVCG.2014.2346575
arXiv 2014
-
[6]
S. P. Callahan, J. Freire, E. Santos, C. E. Scheidegger, C. T. Silva, and H. T. V o. Vistrails: visualization meets data management. InProc. ACM SIGMOD Int. Conf. on Management of Data, pp. 745–747. ACM, 2006
work page 2006
- [7]
Show all 41 references
-
[8]
W. Dou, D. H. Jeong, F. Stukes, W. Ribarsky, H. R. Lipford, and R. Chang. Recovering reasoning processes from user interactions. IEEE Computer Graphics and Applications, 29(3):52–61, May 2009
2009
-
[9]
El-Assady, R
M. El-Assady, R. Sevastjanova, D. Keim, and C. Collins. Thread- Reconstructor: Modeling Reply-Chains to Untangle Conversational Text through Visual Analytics. Computer Graphics Forum, 37(3):351– 365, 2018. doi: 10.1111/cgf.13425
2018 doi
-
[10]
El-Assady, R
M. El-Assady, R. Sevastjanova, F. Sperrle, D. A. Keim, and C. Collins. Progressive Learning of Topic Modeling Parameters: A Visual Analyt- ics Framework. IEEE Trans. on Visualization and Computer Graphics, 24(1):382–391, Jan. 2018. doi: 10.1109/TVCG.2017.2745080
2018
-
[12]
Endert, R
A. Endert, R. Chang, C. North, and M. Zhou. Semantic interaction: Coupling cognition and computation through usable interactive ana- lytics. IEEE Computer Graphics and Applications, 35(4):94–99, July
-
[13]
Endert, P
A. Endert, P. Fiaux, and C. North. Semantic interaction for visual text analytics. In Proc. of the SIGCHI Conf. on Human Factors in Computing Systems, pp. 473–482. ACM, 2012. doi: 10.1145/2207676. 2207741
2012 doi
-
[14]
Endert, M
A. Endert, M. S. Hossain, N. Ramakrishnan, C. North, P. Fiaux, and C. Andrews. The human is the loop: new directions for visual analytics. Journal of intelligent information systems, 43(3):411–435, 2014
2014
-
[15]
Gleicher, D
M. Gleicher, D. Albers, R. Walker, I. Jusufi, C. D. Hansen, and J. C. Roberts. Visual comparison for information visualization. Information Visualization, 10(4):289–309, 2011
2011
-
[16]
Gonz´alez and A
J. Gonz´alez and A. Gonz´alez. Speculative execution via address pre- diction and data prefetching. In Proc. Int. Conf. on Supercomputing, pp. 196–203. ACM, 1997
1997
-
[17]
R. J. Heuer. Psychology of intelligence analysis. 1999
1999
-
[18]
Ingram and M
L. Ingram and M. Walfish. Treehouse: Javascript sandboxes to help web developers help themselves. In USENIX Annual Technical Conference, pp. 153–164, 2012
2012
-
[19]
Jentner, M
W. Jentner, M. El-Assady, D. Sacha, D. J¨ackle, and F. Stoffel. Dyna- mite: Dynamic Monitoring Interface for Task Ensembles. In IEEE Conf. on Visual Analytics Science and Technology (VAST Challenge MC1), 2016
2016
-
[20]
D. Keim, G. Andrienko, J. D. Fekete, C. G ¨org, J. Kohlhammer, and G. Melanc ¸on. Visual analytics: Definition, process, and challenges. In Lecture Notes in Computer Science, pp. 154–175, 2008
2008
-
[21]
T. Y . Lee, A. Smith, K. Seppi, N. Elmqvist, J. Boyd-Graber, and L. Find- later. The human touch: How non-expert users perceive, interpret, and fix topic models. Int. J. of Human-Computer Studies , 105:28–42, 9
-
[22]
S. Liu, X. Wang, M. Liu, and J. Zhu. Towards better analysis of ma- chine learning models: A visual analytics perspective. Visual Informat- ics, 1(1):48–56, 3 2017. doi: 10.1016/J.VISINF.2017.01.006
2017 doi
-
[23]
P. H. Nguyen, K. Xu, A. Bardill, B. Salman, K. Herd, and B. W. Wong. Sensemap: Supporting browser-based online sensemaking through analytic provenance. In IEEE Conf. on Visual Analytics Science and Technology, pp. 91–100. IEEE, 2016
2016
-
[24]
Ritter, C
C. Ritter, C. Altenhofen, M. Zeppelzauer, A. Kuijper, T. Schreck, and J. Bernard. Personalized Visual-Interactive Music Classification. In EuroVis Workshop on Visual Analytics, 2018. doi: 10.2312/eurova. 20181109
2018 doi
-
[25]
Ruppert, J
T. Ruppert, J. Bernard, and J. Kohlhammer. Bridging knowledge gaps in policy analysis with information visualization. InConf. on Electronic Government, vol. 221 of LNI, pp. 92–103, 2013
2013
-
[26]
Sacha, M
D. Sacha, M. Sedlmair, L. Zhang, J. A. Lee, J. Peltonen, D. Weiskopf, S. C. North, and D. A. Keim. What you see is what you can change: Human-centered machine learning by interactive visualization. Neu- rocomputing, 268:164 – 175, 2017. Advances in artificial neural net- works,...
2017
-
[27]
Sacha, L
D. Sacha, L. Zhang, M. Sedlmair, J. A. Lee, J. Peltonen, D. Weiskopf, S. C. North, and D. A. Keim. Visual interaction with dimensionality re- duction: A structured literature analysis. IEEE Trans. on Visualization and Computer Graphics, 23(1):241–250, 2017
2017
-
[28]
Sedlmair, C
M. Sedlmair, C. Heinzl, S. Bruckner, H. Piringer, and T. M¨oller. Visual parameter space analysis: A conceptual framework. IEEE Trans. on Visualization and Computer Graphics, 20(12):2161–2170, 2014
2014
-
[29]
Seifert and M
C. Seifert and M. Granitzer. User-based active learning. In IEEE Int. Conf. on Data Mining Workshop, pp. 418–425, 2010. doi: 10.1109/ ICDMW.2010.181
2010
-
[30]
B. Settles. Active learning. Synthesis Lectures on Artificial Intelligence and Machine Learning, 6(1):1–114, 2012
2012
-
[31]
Sevastjanova, M
R. Sevastjanova, M. El-Assady, A. Hautli-Janisz, A.-L. Kalouli, R. Kehlbeck, O. Deussen, D. Keim, and M. Butt. Mixed-initiative ac- tive learning for generating linguistic insights in question classification. In Workshop on Data Systems for Interactive Analysis (DSIA) at IEEE VIS, 2018
2018
-
[32]
Stitz, S
H. Stitz, S. Luger, M. Streit, and N. Gehlenborg. Avocado: visualiza- tion of workflow–derived data provenance for reproducible biomedical research. In Computer Graphics Forum, vol. 35, pp. 481–490. Wiley Online Library, 2016
2016
-
[33]
van den Elzen and J
S. van den Elzen and J. J. van Wijk. Small multiples, large singles: A new approach for visual data exploration. In Computer Graphics Forum, vol. 32, pp. 191–200. Wiley Online Library, 2013
2013
-
[34]
E. Wall, L. M. Blaha, L. Franklin, and A. Endert. Warning, bias may occur: A proposed approach to detecting cognitive bias in interactive visual analytics. In IEEE Conf. on Visual Analytics Science and Tech- nology, 2017
2017
-
[35]
E. Wall, S. Das, R. Chawla, B. Kalidindi, E. T. Brown, and A. Endert. Podium: Ranking data using mixed-initiative visual analytics. IEEE Trans. on Visualization and Computer Graphics, 24(1):288–297, 2018
2018
-
[36]
Wright, D
W. Wright, D. Schroh, P. Proulx, A. Skaburskis, and B. Cort. The sandbox for analysis: concepts and methods. In Proc. SIGCHI Conf. on Human Factors in Computing Systems, pp. 801–810. ACM, 2006
2006
-
[37]
B. Yee, D. Sehr, G. Dardyk, J. B. Chen, R. Muth, T. Ormandy, S. Okasaka, N. Narula, and N. Fullagar. Native client: A sandbox for portable, untrusted x86 native code. In IEEE Symposium on Security and Privacy, pp. 79–93, May 2009. doi: 10.1109/SP.2009.25
2009 doi
-
[38]
J. S. Yi, Y . a. Kang, and J. Stasko. Toward a deeper understanding of the role of interaction in information visualization. IEEE Trans. on Visualization and Computer Graphics, 13(6):1224–1231, Nov 2007. doi: 10.1109/TVCG.2007.70515
2007
-
[39]
Zilles and G
C. Zilles and G. Sohi. Execution-based prediction using speculative slices. ACM SIGARCH Computer Architecture News , 29(2):2–13, 2001
2001
-
[2015]
doi: 10.1109/MCG.2015.91
2015 doi
-
[2017]
doi: 10.1016/J.IJHCS.2017.03.007
2017 doi
Reviewed August 14, 2026 · model on record in the stance chip above.
Discussion (0). Continue with ORCID to comment.