REVIEW 4 major objections 6 minor 83 references
From Observations to Simulations: A Neural-Network Approach to Intracluster Medium Kinematics
T0 review · 4 major / 6 minor · reviewed 2026-08-03 · deepseek-v4-flash
Pith's one-line read The paper claims that a Siamese convolutional neural network trained on simulated velocity maps can identify, for each of four XMM-Newton clusters, a TNG300 halo whose gas kinematics match the observations, pointing to sloshing, AGN feedbac
desk verdict A sensible proof of concept for deep metric learning on ICM velocity maps, but the validation is partly circular and the physical conclusions outrun the evidence. read the letter →
The pith
A machine-rendered reading of the paper's core claim, the machinery that carries it, and where it could break.
The reading
What carries the argument
The central object is a Siamese convolutional neural network trained with triplet loss, which encodes each velocity map into a 64-dimensional embedding vector such that similar maps lie close in Euclidean distance. The distance between observed and simulated embeddings serves as the matching metric. Training uses anchor-positive-negative triplets drawn from 5016 synthetic velocity maps (40 halos × about 101 projections), and the network's ability to cluster rotational variants of the same halo is cited as evidence that it learns intrinsic kinematic structure rather than projection-dependent artifacts.
What would settle it
Generate mock XMM-Newton-like maps by projecting the best-match TNG300 halos through the EPIC-pn point-spread function, adding background and Poisson noise at the same count levels as the real observations, and re-running the CNN matching; if the top-ranked halo changes or the embedding distance no longer separates the correct halo from random others, the claimed transfer to observations fails.
Extended reading notes
Core claim
The central claim is that a triplet-loss Siamese CNN trained purely on synthetic line-of-sight velocity maps from TNG300 can rank simulated halos by kinematic similarity to real XMM-Newton maps, and that the top-ranked halos for Virgo, Centaurus, Ophiuchus, and A3266 reproduce the observed large-scale velocity gradients and local kinematic substructures. The authors further claim that the embedding space clusters different projection angles of the same halo together, meaning the learned similarity is orientation-invariant and not merely matching viewing geometry. They interpret the matched halos as evidence that ICM motions in these clusters arise from a combination of gas sloshing, AGN feed
Load-bearing premise
The load-bearing premise is that a network trained exclusively on TNG300 synthetic velocity maps—without XMM-Newton response, PSF, or noise modeling—produces embeddings that transfer to real observations; the paper's own validation uses perturbed and random maps within the simulation domain only.
Editorial extensions
If this is right
- If the matches are correct, the four clusters' dynamical states are tied to concrete simulated analogs, giving quantitative gas masses, stellar masses, and star-formation rates (for example, Ophiuchus matching a massive halos with a major-merger velocity field).
- The orientation-invariance result means future comparisons may not need to know the viewing angle in advance; the embedding can absorb projection effects.
- The framework provides a scalable, non-parametric way to connect future high-resolution X-ray velocity maps, such as those from XRISM or Athena, to large-volume cosmological simulations.
- The agreement with TNG300 baryonic properties suggests current feedback models are broadly adequate, while the systematic underprediction of stellar masses identifies a specific place where feedback or star-formation suppression may need adjustment.
Reading between the lines
- A natural next test is to fold the synthetic maps through a mock XMM-Newton instrument response (PSF, background, and Poisson noise) and re-run the match; if the ranking changes, the current similarity metric may partly reflect simulation-specific smoothness rather than physical kinematic state.
- The same embedding approach could be extended to joint maps of velocity plus temperature or metallicity, which may break degeneracies between sloshing and mergers that velocity morphology alone leaves ambiguous.
- Because the method ranks halos, it could be inverted to calibrate simulation subgrid models: systematic mismatches between observed and best-match velocity fields could serve as a loss function for tuning feedback prescriptions.
- The claimed orientation invariance implies a testable corollary: two different halos viewed from angles that produce similar projected kinematics should be close in embedding space, which could be checked with halos of known but different dynamical states.
Signed reviews
Editorial analysis
A structured set of objections, weighed in public.
Referee Report
Summary. The paper presents a Siamese CNN trained with triplet loss on 5016 synthetic LOS velocity maps generated from 40 TNG300 clusters, producing a 64-dimensional embedding for velocity-map morphology. XMM-Newton velocity maps of Virgo, Centaurus, Ophiuchus, and A3266 are embedded and matched to the nearest simulated halos by Euclidean distance. The authors report best-matching halos for each cluster and claim that the simulated maps reproduce the observed large-scale velocity gradients and local substructures, leading to inferences about gas sloshing, AGN feedback, and minority merger activity, and to the broader conclusion that TNG300 feedback physics is supported. The paper acknowledges in §7 that no XMM response/PSF/background modeling was performed and that statistical uncertainties were not propagated.
Significance. Direct ICM velocity maps are rare, and a data-driven method for connecting them to cosmological simulations is timely. The paper builds on recent XMM-Newton measurements and uses a publicly available simulation suite; the baryonic comparison (§6) provides an independent sanity check that the selected halos are not wildly inconsistent with observed masses. If the transfer from clean TNG300 mocks to real XMM maps were validated, the approach could be a scalable and reproducible tool for interpreting future XRISM/Athena velocity maps. However, as written, the central kinematic claim rests on an unvalidated transfer assumption and a validation step that appears circular; the quantitative similarity metrics are quoted without uncertainties. The evidence is therefore not yet sufficient to support the physical conclusions.
major comments (4)
- [§4 (validation paragraph)] The 'additional validation' described in §4 is circular as written: the network is trained on 'artificially generated datasets containing the XMM-Newton observation', so the model identifying the unperturbed observation as the closest match is preordained. This does not establish transfer to real data. Please clarify whether the observation and its perturbed versions were used only after training, or removed from the training set entirely. The same concern applies to the §5.2 claim that the embedding 'successfully clusters rotational variants', because the triplet objective explicitly uses same-halo projections as positive pairs.
- [§5.2 / §4] No held-out, halo-disjoint retrieval test is reported. The training set is described as 10% of the total simulations, but it is not stated whether the validation set contains projections of halos that also appear in the training set. If same-halo projections are in both, the reported orientation-invariance and the discrete distances in Table 2 are inflated. I request a retrieval test on halos completely excluded from training, with quantitative metrics (e.g., recall@k for same-halo projections), and a comparison against a simple pixel-level baseline such as apodized cross-correlation or chi-squared. Without such calibration, the Euclidean distances used for matching have no interpretable scale.
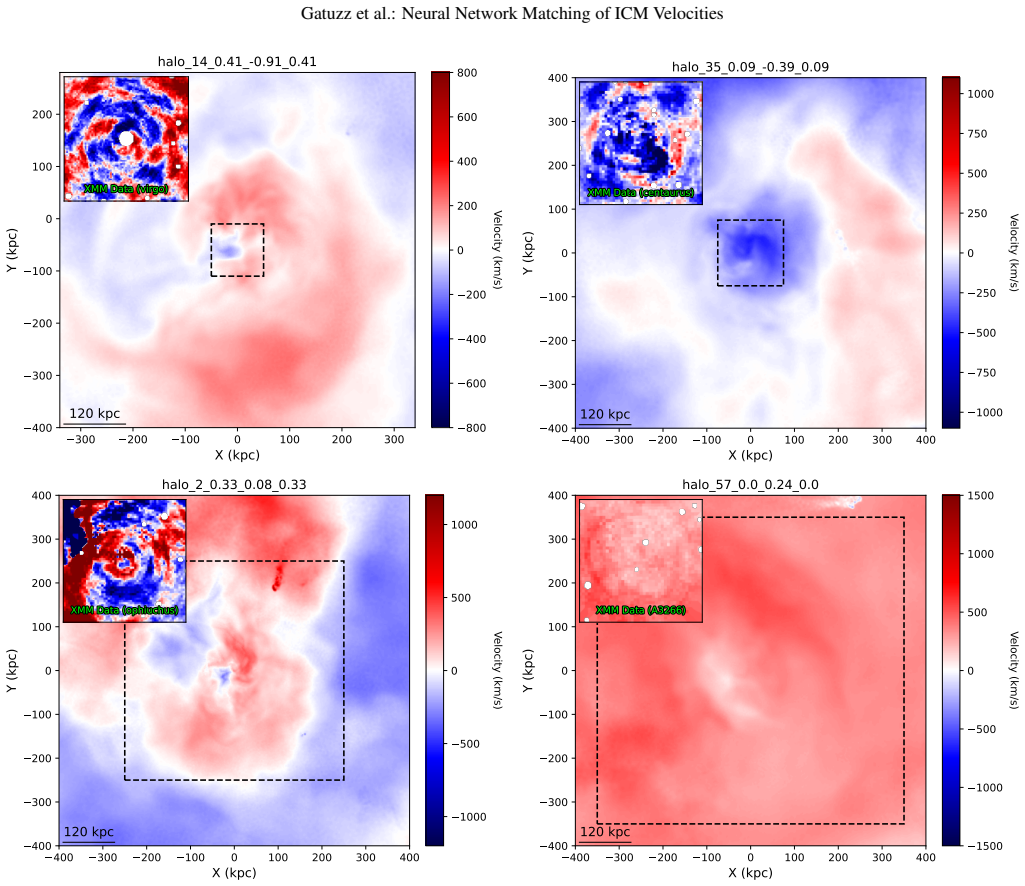
- [§6, Fig. 5 and Table 2] The central claim that the best-matching halos reproduce the observed velocity gradients and substructures is supported only by qualitative visual inspection of Fig. 5. No quantitative comparison is provided—for example, residual velocity maps, gradient magnitude/orientation statistics, or one-dimensional profiles. In addition, Table 2 quotes Euclidean distances to 0.001 with no uncertainties, despite §7 stating that statistical uncertainties are not propagated. Distances should be accompanied by bootstrap or perturbation-based error bars, or rounded to a justified precision.
- [§7 / transfer gap] The acknowledged absence of XMM response, PSF, background, and noise modeling means the embedding, trained on noiseless full-field TNG300 maps, may be responding to simulation-specific smoothness or resolution rather than physical kinematic state. A minimal test is to generate mock XMM-Newton observations of the simulated maps by convolving with the PSF, rebinning to the observational adaptive-bin scheme, adding noise at the observed level, and verifying that retrieval of the input halo is maintained. Without such a test, the similarity rankings in Table 2 cannot be interpreted as physically meaningful. The internal validation with perturbed/random maps does not address this issue.
minor comments (6)
- [§1] The second paragraph lists only Virgo, Centaurus, and Ophiuchus as the comparison clusters, omitting A3266 that is analyzed later; correct the sentence or the list.
- [§4] Hyperparameter selection is based on the lowest triplet loss on the training data, with no validation criterion or early stopping described. Report the validation loss trajectory and whether the selected model retains good generalization.
- [§5.2, Eq. (6)] The relative threshold p is introduced with an example value p=0.20, but the actual value used to define 'very close' matches is not stated. Please give the adopted value and explain the sensitivity of the conclusion to it.
- [Fig. 5] The caption refers to 'the zoom-in panel' showing XMM-Newton data, but it is not clear which panel is the zoom-in or how the observed map is aligned/rebinned relative to the simulated map. Please label the inset and describe the coordinate transformation.
- [References] The reference 'XRISM Collaboration et al. 2025, Nature, 638, 365' appears twice with different capitalization; unify and avoid duplication. Several other entries have inconsistent formatting (e.g., arXiv papers without journal references).
- [§8] The statement that AGN feedback dominates at r≲50-100 kpc and sloshing dominates outside this radius is not derived from any radial analysis in this work. Either add supporting diagnostics or soften the claim to a speculative comment.
Circularity Check
Validation of the CNN is circular: the observation is included in a training set before being 'identified as closest match,' the orientation-invariance claim is the triplet-loss objective, and the 'best-match reproduces observation' claim restates the matching criterion.
-
fitted input called prediction
[Section 4, 'Deep Learning Approach for Velocity Map Matching', additional validation paragraph]
"As additional validation, the network was trained on artificially generated datasets containing the XMM-Newton observation, perturbed versions, and purely random maps. Perturbed images were produced by applying pixel shifts and rotations, while random maps were drawn from a uniform pixel-value distribution. The network correctly identified the unperturbed observation as the closest match, confirming that it learned physically meaningful kinematic representations."
The XMM-Newton observation is part of the training data in this validation. After training on the observation itself, the network 'correctly identified the unperturbed observation as the closest match'—a memorization check, not a generalization test. The same trained CNN is then used in the matching phase (Eq. 5), so this validation cannot confirm that the embeddings transfer to real XMM maps; the 'confirmation' is true by construction because the target was in the training set.
-
self definitional
[Figure 2 caption and Section 5.2, 'Embedding Space Visualization and Analysis']
"Each triplet consists of a reference (Anchor), a matched projection from the same simulation (Positive), and a mismatched projection from a different simulation (Negative). ... Applying this conservative threshold, we find that the 'very close' matches for each cluster correspond to the same halo from the simulation suite, differing only by their three-dimensional orientation. This result validates the Siamese CNN's capability, demonstrating that the embedding space successfully captures the intrinsic structure of a halo and correctly clusters rotational variants as highly similar rather than"
The triplet loss is explicitly trained to pull different projections of the same simulation together (Anchor-Positive pairs are defined as projections of the same simulation). Therefore the finding that rotational variants of the same halo cluster in embedding space is the training objective itself, not an independent demonstration that the CNN captures physically meaningful orientation-invariant structure. The paper presents this optimization outcome as a validation, but it reduces to checking that the loss was minimized.
1 more flagged steps
-
fitted input called prediction
[Abstract and Section 4 matching phase (Eq. 5)]
"We find that the best-matching simulated halos reproduce the observed large-scale velocity gradients and local kinematic substructures, suggesting that the ICM motions in these clusters arise from a combination of gas sloshing, AGN feedback, and minor merger activity. ... The simulation minimizing this distance is identified as the best match."
The 'best match' is defined as the simulation minimizing the learned embedding distance (Eq. 5). Saying that the best-matching halo 'reproduces' the observed velocity structure restates the selection criterion rather than providing an independent test. The dynamical labels (sloshing, AGN feedback, merger) are then read off the selected TNG300 halo and attached to the observed cluster; because all candidate maps come from TNG300, the agreement cannot independently validate the TNG300 feedback model.
full rationale
The paper's core pipeline—train a Siamese CNN on TNG300 velocity maps, embed real XMM maps, and retrieve the nearest simulated halo—is not by itself circular: the CNN is trained on simulations, not on the physical labels, and the retrieval is a nearest-neighbor operation. However, the validity checks that justify the method are circular. (1) The 'additional validation' trains a network on datasets that include the actual XMM-Newton observation, then reports that the network identifies the unperturbed observation as the closest match; with the target in the training set, this is a memorization check, not evidence of transfer to real XMM data. (2) The orientation-invariance claim is the triplet-loss objective, since positive pairs are defined as different projections of the same simulation; observing that such projections cluster verifies the loss was minimized, not that the embedding captures physical kinematic state. (3) The abstract's claim that the best-matching halos 'reproduce' the observed velocity structure is a restatement of the matching criterion in Eq. 5, and the dynamic-state labels are transferred from the selected TNG300 halo without an external test that embedding similarity implies the same physical mechanism. These issues are partly anticipated by the caveats in Section 7 (no XMM response/PSF/background modeling, no statistical uncertainties), but the circular validation is not acknowledged. Because the central matching still has independent content—the CNN was not explicitly fit to the physical labels—the paper is partially circular rather than fully reducible to its inputs.
Assumptions & free parameters
free parameters (4)
- CNN architecture hyperparameters (embedding dimension, triplet margin, learning rate, epochs, batch size, steps per epoc =
embedding_dim=64, margin=0.1, lr=1e-4, epochs=100, batch_size=32, steps_per_epoch=75
- Relative 'very close' threshold p =
0.20 (20%)
- Training fraction of simulated maps =
10%
- Line-of-sight projection grid =
101 orientations (theta in [5,85] deg, phi in [0,175] deg in 10 deg steps)
assumptions (5)
- domain assumption TNG300 subgrid physics (AGN feedback, star formation) produces ICM velocity fields that are representative of real clusters at the scales compared.
- ad hoc to paper The CNN embedding trained only on TNG300 simulations transfers to XMM-Newton observations.
- domain assumption Observed XMM-Newton LOS velocities trace the same physical quantity as emissivity-weighted simulated bulk velocities.
- domain assumption The BCG systemic velocity frame used to re-center simulated maps is correct.
- ad hoc to paper Euclidean distance in the learned embedding measures physically meaningful similarity.
Cite this review
Pith. "Pith review of From Observations to Simulations: A Neural-Network Approach to Intracluster Medium Kinematics." pith.science (2026). https://pith.science/paper/7SOCF6ZM
@misc{pith2026251120755,
  author       = {Pith},
  title        = {Pith review of: From Observations to Simulations: A Neural-Network Approach to Intracluster Medium Kinematics},
  year         = {2026},
  howpublished = {\url{https://pith.science/paper/7SOCF6ZM}},
  note         = {Machine review of arXiv:2511.20755}
}
read the original abstract
We present a systematic comparison between {\it XMM-Newton} velocity maps of the Virgo, Centaurus, Ophiuchus and A3266 clusters and synthetic velocity maps generated from the Illustris TNG-300 simulations. Our goal is to constrain the physical conditions and dynamical states of the intracluster medium (ICM) through a data-driven approach. We employ a Siamese Convolutional Neural Network (CNN) designed to identify the most analogous simulated cluster to each observed system based on the morphology of their line-of-sight velocity maps. The model learns a high-dimensional similarity metric between observations and simulations, allowing us to capture subtle kinematic and structural patterns beyond traditional statistical tests. We find that the best-matching simulated halos reproduce the observed large-scale velocity gradients and local kinematic substructures, suggesting that the ICM motions in these clusters arise from a combination of gas sloshing, AGN feedback, and minor merger activity. Our results demonstrate that deep learning provides a powerful and objective framework for connecting X-ray observations to cosmological simulations, offering new insights into the dynamical evolution of galaxy clusters and the mechanisms driving turbulence and bulk flows in the hot ICM.
Figures


Figures from the paper (2 more)

Reference graph
Works this paper leans on
-
[1]
& Hurn, M
Andreon, S. & Hurn, M. A. 2010, MNRAS, 404, 1922
2010
-
[2]
& Markevitch, M
Ascasibar, Y . & Markevitch, M. 2006, ApJ, 650, 102 1 https://www.tng-project.org Article number, page 8 of 9 Gatuzz et al.: Neural Network Matching of ICM Velocities
2006
-
[3]
V ., Del Popolo, A., & Vavilova, I
Babyk, I. V ., Del Popolo, A., & Vavilova, I. B. 2014, Astronomy Reports, 58, 587
2014
-
[4]
Bambic, C. J. & Reynolds, C. S. 2019, ApJ, 886, 78
2019
-
[5]
J., V ogelsberger, M., Kannan, R., et al
Barnes, D. J., V ogelsberger, M., Kannan, R., et al. 2018, MNRAS, 481, 1809
2018
-
[6]
2023, A&A, 675, A123 Brüggen, M., Ruszkowski, M., & Hallman, E
Boselli, A., Fossati, M., Côté, P., et al. 2023, A&A, 675, A123 Brüggen, M., Ruszkowski, M., & Hallman, E. 2005, ApJ, 630, 740
2023
-
[7]
2019, arXiv e-prints, arXiv:1901.00461
Brunel, A., Pasquet, J., Pasquet, J., et al. 2019, arXiv e-prints, arXiv:1901.00461
arXiv 2019
-
[8]
2012, A&A, 540, A52
Cortese, L., Ciesla, L., Boselli, A., et al. 2012, A&A, 540, A52
2012
Show all 83 references
-
[9]
N., Kochanek, C
Dai, X., Bregman, J. N., Kochanek, C. S., & Rasia, E. 2010, ApJ, 719, 119 De Grandi, S. & Molendi, S. 1999, ApJ, 527, L25
2010
-
[10]
2009, MNRAS, 399, 497 Domínguez Sánchez, H., Huertas-Company, M., Bernardi, M., Tuccillo, D., &
Dolag, K., Borgani, S., Murante, G., & Springel, V . 2009, MNRAS, 399, 497 Domínguez Sánchez, H., Huertas-Company, M., Bernardi, M., Tuccillo, D., &
2009
-
[11]
Fischer, J. L. 2018, MNRAS, 476, 3661
2018
-
[12]
2015, A&A, 583, A124
Durret, F., Wakamatsu, K., Nagayama, T., Adami, C., & Biviano, A. 2015, A&A, 583, A124
2015
-
[13]
W., Roberts, I
Edler, H. W., Roberts, I. D., Boselli, A., et al. 2024, A&A, 683, A149
2024
-
[14]
C., Walker, S
Fabian, A. C., Walker, S. A., Russell, H. R., et al. 2016, MNRAS, 461, 922
2016
-
[15]
2012, ApJS, 200, 4
Ferrarese, L., Côté, P., Cuillandre, J.-C., et al. 2012, ApJS, 200, 4
2012
-
[16]
2016, ApJ, 824, 10
Ferrarese, L., Côté, P., Sánchez-Janssen, R., et al. 2016, ApJ, 824, 10
2016
-
[17]
2007, ApJ, 665, 1057
Forman, W., Jones, C., Churazov, E., et al. 2007, ApJ, 665, 1057
2007
-
[18]
Foster, A., Smith, R., & Brickhouse, N. S. 2019, in American Astronomical So- ciety Meeting Abstracts, V ol. 233, American Astronomical Society Meeting Abstracts #233, 251.05
2019
-
[19]
2025, PASJ, 77, S270
Fujita, Y ., Fukushima, K., Sato, K., Fukazawa, Y ., & Kondo, M. 2025, PASJ, 77, S270
2025
-
[20]
T., & Zhuravleva, I
Gaspari, M., Churazov, E., Nagai, D., Lau, E. T., & Zhuravleva, I. 2014, A&A, 569, A67
2014
-
[21]
2025a, arXiv e-prints, arXiv:2511.10740
Gatuzz, E., Sanders, J., Liu, A., et al. 2025a, arXiv e-prints, arXiv:2511.10740
-
[22]
2024, A&A, 692, A108
Gatuzz, E., Sanders, J., Liu, A., et al. 2024, A&A, 692, A108
2024
-
[23]
S., Canning, R., et al
Gatuzz, E., Sanders, J. S., Canning, R., et al. 2022a, MNRAS, 513, 1932
1932
-
[24]
2012, A&A, 545, A16
Gavazzi, G., Fumagalli, M., Galardo, V ., et al. 2012, A&A, 545, A16
2012
-
[25]
H., Sivanandam, S., Zabludoff, A
Gonzalez, A. H., Sivanandam, S., Zabludoff, A. I., & Zaritsky, D. 2013, ApJ, 778, 14
2013
-
[26]
2018, ApJ, 857, 26
Ha, J.-H., Ryu, D., & Kang, H. 2018, ApJ, 857, 26
2018
-
[27]
2010, ApJ, 708, 462
Heinz, S., Brüggen, M., & Morsony, B. 2010, ApJ, 708, 462
2010
-
[28]
H., & Davis, D
Henriksen, M., Donnelly, R. H., & Davis, D. S. 2000, ApJ, 529, 692
2000
-
[29]
Henriksen, M. J. & Dusek, S. 2021, International Journal of Astronomy and Astrophysics, 11, 95
2021
-
[30]
2015, ApJS, 221, 8
Huertas-Company, M., Gravet, R., Cabrera-Vives, G., et al. 2015, ApJS, 221, 8
2015
-
[31]
C., & Takahashi, T
Ichinohe, Y ., Simionescu, A., Werner, N., Fabian, A. C., & Takahashi, T. 2019, MNRAS, 483, 1744
2019
-
[32]
Kravtsov, A. V . & Borgani, S. 2012, ARA&A, 50, 353
2012
-
[33]
T., Kravtsov, A
Lau, E. T., Kravtsov, A. V ., & Nagai, D. 2009, ApJ, 705, 1129
2009
-
[34]
2020, A&A, 637, A58
Liu, A., Tozzi, P., Ettori, S., et al. 2020, A&A, 637, A58
2020
-
[35]
2018, ApJ, 863, 102
Liu, A., Yu, H., Diaferio, A., et al. 2018, ApJ, 863, 102
2018
-
[36]
2015, ApJ, 809, 27
Liu, A., Yu, H., Tozzi, P., & Zhu, Z.-H. 2015, ApJ, 809, 27
2015
-
[37]
2016, ApJ, 821, 29
Liu, A., Yu, H., Tozzi, P., & Zhu, Z.-H. 2016, ApJ, 821, 29
2016
-
[38]
S., Mao, S., & Meng, X
Liu, F. S., Mao, S., & Meng, X. M. 2012, MNRAS, 423, 422
2012
-
[39]
2018, MNRAS, 480, 5113
Marinacci, F., V ogelsberger, M., Pakmor, R., et al. 2018, MNRAS, 480, 5113
2018
-
[40]
H., Veronica, A., et al
McCall, H., Reiprich, T. H., Veronica, A., et al. 2024, A&A, 689, A113
2024
-
[41]
2009, A&A, 496, 683
Misgeld, I., Hilker, M., & Mieske, S. 2009, A&A, 496, 683
2009
-
[42]
P., Ferland, G., et al
Mittal, R., O’Dea, C. P., Ferland, G., et al. 2011, MNRAS, 418, 2386
2011
-
[43]
& Sharma, P
Mohapatra, R. & Sharma, P. 2019, MNRAS, 484, 4881
2019
-
[44]
R., Sazonova, E., Roberts, I
Morgan, C. R., Sazonova, E., Roberts, I. D., et al. 2025, ApJ, 987, 166
2025
-
[45]
P., Pillepich, A., Springel, V ., et al
Naiman, J. P., Pillepich, A., Springel, V ., et al. 2018, MNRAS, 477, 1206
2018
-
[46]
2019, MNRAS, 490, 3234
Nelson, D., Pillepich, A., Springel, V ., et al. 2019, MNRAS, 490, 3234
2019
-
[47]
2018, MNRAS, 475, 624
Nelson, D., Pillepich, A., Springel, V ., et al. 2018, MNRAS, 475, 624
2018
-
[48]
Nulsen, P. E. J. & Bohringer, H. 1995, MNRAS, 274, 1093
1995
-
[49]
& Yoshida, H
Ota, N. & Yoshida, H. 2016, PASJ, 68, S19
2016
-
[50]
N., Eilek, J
Owen, F. N., Eilek, J. A., & Kassim, N. E. 2000, ApJ, 543, 611
2000
-
[51]
Pearson, K. A. 2019, AJ, 158, 243
2019
-
[52]
2018, MNRAS, 473, 4077 Planck Collaboration, Ade, P
Pillepich, A., Springel, V ., Nelson, D., et al. 2018, MNRAS, 473, 4077 Planck Collaboration, Ade, P. A. R., Aghanim, N., et al. 2016, A&A, 594, A13
2018
-
[53]
Quintana, H., Ramirez, A., & Way, M. J. 1996, AJ, 112, 36
1996
-
[54]
W., Nulsen, P
Randall, S. W., Nulsen, P. E. J., Jones, C., et al. 2015, ApJ, 805, 112
2015
-
[55]
2015, MNRAS, 449, 49 Sánchez-Janssen, R., Côté, P., Ferrarese, L., et al
Rodriguez-Gomez, V ., Genel, S., V ogelsberger, M., et al. 2015, MNRAS, 449, 49 Sánchez-Janssen, R., Côté, P., Ferrarese, L., et al. 2019, ApJ, 878, 18
2015
-
[56]
S., Biffi, V ., Brüggen, M., et al
Sanders, J. S., Biffi, V ., Brüggen, M., et al. 2022, A&A, 661, A36
2022
-
[57]
S., Dennerl, K., Russell, H
Sanders, J. S., Dennerl, K., Russell, H. R., et al. 2020, A&A, 633, A42
2020
-
[58]
S., Fabian, A
Sanders, J. S., Fabian, A. C., Taylor, G. B., et al. 2016, MNRAS, 457, 82
2016
-
[59]
& Jerjen, H
Saviane, I. & Jerjen, H. 2007, AJ, 133, 1756
2007
-
[60]
F., Behrens, C., & Niemeyer, J
Schmidt, W., Byrohl, C., Engels, J. F., Behrens, C., & Niemeyer, J. C. 2017, MNRAS, 470, 142
2017
-
[61]
2015, in 2015 IEEE Conference on Computer Vision and Pattern Recognition (CVPR), 815–823
Schroff, F., Kalenichenko, D., & Philbin, J. 2015, in 2015 IEEE Conference on Computer Vision and Pattern Recognition (CVPR), 815–823
2015
-
[62]
R., et al
Simionescu, A., Werner, N., Forman, W. R., et al. 2010, MNRAS, 405, 91
2010
-
[63]
J., Zahid, H
Sohn, J., Geller, M. J., Zahid, H. J., et al. 2017, ApJS, 229, 20
2017
-
[64]
2010, MNRAS, 401, 791
Springel, V . 2010, MNRAS, 401, 791
2010
-
[65]
2018, MNRAS, 475, 676
Springel, V ., Pakmor, R., Pillepich, A., et al. 2018, MNRAS, 475, 676
2018
-
[66]
Springel, V ., White, S. D. M., Jenkins, A., et al. 2005, Nature, 435, 629
2005
-
[67]
Springel, V ., White, S. D. M., Tormen, G., & Kauffmann, G. 2001, MNRAS, 328, 726
2001
-
[68]
W., et al
Vazza, F., Angelinelli, M., Jones, T. W., et al. 2018, MNRAS, 481, L120
2018
-
[69]
2011, A&A, 529, A17
Vazza, F., Brunetti, G., Gheller, C., Brunino, R., & Brüggen, M. 2011, A&A, 529, A17
2011
-
[70]
2021, A&A, 653, A23
Vazza, F., Wittor, D., Brunetti, G., & Brüggen, M. 2021, A&A, 653, A23
2021
-
[71]
H., Pacaud, F., et al
Veronica, A., Reiprich, T. H., Pacaud, F., et al. 2025, A&A, 694, A168
2025
-
[72]
A., Fabian, A
Walker, S. A., Fabian, A. C., Sanders, J. S., Simionescu, A., & Tawara, Y . 2013, MNRAS, 432, 554
2013
-
[73]
2018, MNRAS, 479, 4056
Weinberger, R., Springel, V ., Pakmor, R., et al. 2018, MNRAS, 479, 4056
2018
-
[74]
2000, ApJ, 542, 914 Xrism Collaboration, Audard, M., Awaki, H., et al
Wilms, J., Allen, A., & McCray, R. 2000, ApJ, 542, 914 Xrism Collaboration, Audard, M., Awaki, H., et al. 2025, Nature, 638, 365 XRISM Collaboration, Audard, M., Awaki, H., et al. 2025, Nature, 638, 365
2000
-
[75]
Yang, H. Y . K. & Reynolds, C. S. 2016, ApJ, 829, 90
2016
-
[76]
2019, MNRAS, 483, 1042
Yun, K., Pillepich, A., Zinger, E., et al. 2019, MNRAS, 483, 1042
2019
-
[77]
2025, arXiv e-prints, arXiv:2510.12782
Zhang, C., Zhuravleva, I., Heinrich, A., et al. 2025, arXiv e-prints, arXiv:2510.12782
2025
-
[78]
2022, Research in Astronomy and Astro- physics, 22, 055002
Zhang, Z., Zou, Z., Li, N., & Chen, Y . 2022, Research in Astronomy and Astro- physics, 22, 055002
2022
-
[79]
A., et al
Zhuravleva, I., Churazov, E., Schekochihin, A. A., et al. 2014, Nature, 515, 85
2014
-
[80]
ZuHone, J. A. & Hallman, E. J. 2016, pyXSIM: Synthetic X-ray observations generator, Astrophysics Source Code Library, record ascl:1608.002
2016
-
[81]
A., Miller, E
ZuHone, J. A., Miller, E. D., Bulbul, E., & Zhuravleva, I. 2018, ApJ, 853, 180
2018
-
[82]
A., Miller, E
ZuHone, J. A., Miller, E. D., Simionescu, A., & Bautz, M. W. 2016, ApJ, 821, 6
2016
-
[83]
A., Schellenberger, G., Ogorzałek, A., et al
ZuHone, J. A., Schellenberger, G., Ogorzałek, A., et al. 2024, ApJ, 967, 49 Article number, page 9 of 9
2024
Reviewed August 3, 2026 · model on record in the stance chip above.
Discussion (0). Continue with ORCID to comment.