REVIEW 3 major objections 4 minor 1 cited by
A Photometric and Spectroscopic Investigation of the DB White Dwarf Population using SDSS and Gaia Data
T0 review · 3 major / 4 minor · reviewed 2026-08-14 · deepseek-v4-flash
Pith's one-line read Most cool DBA white dwarfs carry too much hydrogen to be explained by convective dilution, so the hydrogen must have been accreted from outside the star.
desk verdict A thorough DB white dwarf census from SDSS/Gaia with a useful catalog and binary candidates; the hydrogen-origin conclusion is conditional on homogeneous-mixing models that the paper itself flags but does not test. read the letter →
The pith
A machine-rendered reading of the paper's core claim, the machinery that carries it, and where it could break.
The reading
What carries the argument
The load-bearing machinery is a grid of LTE model atmospheres for helium-rich white dwarfs, with varying hydrogen and calcium abundances, computed with the ML2/$\alpha=1.25$ mixing-length prescription and a van der Waals broadening treatment chosen for this study. Two fitting techniques are paired: the photometric technique fits the $ugriz$ energy distribution plus a Gaia parallax to obtain $T_{\rm eff}$, solid angle, radius, and ultimately mass through a carbon/oxygen-core mass-radius relation; the spectroscopic technique fits normalized SDSS spectra to obtain $T_{\rm eff}$, $\log g$, and $\log(\mathrm{H/He})$ simultaneously. The decisive element is the $T_{\rm eff}$-$\log(\mathrm{H/He})$ diagram populated with constant-total-hydrogen-mass sequences from the homogeneous-mixing simulations; those sequences define a 'forbidden region' that a cooling star cannot cross with a fixed hydrogen reservoir. Comparing the observed abundances with those tracks is what turns photospheric hydrogen measurements into a statement about the total hydrogen reservoir and its origin.
What would settle it
Measure high-signal spectra of a sample of DBA white dwarfs below 20,000 K and compute each star's total hydrogen mass with the paper's homogeneous-envelope models: if a substantial fraction fall below $\log(M_H/M_\odot) \sim -15$ (the residual-dilution range), the central claim fails. A second disproof would be a DA white dwarf with a hydrogen layer near $10^{-12}\,M_\odot$ that nevertheless converts to a DB near 20,000 K.
Extended reading notes
Core claim
The paper's central discovery is that the hydrogen seen in most DBA white dwarfs below $T_{\rm eff} \sim 20,000$ K cannot be a residual byproduct of the DA-to-DB transition. Using the measured hydrogen-to-helium ratios together with homogeneous mixing sequences at fixed total hydrogen mass, the inferred total hydrogen in the mixed envelope falls in the range $\log(M_H/M_\odot) \sim -14$ to $-10$. A DA progenitor with such a thick hydrogen layer would not have convectively mixed and become a DB in the first place; residual dilution would leave orders of magnitude less hydrogen. The paper therefore concludes that an external hydrogen source, such as interstellar accretion, comets, or disrupted asteroids, must be invoked for the bulk of cool DBA stars, while convective dilution remains the best explanation for the DA-to-DB conversion itself. It also reports a population of 55 DB+DB and 10 DA+DB unresolved binaries, identified by the discrepancy between photometric and spectroscopic masses, and shows that the DB/(DA+DB) ratio rises from about 5 percent at high temperatures to about 25 percent near 15,000 K before falling as DB stars turn into DC stars.
Load-bearing premise
The whole hydrogen-origin argument assumes that the envelope models used to convert photospheric hydrogen abundance into a total hydrogen mass, including the location of the forbidden region, are correct; if chemically stratified envelopes or improved convection models change that conversion, the seemingly excessive hydrogen could still be residual.
Editorial extensions
If this is right
- Most cool DBA white dwarfs must have gained hydrogen after becoming DB stars, making external pollution a common stage of white dwarf evolution rather than a rare event.
- The DA-to-DB transition is confined to a narrow band of hydrogen layer masses, around $\log(M_H/M_\odot)\sim -14$, setting a tight constraint on DA progenitor envelopes.
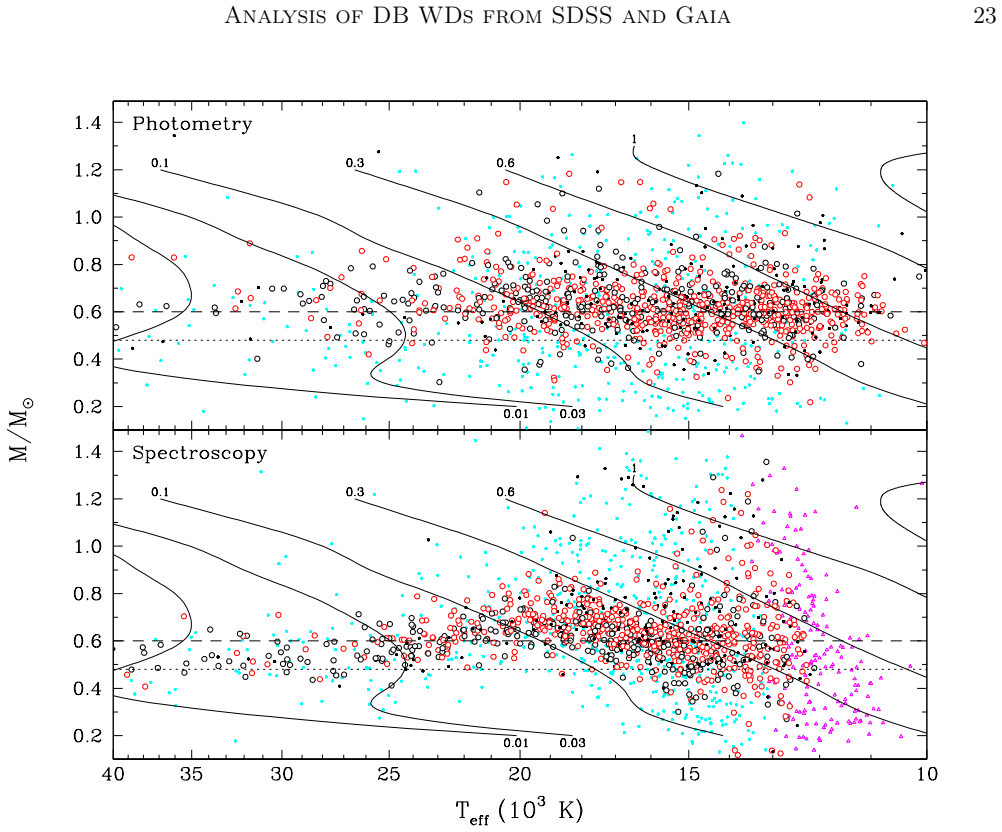
- Most apparently low-mass DB white dwarfs are unresolved double degenerates; single DB white dwarfs below about 0.48 solar masses appear not to exist.
- Massive DB white dwarfs below about 22,000 K may be former Hot DQ carbon-atmosphere white dwarfs, linking two otherwise separate white dwarf populations.
- The DB/(DA+DB) ratio climbs from about 5 percent to about 25 percent as stars cool to 15,000 K, then drops as the coolest DB stars become DC stars, broadly matching convective dilution.
Reading between the lines
- Beyond the paper: if accretion supplies most cool DBA hydrogen, then hydrogen abundance should correlate with metal abundances and with infrared excess from debris disks; combining these SDSS measurements with follow-up mid-infrared photometry would test that link.
- Beyond the paper: the 55 DB+DB candidates, if confirmed by radial-velocity monitoring, imply a large population of merging double-degenerate systems that could contribute to gravitational-wave sources and Type Ia supernova progenitors.
- Beyond the paper: the continued existence of pure DB stars without hydrogen hints at a separate formation channel, possibly born-again post-AGB stars; searching for carbon or kinematic peculiarities in the pure DB sample could distinguish that channel.
- Beyond the paper: the authors' finding that 3D corrections over-shoot $\log g$ below 20,000 K suggests hydrogen itself alters convection; computing 3D models that include trace hydrogen would test whether the forbidden region shrinks.
Signed reviews
Editorial analysis
A structured set of objections, weighed in public.
Referee Report
Summary. This paper presents a homogeneous analysis of 1915 spectroscopically identified DB white dwarfs from SDSS DR12, using LTE model atmospheres with an updated van der Waals broadening treatment, ML2/alpha = 1.25, and C/O-core evolutionary models. Atmospheric and physical parameters are measured independently from ugriz photometry plus Gaia DR2 parallaxes and from optical spectroscopy. The authors compare the two techniques, derive photometric and spectroscopic mass distributions, identify 10 DA+DB and 55 DB+DB unresolved double degenerate candidates on the basis of mass discrepancies and low photometric masses, measure hydrogen and calcium abundances, and use the hydrogen abundance versus effective temperature diagram to infer total hydrogen masses from homogeneous mixed-envelope models. They conclude that the bulk of DBA white dwarfs below roughly 20,000 K have total hydrogen masses too large to be of residual origin from the convective dilution scenario, so external or internal sources of hydrogen must be invoked. They also construct the DB/(DA+DB) ratio as a function of effective temperature and argue that the observed variation is consistent with convective dilution occurring near 20,000 K.
Significance. If the conclusions hold, this is a useful reference study: it is among the largest DB white dwarf samples analyzed with Gaia parallaxes, it provides machine-readable parameter tables, and it includes a careful discussion of internal and external errors as well as a comparison with Koester & Kepler (2015). The candidate lists of unresolved DB+DB and DA+DB systems are valuable, and the finding that the DB and DBA mass distributions are indistinguishable is a substantive empirical result under the stated model assumptions. The paper is also transparent about several known limitations, including van der Waals broadening, 3D effects, and SDSS flux calibration. However, the central hydrogen-origin claim depends on the conversion of photospheric H/He into a total hydrogen mass using homogeneous envelope models; the paper itself flags the chemically stratified alternative in Section 8 but does not test it. Because that untested assumption is load-bearing for the conclusion that non-residual hydrogen sources 'must be invoked,' the manuscript requires revision before the central claim can be accepted.
major comments (3)
- [Section 7.2, Figure 24] The conclusion that the bulk of DBA white dwarfs below about 20,000 K have total hydrogen masses too large to have a residual origin is load-bearing but rests entirely on the conversion of each measured photospheric H/He ratio into a total hydrogen mass using homogeneously mixed envelope models from Rolland et al. (2018). If the atmosphere or envelope is chemically stratified, with hydrogen concentrated near the surface rather than uniformly mixed through the helium convection zone, the same photospheric H/He would correspond to a much smaller total hydrogen mass. The paper itself acknowledges this possibility in Section 8, where it states that the conclusion holds 'unless the hydrogen-to-helium abundance ratio measured using homogeneous model atmospheres is somehow overestimated, for instance, if the atmosphere is chemically inhomogeneous.' This caveat directly undercuts the strength of the claim that external sources 'must be invoked.' I ask the authors either to quantify the effect of stratification on the inferred MH values for their cool DBA sample, or to soften the conclusion to a conditional statement that depends on the homogeneous-mixing assumption.
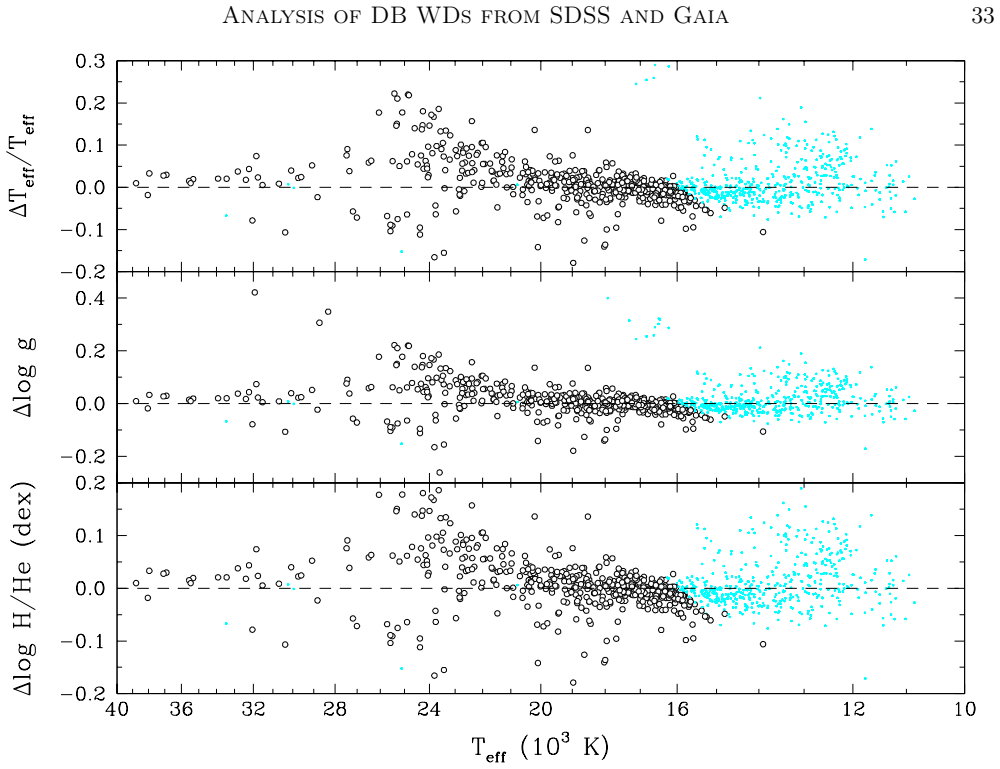
- [Section 6.1, Tables 2 and 3] The identification of 55 DB+DB unresolved double degenerate candidates relies on the assumption that low photometric masses and large photometric-spectroscopic mass discrepancies are caused by unresolved binarity. This is an indirect identification: the same signatures could in principle be produced by systematic errors in the photometric mass scale, the adopted mass-radius relation, the parallax calibration, or the spectroscopic log g scale. The paper itself documents that spectroscopic masses are affected by van der Waals broadening below about 16,000 K, by residual SDSS flux calibration above about 27,000 K, and by 3D effects near 17,000 K, while photometric masses depend on Gaia parallaxes and the evolutionary mass-radius relation. Because the double-degenerate candidate list is one of the paper's principal new empirical claims, it would strengthen the analysis to include at least one independent check, such as radial-velocity monitoring, astrometric excess noise from Gaia, or spectral decomposition for a subsample, plus a discussion of how many candidates would survive plausible systematic shifts in either mass scale. Absent such validation, the wording 'clear evidence for a large population' is stronger than the evidence supports.
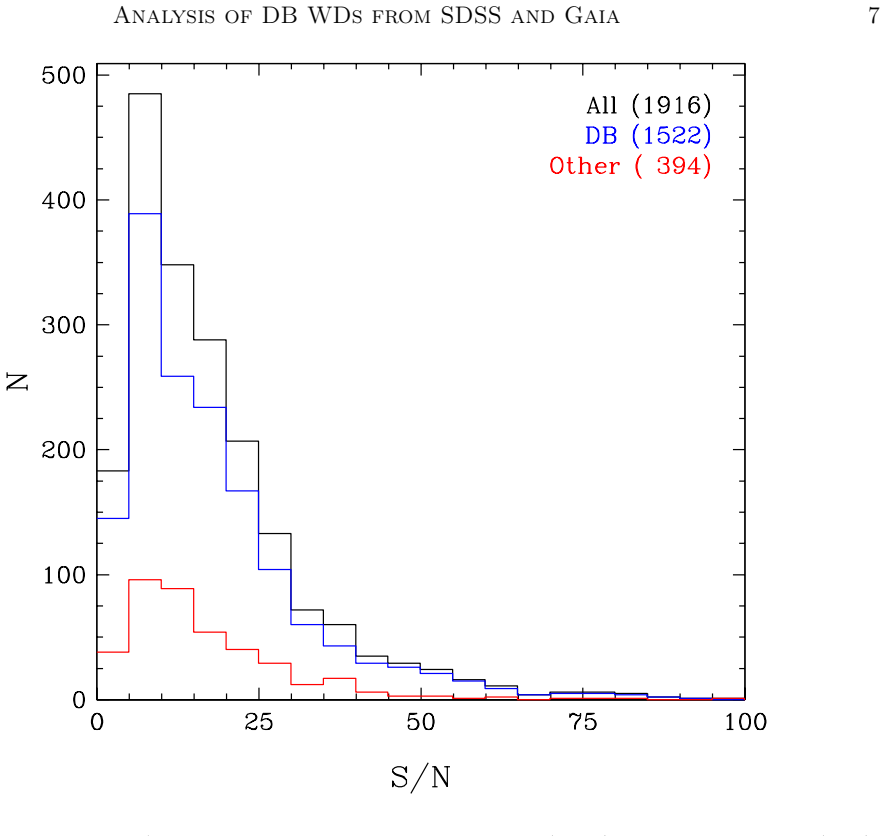
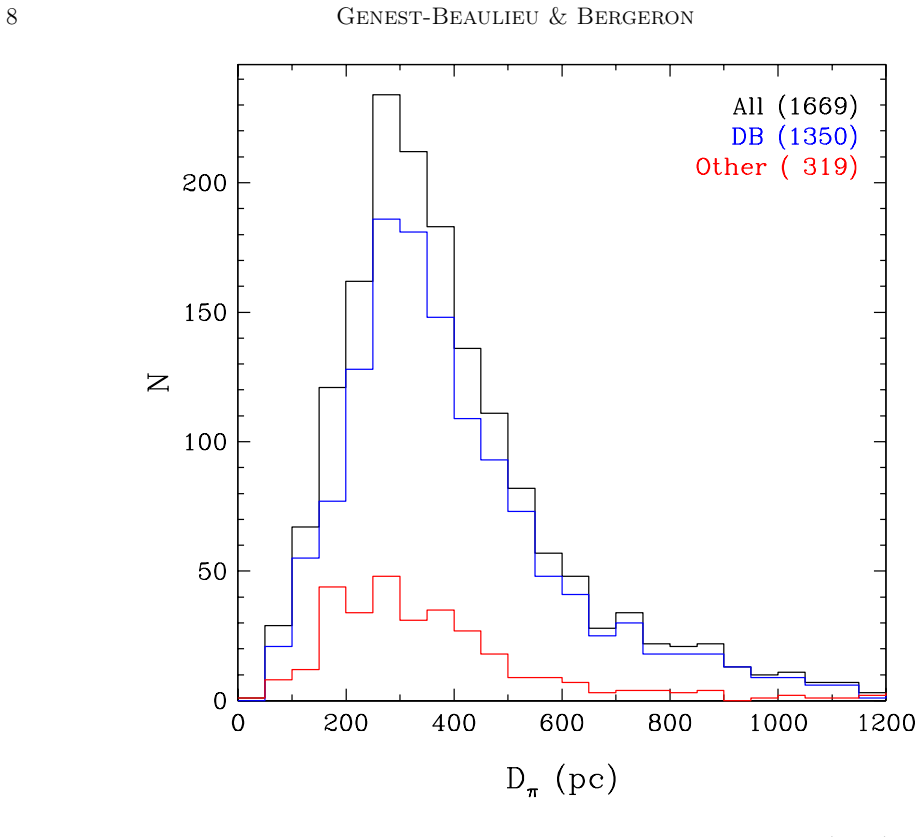
- [Section 7.1, Figure 23] The quantitative DB/(DA+DB) ratio as a function of effective temperature depends on a magnitude-limited SDSS sample restricted to objects within 1 kpc, a single completeness weight factor of 1.5 applied to objects with u-g > 0, and S/N cuts. The paper also reports an anomalous depletion in the DA temperature distribution near 14,000 K spectroscopically and near 12,000 K photometrically, which it attributes to temperature-scale artifacts rather than to a real change in the DA population. Since this depletion occurs in the same temperature range where the claimed rise in the DB fraction is steepest, the quantitative shape of the ratio near 15,000 K is vulnerable to the same artifacts. I request a sensitivity analysis of the ratio to the completeness weight, to the temperature scale, and to the treatment of the DA depletion, or alternatively a more cautious wording that restricts the robust claim to the qualitative rise below about 20,000 K.
minor comments (4)
- [Section 5.1] The paper excludes spectra with marginal helium lines and defines a detectability limit in terms of the He I 4471 equivalent width, but it would be helpful to state explicitly how many objects are removed by this criterion and whether the remaining cool sample is sufficiently large to support the claim that part of the low-temperature log g scatter is real.
- [Section 6.1, Table 3] Table 3 would be easier to interpret if each object were tagged with the specific flag that qualified it as a DB+DB candidate (Mspec - Mphot >= 0.2 Msun, Mphot <= 0.45 Msun, or both), rather than leaving the reader to recompute the thresholds from the listed parameters.
- [Section 8] The reference to 'B. Rolland et al. (2019, in preparation)' for the internal dredge-up scenario should be replaced by a published reference or an arXiv identifier if one is available, since this scenario is invoked as an alternative explanation for the hydrogen excess.
- [Figure captions] Several figure captions refer to 'the description of symbols is identical to that of Figure 7,' but Figure 7 has three panels with different sample definitions; a brief restatement of the symbol conventions in each caption would improve readability.
Circularity Check
No circularity found: the paper fits parameters to public SDSS/Gaia data and compares them with forward constant-MH simulations; the hydrogen conclusion is model-dependent but not derived from its own inputs.
full rationale
The paper's parameter determinations are fits to public SDSS photometry/spectroscopy and Gaia parallaxes using model atmospheres; the atmospheric parameters are not derived from the paper's conclusions. The central hydrogen conclusion compares measured H/He versus Teff to constant-MH sequences from Rolland et al. (2018). Those sequences are forward calculations from assumed total hydrogen masses and stated mixing-length prescriptions; they were not fitted to the SDSS points, so the inference that cool DBA stars require MH in the range -14 < log MH/Msun < -10 is a model-dependent measurement, not a tautology. The paper explicitly flags the key assumption in Section 8: 'unless the hydrogen-to-helium abundance ratio measured using homogeneous model atmospheres is somehow overestimated, for instance, if the atmosphere is chemically inhomogeneous.' That is a genuine caveat about model dependence, but it is not a circular reduction: the observed H/He values and the Rolland et al. curves share a homogeneous-mixing convention, yet the conclusion follows from the location of the data relative to curves of constant MH, not from the definition of MH. DB+DB candidates are identified through photometric versus spectroscopic mass discrepancies, which is a classification based on an assumed binary interpretation, not a derived prediction. Self-citations (GBB19, Rolland et al. 2018, Genest-Beaulieu & Bergeron 2017) are used for grids, methods, and prior simulations, but these are published, stated-assumption results with independent content; the core measurements and comparisons are externally anchored to SDSS and Gaia data. No step reduces by construction to its own input.
Assumptions & free parameters
free parameters (5)
- Mixing-length parameter alpha =
1.25
- Thin hydrogen layer mass fraction q(H) =
1e-10
- Photometric uncertainty floor =
0.03 mag per band
- Completeness weight for u-g>0 objects =
1.5
- Extinction regime thresholds =
D<=100 pc negligible; maximum at |z|>250 pc
assumptions (5)
- domain assumption LTE model atmospheres with ML2/alpha=1.25 mixing-length convection describe DB atmospheres
- domain assumption Van der Waals broadening treatment from Deridder and van Rensbergen (1976) is adequate for cool DB stars
- domain assumption Evolutionary models with C/O cores, q(He)=1e-2, and q(H)=1e-10 provide the mass-radius relation
- domain assumption Interstellar extinction follows the Harris et al. (2006) prescription
- domain assumption SDSS spectroscopic completeness for u-g>0 is 66% of that for u-g<0, corrected with a 1.5 weight
Cite this review
Pith. "Pith review of A Photometric and Spectroscopic Investigation of the DB White Dwarf Population using SDSS and Gaia Data." pith.science (2026). https://pith.science/paper/7VJ6CZX4
@misc{pith2026190801728,
  author       = {Pith},
  title        = {Pith review of: A Photometric and Spectroscopic Investigation of the DB White Dwarf Population using SDSS and Gaia Data},
  year         = {2026},
  howpublished = {\url{https://pith.science/paper/7VJ6CZX4}},
  note         = {Machine review of arXiv:1908.01728}
}
abstract
We present a comprehensive analysis of DB white dwarfs drawn from the Sloan Digital Sky Survey, based on model fits to $ugriz$ photometry and medium resolution spectroscopy from the SDSS. We also take advantage of the exquisite trigonometric parallax measurements recently obtained by the Gaia mission. Using the so-called photometric and spectroscopic techniques, we measure the atmospheric and physical parameters of each object in our sample ($T_{\rm eff}$, $\log g$, H/He, Ca/He, $R$, $M$), and compare the values obtained from both techniques in order to assess the precision and accuracy of each method. We then explore in great detail the surface gravity, stellar mass, and hydrogen abundance distributions of DB white dwarfs as a function of effective temperature. We present some clear evidence for a large population of unresolved double degenerate binaries composed of DB+DB and even DB+DA white dwarfs. In the light of our results, we finally discuss the spectral evolution of DB white dwarfs, in particular the evolution of the DB-to-DA ratio as a function of $T_{\rm eff}$, and we revisit the question of the origin of hydrogen in DBA white dwarfs.
Figures

Figures from the paper (22 more)






Forward citations
Cited by 1 Pith paper
-
First planetesimals from DESI DR1: 12 highly metal-rich white dwarfs
Twelve white dwarfs from DESI DR1 have accreted debris resembling inner-Solar-System rock, with two systems likely accreting water-rich planetesimals.
Reference graph
Works this paper leans on
-
[1]
Abazajian, K., Adelman-McCarthy, J. K., Agüeros, M. A., et al. 2003, AJ, 126, 2081
work page 2003
-
[2]
Liebert, J., & Saffer, R. A. 1996, in Astronomical Society of the Pacific Conference
work page 1996
-
[3]
96, Hydrogen Deficient Stars, ed
Series, Vol. 96, Hydrogen Deficient Stars, ed. C. S. Jeffery & U. Heber, 295 Bédard, A., Bergeron, P., & Fontaine, G. 2017, ApJ, 848, 11
work page 2017
-
[4]
2019, arXiv e-prints, arXiv:1904.02022
Bergeron, P., Dufour, P., Fontaine, G., et al. 2019, arXiv e-prints, arXiv:1904.02022
arXiv 2019
-
[5]
T., & Leggett, S
Bergeron, P., Ruiz, M. T., & Leggett, S. K. 1997, ApJS, 108, 339
1997
- [6]
-
[7]
2011, ApJ, 737, 28
Bergeron, P., Wesemael, F., Dufour, P., et al. 2011, ApJ, 737, 28
2011
- [8]
Show all 45 references
-
[9]
1976, A&AS, 23, 147
Deridder, G., & van Rensbergen, W. 1976, A&AS, 23, 147
1976
-
[10]
D., & Behara, N
Dufour, P., Fontaine, G., Liebert, J., Schmidt, G. D., & Behara, N. 2008, ApJ, 683, 978
2008
-
[11]
2007, Nature, 450, 522
Dufour, P., Liebert, J., Fontaine, G., & Behara, N. 2007, Nature, 450, 522
2007
-
[12]
H., & Clemens, J
Dunlap, B. H., & Clemens, J. C. 2015, in Astronomical Society of the Pacific Conference
2015
-
[13]
El-Badry, K., Rix, H.-W., & Weisz, D. R. 2018, ApJL, 860, L17
2018
-
[14]
2016, MNRAS, 463, 3186
Farihi, J., Koester, D., Zuckerman, B., et al. 2016, MNRAS, 463, 3186
2016
-
[15]
Ferrario, L., de Martino, D., & Gänsicke, B. T. 2015, SSRv, 191, 111
2015
-
[16]
2001, PASP, 113, 409
Fontaine, G., Brassard, P., & Bergeron, P. 2001, PASP, 113, 409
2001
-
[17]
1987, in IAU Colloq
Fontaine, G., & Wesemael, F. 1987, in IAU Colloq. 95: Second Conference on Faint Blue Stars, ed. A. G. D. Philip, D. S. Hayes, & J. W. Liebert, 319–326 Gaia Collaboration, Brown, A. G. A., Vallenari, A., et al. 2018, A&A, 616, A1
1987
-
[18]
2014, ApJ, 796, 128
Genest-Beaulieu, C., & Bergeron, P. 2014, ApJ, 796, 128
2014
-
[19]
2017, in 20th European White Dwarf Workshop, ed
Genest-Beaulieu, C., & Bergeron, P. 2017, in 20th European White Dwarf Workshop, ed. P. E
2017
-
[20]
Gaensicke, & T
Tremblay, B. Gaensicke, & T. Marsh, Vol. 509, 201 —. 2019, ApJ, 871, 169 Gentile Fusillo, N. P., Gänsicke, B. T., Farihi, J., et al. 2017, MNRAS, 468, 971 Gentile Fusillo, N. P., Tremblay, P.-E., Gänsicke, B. T., et al. 2019, MNRAS, 482, 4570
2019
-
[21]
Gianninas, A., Bergeron, P., & Ruiz, M. T. 2011, ApJ, 743, 138 60 Genest-Beaulieu & Bergeron
2011
-
[22]
C., Munn, J
Harris, H. C., Munn, J. A., Kilic, M., et al. 2006, AJ, 131, 571
2006
-
[23]
1990, ApJ, 353, 215
Iben, Jr., I. 1990, ApJ, 353, 215
1990
-
[24]
O., Pelisoli, I., Koester, D., et al
Kepler, S. O., Pelisoli, I., Koester, D., et al. 2015, MNRAS, 446, 4078 —. 2016, MNRAS, 455, 3413
2015
-
[25]
2018, MNRAS, 479, L113
Genest-Beaulieu, C., & Rowell, N. 2018, MNRAS, 479, L113
2018
-
[26]
J., Kepler, S
Kleinman, S. J., Kepler, S. O., Koester, D., et al. 2013, ApJS, 204, 5
2013
-
[27]
Koester, D., & Kepler, S. O. 2015, A&A, 583, A86
2015
-
[28]
2009, A&A, 505, 441
Koester, D., Voss, B., Napiwotzki, R., et al. 2009, A&A, 505, 441
2009
-
[29]
1988, Publications of the Astronomical Society of the Pacific, 100, 1302
Liebert, J. 1988, Publications of the Astronomical Society of the Pacific, 100, 1302
1988
-
[30]
Liebert, J., Bergeron, P., & Holberg, J. B. 2005, ApJS, 156, 47
2005
-
[31]
J., et al
Liebert, J., Wesemael, F., Hansen, C. J., et al. 1986, ApJ, 309, 241
1986
-
[32]
2010, ApJ, 714, 1037
Limoges, M.-M., & Bergeron, P. 2010, ApJ, 714, 1037
2010
-
[33]
M., Bergeron, P., & Dufour, P
Limoges, M. M., Bergeron, P., & Dufour, P. 2009, ApJ, 696, 1461
2009
-
[34]
1991, ApJ, 371, 719
MacDonald, J., & Vennes, S. 1991, ApJ, 371, 719
1991
-
[35]
M., Bergeron, P., & Green, E
Manseau, P. M., Bergeron, P., & Green, E. M. 2016, ApJ, 833, 127
2016
-
[36]
P., & Sion, E
McCook, G. P., & Sion, E. M. 1999, The Astrophysical Journal Supplement Series, 121, 1
1999
-
[37]
1986, ApJ, 307, 242
Pelletier, C., Fontaine, G., Wesemael, F., Michaud, G., & Wegner, G. 1986, ApJ, 307, 242
1986
-
[38]
T., Koester, D., et al
Raddi, R., Gänsicke, B. T., Koester, D., et al. 2015, MNRAS, 450, 2083
2015
-
[39]
2018, ApJ, 857, 56
Rolland, B., Bergeron, P., & Fontaine, G. 2018, ApJ, 857, 56
2018
-
[40]
2011, ApJ, 730, 128
Tremblay, P.-E., Bergeron, P., & Gianninas, A. 2011, ApJ, 730, 128
2011
-
[41]
E., Cukanovaite, E., Gentile Fusillo, N
Tremblay, P. E., Cukanovaite, E., Gentile Fusillo, N. P., Cunningham, T., & Hollands, M. A. 2019, MNRAS, 482, 5222
2019
-
[42]
1955, Physik der Sternatmospharen, MIT besonderer Berucksichtigung der Sonne
Unsold, A. 1955, Physik der Sternatmospharen, MIT besonderer Berucksichtigung der Sonne
1955
-
[43]
Veras, D., Shannon, A., & Gänsicke, B. T. 2014, MNRAS, 445, 4175
2014
-
[44]
2007, A&A, 470, 1079
Voss, B., Koester, D., Napiwotzki, R., Christlieb, N., & Reimers, D. 2007, A&A, 470, 1079
2007
-
[45]
2006, PASP, 118, 183
Werner, K., & Herwig, F. 2006, PASP, 118, 183
2006
Reviewed August 14, 2026 · model on record in the stance chip above.
Discussion (0). Continue with ORCID to comment.