REVIEW 3 major objections 5 minor 21 references
Search for Point-Like TeV Sources in the Large Magellanic Cloud
T0 review · 3 major / 5 minor · reviewed 2026-08-14 · deepseek-v4-flash
Pith's one-line read A 280-hour survey of the Large Magellanic Cloud reveals no new point-like TeV gamma-ray sources, and rules out any as bright as the pulsar wind nebula N 157B in the well-exposed sky.
desk verdict Careful proceedings paper with a genuinely useful LMC-wide TeV source census; the main exclusion claim is credible but rests on a single spectral-index assumption that deserves a stress test. read the letter →
The pith
A machine-rendered reading of the paper's core claim, the machinery that carries it, and where it could break.
The reading
What carries the argument
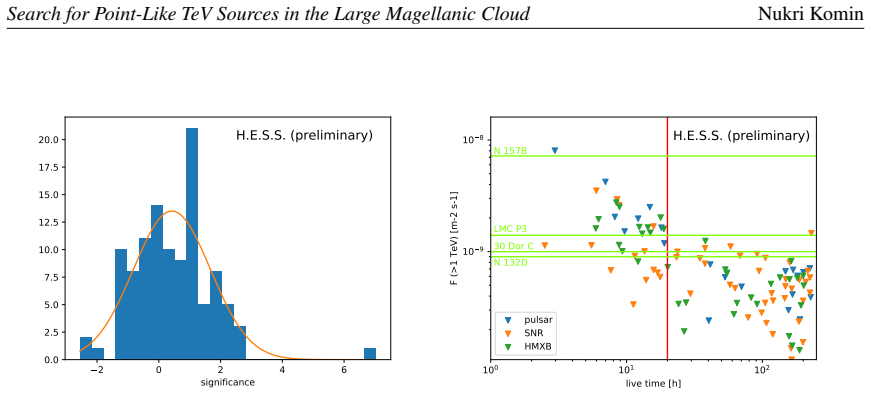
The load-bearing mechanism is a grid of 95% confidence upper limits on the 1-10 TeV photon flux at every catalogued source position, computed against a ring-estimated background and assuming a photon spectral index of -2.3. These limits are compared with the measured flux levels of the four known sources as a function of exposure time. Because the LMC exposure is inhomogeneous, from about 220 hours around the Tarantula Nebula down to 5 hours in the outer parts, the sensitivity is expressed versus live time; this shows that beyond roughly 20 hours, additional exposure gives only marginal improvement in the upper limits. The same exposure comparison defines the 20-hour threshold above which the fainter known-source flux levels can be excluded.
What would settle it
Recompute the upper limits for a candidate source using its actual photon index; if any catalogued object in a region with more than 20 hours of exposure has a 95% confidence 1-10 TeV flux at or above the level of 30 Dor C, N 132D, or LMC P3, the completeness claim is false. A pointed observation that discovers a point-like TeV source in a well-exposed area at the flux of N 157B would also falsify it.
Extended reading notes
Core claim
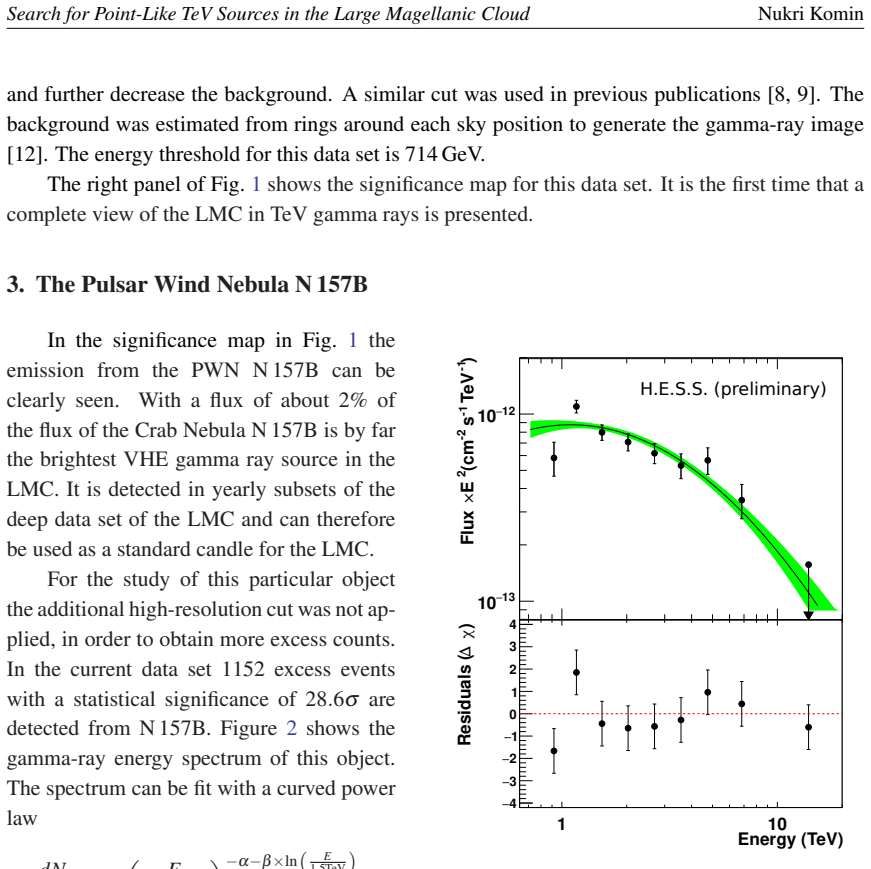
Using 280 hours of exposure with the H.E.S.S. telescopes, the collaboration searched the Large Magellanic Cloud for point-like sources of very-high-energy gamma rays and detected only the four previously known sources: the pulsar wind nebula N 157B, the superbubble 30 Dor C, the supernova remnant N 132D, and the gamma-ray binary LMC P3. No new significant emission is found. From flux upper limits computed at the positions of catalogued pulsars, supernova remnants, and high-mass X-ray binaries, the paper concludes that further sources with flux levels similar to N 157B can be excluded, and that where the exposure time exceeds 20 hours, sources at the flux level of 30 Dor C, N 132D, or LMC P3 can also be excluded. It further reports that the spectrum of N 157B is better described by a curved power law than a simple power law, with the curvature preferred at 4.4 sigma.
Load-bearing premise
Every upper limit assumes all undetected sources radiate with the same spectral shape, a photon index of -2.3, so a source with a different spectral shape could be brighter in the 1-10 TeV band than the stated limit while still evading detection.
Editorial extensions
If this is right
- Extending exposure beyond 20 hours in a region already covered that deeply adds almost no point-source sensitivity, so the route to new discoveries is to raise the whole galaxy to at least 20 hours of exposure rather than deepen existing fields.
- None of the catalogued pulsars outside N 157B shows TeV emission; in particular, the rapidly spinning-down pulsar J0540-6919 would have an extremely low gamma-ray efficiency if it emits at TeV energies at all.
- The upper limits imply that no catalogued supernova remnant in the LMC emits 1-10 TeV gamma rays at the level of N 132D, which translates to a limit on protons above about 10 TeV carrying roughly 10% of a canonical 10^51 erg explosion energy for an assumed ambient density of 1 cm^-3.
- No catalogued high-mass X-ray binary reaches the average flux of LMC P3, but because LMC P3 emits only during at most 20% of its orbit, a search for phase-dependent emission from binaries remains a live discovery channel.
- The spectrum of N 157B is curved rather than a simple power law, with curvature preferred at 4.4 sigma, which begins to constrain the particle acceleration and cooling physics inside the pulsar wind nebula.
Reading between the lines
- One step beyond this paper would be to recompute the upper limits for each candidate using spectral indices drawn from lower-energy gamma-ray or multiwavelength data, since the assumed -2.3 index could move the completeness boundary for the hardest or softest sources.
- If the galaxy really is complete to the N 157B flux level across its well-exposed face, the sparse count of TeV sources in the LMC compared with the Milky Way's plane could serve as a test of how star-formation environment and metallicity shape the most luminous particle accelerators.
- The 20-hour coverage threshold could serve as a design target for future wide-field Cherenkov observatories: surveying the entire LMC at that depth would make the completeness statement uniform across the galaxy.
- The proton-energy limits quoted for supernova remnants cover only protons above about 10 TeV; pairing them with GeV measurements of the same remnants could separate hadronic from leptonic emission and give a direct cosmic-ray energy budget.
Signed reviews
Editorial analysis
A structured set of objections, weighed in public.
Referee Report
Summary. The paper reports a search for point-like TeV gamma-ray sources in the Large Magellanic Cloud (LMC) using 280 hours of H.E.S.S. observations. The analysis confirms the four previously known sources (N 157B, 30 Dor C, N 132D, LMC P3) and finds no new significant emission. Upper limits on the 1-10 TeV photon flux at 95% confidence are derived for cataloged pulsars, supernova remnants, and high-mass X-ray binaries, assuming a photon spectral index of -2.3. The central claim is that sources with flux levels similar to N 157B can be excluded for a large part of the LMC, and that sources at the level of 30 Dor C, N 132D, or LMC P3 can be excluded where the exposure exceeds 20 hours. The paper also reports a curved spectrum for N 157B, with a 4.4-sigma preference over a simple power law.
Significance. If the exclusion claim holds, this is the first VHE gamma-ray census of an external galaxy down to a comparable luminosity, establishing that the known four sources are the only TeV emitters in the LMC at these flux levels in the well-exposed regions. The measurement of spectral curvature in N 157B is also scientifically valuable, given its role as a standard candle for LMC observations. The paper is transparent about its preliminary status and the v2 correction of the upper limits, which is commendable. However, the central claim is conditional on an assumed spectral index that is not varied or justified, and the significance distribution of the catalog objects deviates from the expected null distribution; these issues need to be addressed before the exclusion statement is fully supported.
major comments (3)
- [Section 4, left panel of Fig. 3] The 95% upper limits on the 1-10 TeV photon flux and the exclusion statement are computed for an assumed photon spectral index of -2.3. That choice is neither fitted nor justified from the data, and no sensitivity test is presented. Because the energy threshold is 714 GeV, the conversion from the observed count upper limits to the 1-10 TeV band depends on the assumed spectrum: for a harder source spectrum a smaller fraction of the counted photons lies below 1 TeV, so the same count limit corresponds to a larger 1-10 TeV flux limit. Since the SNR upper limits are stated to be 'of the order of the flux of N 132D' and the HMXB limits are of the order of the LMC P3 flux, a spectral-index correction of tens of percent could move the limits above the comparison fluxes and invalidate the exclusion claim. The paper should either fit the index from the data, justify it from known LMC source spectra, or explicitly show how the upper limits and the exclusion statements change for a plausible range of indices (for example -2.0 to -2.6).
- [Section 4, left panel of Fig. 3] The significance distribution of the catalog objects (after removing the known sources) is fit by a Gaussian with mean 0.4 and standard deviation 1.2, rather than the expected mean 0 and width 1. The paper does not discuss this discrepancy. A shifted or widened null distribution indicates that the background model is not perfectly describing the data, which can bias the 95% confidence upper limits derived from the same counts. The authors should identify the cause of the excess width or offset (e.g., residual source spill-over, systematic uncertainties in the ring background) and quantify how the empirical null distribution affects the quoted upper limits, for instance by recomputing the limits using the measured mean and width as a calibration.
- [Abstract and Section 4] The abstract and Section 4 state that for a large part of the LMC the existence of VHE gamma-ray sources with a luminosity similar to the known sources can be excluded. However, the numerical upper limits are derived only for cataloged pulsars, SNRs, and HMXBs; the blind search yields a significance map but no position-dependent flux sensitivity map. Without such a map, or an explicit calculation of the detection threshold for an assumed point-source spectrum as a function of exposure, the global exclusion claim for unlisted sources does not strictly follow from the presented material. Please clarify whether the exclusion applies only to cataloged objects or to the entire observed field, and if the latter, provide the corresponding sensitivity map or a quantitative statement of the point-source detection threshold in the 20-hour-exposure region.
minor comments (5)
- [Section 1] There is a typo in the first paragraph: 'H.E.S.S.has observed' is missing a space; it should read 'H.E.S.S. has observed'.
- [Figure 3 caption] The right panel of Fig. 3 uses 'live time [h]' while the text consistently uses 'exposure time'; please harmonize the terminology.
- [Table 1] The column headers in Table 1 are not fully aligned with the data columns, and the last column 'PSR eff' lacks a unit or a definition; please clarify what 'eff' represents and how it is computed.
- [Section 4] The statement that 'for more than 20 h exposure only marginal improvement of the upper limits can be achieved' is not supported by a quantitative fit or a reference to a known scaling; a short quantitative illustration would strengthen this point.
- [Acknowledgements] The acknowledgements contain encoding artifacts (for example 'Ã˘a' and 'Ãl'') that should be corrected in the final version.
Circularity Check
No significant circularity: the upper limits are direct count-based measurements under an explicit spectral assumption, and the comparison fluxes are independent published results.
full rationale
The paper's central exclusion claims follow from gamma-ray count upper limits computed at catalog source positions, not from any quantity fitted to the targets being excluded. The only assumed spectral parameter, -2.3, is stated explicitly in Section 4 and is not fitted from the data, nor is it defined in terms of the claimed exclusions. The green comparison flux levels for N 157B, 30 Dor C, N 132D, and LMC P3 are taken from earlier H.E.S.S. publications ([8] and [9]) as external benchmarks, not derived from the current upper-limit procedure. The N 157B spectrum fitted in Section 3 is a source measurement and is not used as an input to the upper-limit calculation or to the statement that other sources at that flux level can be excluded. Thus no equation or fitted parameter reduces by construction to the claimed conclusion. The fixed spectral-index assumption is a legitimate robustness and correctness concern, not a circularity, because it is an explicit modeling choice rather than a concealed reuse of the target result.
Assumptions & free parameters
free parameters (2)
- Assumed photon spectral index =
-2.3
- Assumed ambient target density =
1 cm^-3
assumptions (2)
- domain assumption Validity of the H.E.S.S. Model analysis and ring background subtraction
- domain assumption Adopted LMC distance of 50 kpc
Cite this review
Pith. "Pith review of Search for Point-Like TeV Sources in the Large Magellanic Cloud." pith.science (2026). https://pith.science/paper/A73QW57T
@misc{pith2026190804656,
  author       = {Pith},
  title        = {Pith review of: Search for Point-Like TeV Sources in the Large Magellanic Cloud},
  year         = {2026},
  howpublished = {\url{https://pith.science/paper/A73QW57T}},
  note         = {Machine review of arXiv:1908.04656}
}
read the original abstract
The Large Magellanic Cloud (LMC) is an irregular satellite galaxy of the Milky Way, which has been observed extensively in Very-High-Energy (VHE) gamma rays with the H.E.S.S. telescopes since 2004 and reaches now a total observation time of 280 h. The exposure of the LMC is rather inhomogeneous, the region around the Tarantula Nebula having an exposure of up to 220 h while the exposure in the outer parts of the LMC is as low as 5h. A search for point-like sources was performed on this data set. This search resulted in the detection of the four already known sources (N 157B, N 132D, 30 Dor C and LMC P3) but no further significant emission was revealed. Based on catalogues of pulsars, supernova remnants and high-mass X-ray binaries upper limits on the gamma-ray flux of these objects were derived. In this talk updated results on the known gamma-ray sources as well as upper limits on the non-detected objects will be presented. It will be shown that for a large part of the LMC the existence of VHE gamma-ray sources with a similar luminosity as the already known sources can be excluded.
Figures

Reference graph
Works this paper leans on
-
[1]
P. J. McMillan. In: MNRAS 414 (July 2011), pp. 2446–2457
work page 2011
- [2]
- [3]
-
[4]
R. N. Manchester et al. In: AJ 129 (Apr. 2005), pp. 1993–2006
work page 2005
-
[5]
J. P. Ridley et al. In: MNRAS 433.1 (May 2013), pp. 138–146. ISSN : 0035-8711
work page 2013
-
[6]
Q. Z. Liu, J. van Paradijs, and E. P. J. van den Heuvel. In: A&A 442.3 (Nov. 2005), pp. 1135– 1138
work page 2005
-
[7]
H. E. S. S. Collaboration. In: A&A 545, L2 (Sept. 2012), p. L2
work page 2012
-
[8]
H. E. S. S. Collaboration. In: Science 347.6220 (Jan. 2015), pp. 406–412
work page 2015
Show all 21 references
-
[9]
In: A&A 610, L17 (Mar
HESS Collaboration. In: A&A 610, L17 (Mar. 2018), p. L17
2018
-
[10]
Mellinger
A. Mellinger. In: PASP 121 (Nov. 2009), p. 1180
2009
-
[11]
In: Astroparticle Physics 32.5 (Dec
Mathieu de Naurois and LoÄ ´sÌ´Lc Rolland. In: Astroparticle Physics 32.5 (Dec. 2009), pp. 231–252
2009
-
[12]
Berge, S
D. Berge, S. Funk, and J. Hinton. In: A&A 466.3 (May 2007), pp. 1219–1229
2007
-
[13]
H. E. S. S. Collaboration. In: A&A 612, A1 (Apr. 2018), A1
2018
-
[14]
H. E. S. S. Collaboration. In: A&A 612, A2 (Apr. 2018), A2
2018
-
[15]
In: Science 334.6052 (Oct
VERITAS Collaboration. In: Science 334.6052 (Oct. 2011), p. 69
2011
-
[16]
In: A&A 585, A133 (Jan
MAGIC Collaboration. In: A&A 585, A133 (Jan. 2016), A133
2016
-
[17]
H. E. S. S. Collaboration. In: A&A 620, A66 (Dec. 2018), A66
2018
-
[18]
de OÃ ´sa Wilhelmi
E. de OÃ ´sa Wilhelmi. In: High-Energy Emission from Pulsars and their Systems . Ed. by D. F. Torres and N. Rea. 2011, pp. 435–452
2011
-
[19]
In: Science 350.6262 (2015), pp
Fermi/LAT Collaboration. In: Science 350.6262 (2015), pp. 801–805. ISSN : 0036-8075
2015
-
[20]
Frank, A
J. Frank, A. King, and D. Raine. 1992
1992
-
[21]
Martin et al
P. Martin et al. In: Science with the Cherenkov Telescope Array. Edited by CTA Consortium. Published by World Scientific Publishing Co. Pte. Ltd., 2019. ISBN #9789813270091, pp. 125-141. 2019, pp. 125–141. 7
2019
Reviewed August 14, 2026 · model on record in the stance chip above.
Discussion (0). Continue with ORCID to comment.