REVIEW 3 major objections 5 minor 20 references
The chemical yields of stars in the range 9-15 Msun
T0 review · 3 major / 5 minor · reviewed 2026-08-07 · deepseek-v4-flash
Pith's one-line read Stars from roughly 9 to 13 solar masses contribute negligibly to the average chemical enrichment of a generation of massive stars, even though their yields decline steeply with mass and their individual models remain essential for…
desk verdict Valuable new low-mass CCSN yields, but the 'negligible' IMF claim is softer than the abstract implies because the factor-of-2 criterion still allows ~40% contributions from the 9-13 Msun bin for flat-yield isotopes. read the letter →
The pith
A machine-rendered reading of the paper's core claim, the machinery that carries it, and where it could break.
The reading
What carries the argument
The argument is carried by a grid of six presupernova models recomputed with the same stellar evolution input as the preceding study but with a 335-isotope nuclear network, coupled to explosive nucleosynthesis from the HYPERION thermal-bomb code. The explosion is induced by depositing thermal energy at the base of the ejecta, tuned to yield about $10^{51}$ erg of kinetic energy, with the mass cut, the boundary between the remnant and the ejecta, fixed by an adopted initial-mass versus ejected-$^{56}$Ni relation taken from three-dimensional supernova simulations. The decisive quantitative step is the comparison of yields averaged over a Salpeter IMF in the mass ranges 9.22-120 $M_\odot$ and 13-120 $M_\odot$, which is what demonstrates the negligible contribution of the low-mass end. A secondary mechanism affects the shape of the trend: the second dredge-up in the 9.22 $M_\odot$ model shrinks the helium core and makes the presupernova density gradient nearly vertical between the 10 and 9.22 $M_\odot$ models, which alters shock propagation and the innermost explosive yields.
What would settle it
A secure observation of a roughly 9 to 11 solar-mass supernova progenitor whose ejected material contains as much oxygen, neon, or magnesium as a 15 solar-mass model would contradict the claimed steep decline in yields with decreasing mass. Alternatively, if realistic explosion simulations showed that 9.22 to 12 solar-mass stars fail to explode, the averaged yields of this mass range would drop to zero, and the negligible-contribution conclusion would need to be replaced by a black-hole formation budget.
Extended reading notes
Core claim
The paper claims that the lowest-mass core-collapse supernova progenitors are chemically negligible in bulk but individually diagnostic. Comparing the IMF-averaged ejecta of a generation of 9.22 to 120 solar-mass stars with the average over just 13 to 120 solar masses, it finds that the 9.22 to 13 solar-mass stars change the yield of essentially every isotope by less than the factor-of-two uncertainty band. It also finds that the alpha-element yields, carbon through calcium, decline by more than an order of magnitude from 15 down to 9.22 solar masses, and that the weak-s component from gallium to zirconium decreases nearly linearly with mass, with the more neutron-rich isotopes underproduced. Because of this steep decline, linearly extrapolating yields from more massive stars down to this range would substantially overestimate the true yields. The authors nevertheless emphasize that these models can be used to interpret individual supernovae, and they show that ratios of some odd-Z to even-Z elements in the ejecta may identify a low-mass progenitor.
Load-bearing premise
The paper assumes that every star in the grid, including the 9.22 and 10 solar-mass stars, actually explodes as a supernova rather than collapsing quietly into a black hole; if any of them fails to explode, its yields vanish and the averaged contribution changes.
Editorial extensions
If this is right
- Galactic chemical evolution models can omit the 9.22 to 13 $M_\odot$ stars from IMF-averaged yields without changing the predicted isotope pattern beyond the quoted factor of about two.
- Log-linear extrapolations of yields from more massive stars down to the 9 to 13 $M_\odot$ range overestimate most element yields, so the actual model yields are needed for accurate enrichment histories.
- The contrasting behaviour of even-Z and odd-Z elements, for example sodium, aluminium, and phosphorus versus nitrogen, fluorine, potassium, and scandium, gives a spectroscopic way to identify a low-mass core-collapse supernova progenitor.
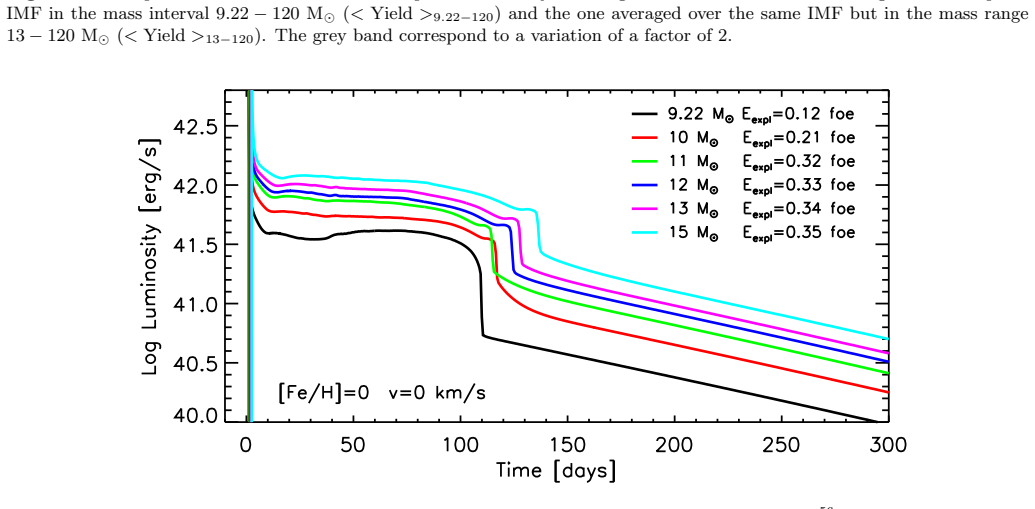
- The models predict plateau light curves with luminosity $\log(L/L_\odot)\sim 41.5$ to $42.1$ at 30 days and plateau durations of roughly 110 to 140 days, with a non-monotonic mass dependence caused by the adopted explosion-energy relation.
- The 13 and 15 $M_\odot$ yields for neon, magnesium, and aluminium differ from earlier published values because the new models suppress convective breathing pulses and therefore retain more $^{12}$C in the helium-exhausted core.
Reading between the lines
- If some 9 to 12 $M_\odot$ progenitors actually collapse to black holes rather than exploding, the negligible-contribution result would become stronger for IMF-averaged chemistry, but the individual-supernova interpretation would lose those cases.
- The near-vertical density jump between the 10 and 9.22 $M_\odot$ models marks a sensitive boundary: modest changes in convective overshooting or mass loss could shift which stars explode, and the averaged yield budget would change at the margin.
- The mass-cut prescription, adopting an ejected-$^{56}$Ni versus initial-mass relation, is a modelling choice; the authors state that the data for alternative mass cuts are available, so the robustness of the negligible-contribution conclusion could be tested directly.
- Rotation, which the authors flag for future work, could enlarge stellar cores and move the mass range that dominates enrichment downward, potentially making the low-mass yields non-negligible.
Editorial analysis
A structured set of objections, weighed in public.
Referee Report
Summary. The paper computes hydrostatic and explosive nucleosynthesis for non-rotating, solar-metallicity stars with initial masses 9.22, 10, 11, 12, 13, and 15 Msun, using the FRANEC stellar evolution code with a 335-isotope network and the HYPERION thermal-bomb explosion code. The mass cut is calibrated by the external initial-mass--ejected-56Ni relation of Burrows et al. (2024), and the same relation together with the Burrows et al. explosion-energy relation is used to compute bolometric light curves. The main results are: (1) alpha-element yields decrease steeply with decreasing mass below about 15 Msun; (2) weak-s yields decrease almost linearly in a log sense; and (3) IMF-averaged yields over 9.22-120 Msun and over 13-120 Msun agree within a factor of about 2, which the authors interpret as a negligible contribution from 9.22-13 Msun stars. The paper also compares isotopic ejecta to solar composition and discusses differences from the earlier Limongi & Chieffi (2018) yields caused by the inhibition of breathing pulses.
Significance. If the models are correct, this yield grid fills an important mass range for galactic chemical evolution studies, and the light-curve predictions provide a useful interpretive tool for low-mass core-collapse supernovae. The paper has clear strengths: the codes and input physics are documented, the 56Ni-mass cut is tied to an external 3D simulation result rather than fitted to the paper's own yields, detailed isotopic yield tables are provided, and the authors are transparent about the breathing-pulse treatment and about differences from earlier calculations. However, the central claim that 9.22-13 Msun stars contribute negligibly to IMF-averaged yields is not supported by the factor-of-2 test as stated, because several isotopes have nearly mass-independent yields. With a revised, quantitative definition of 'negligible' and an explicit per-isotope accounting, the paper would be a solid and useful contribution.
major comments (3)
- [Section 4, Figure 11, and Table 2] The central claim stated in the abstract and in Section 4, that the 9.22-13 Msun contribution to IMF-averaged yields is negligible for essentially all isotopes, is not established by the test used in Figure 11. The text defines 'negligible' as agreement between <Yield>_{9.22-120} and <Yield>_{13-120} within a factor of about 2, but for an isotope whose yield is independent of initial mass, a Salpeter IMF places about 38% of the stars in the 9.22-13 Msun bin, so that bin contributes about 38% of the total 9.22-120 Msun yield and the ratio <Yield>_{9.22-120}/<Yield>_{13-120} is about 1.6, which passes the stated criterion. Table 2 shows that this flat-yield situation is realized for several isotopes: 13C varies only from 4.37e-4 to 7.29e-4 Msun, 17O from 5.41e-5 to 5.73e-5, 15N from 5.28e-6 to 7.38e-6, and 19F from 3.22e-6 to 4.19e-6 across the 9.22-15 Msun grid. For these isotopes the 9.22-13 Msun contribution is therefore not negligible, and the phrase 'essentially all the isotopes' overstates what the test supports. Please replace the factor-of-2 comparison with explicit fractional contributions per isotope, or qualify the claim accordingly.
- [Section 1 and Section 5] The paper assumes in Section 1 that all stars with M >= 9.22 Msun 'eventually explode as core collapse supernovae' and uses that assumption for every yield calculation and for the light curves in Section 5. The possibility that some of these progenitors, particularly in the 9-11 Msun range, might instead collapse to black holes is not discussed in the context of the yields. If any of these models fail to explode, their yields vanish and their predicted light curves do not apply; the IMF-averaged 'negligible contribution' claim would be strengthened, but the individual yields and the statement that these models can interpret specific supernovae would need to be conditional. The manuscript should either justify the explosion assumption for these structures (for example with compactness or explodability criteria) or explicitly state that the yields and light curves are upper limits or conditional predictions under the assumed explosion, and discuss how that affects the abstract's claims.
- [Section 4, last paragraph] The inhibition of breathing pulses is justified by the Constantino et al. (2016) analysis of low-mass stars in globular clusters, but the models here are intermediate-mass stars of 9-15 Msun, and the paper does not discuss whether that conclusion transfers to this mass range. This choice changes the 12C abundance in the He-exhausted core and produces non-negligible differences in the C-burning products Ne, Mg, and Al relative to Limongi & Chieffi (2018), as the authors note. Because these elements are part of the yield grid, the systematic uncertainty introduced by the extrapolation should be quantified or at least discussed more explicitly, rather than presented as a settled modeling decision.
minor comments (5)
- [Section 2 heading] The heading reads 'NUCLEAR NUCLEAR NETWORK'; the duplicated word should be removed.
- [Abstract and text] There are several typographical errors, including 'inital' in the abstract, 'to to' in the abstract and Section 2, and 'calcutions' in the Table 3 caption.
- [Section 6] The numbered conclusions skip from item (10) to item (12); an item (11) appears to be missing or misnumbered.
- [Figure 6] The statement that observed element abundance ratios in a core-collapse supernova spectrum can be used to infer a low-mass progenitor is illustrated only schematically; adding a concrete example with a specific observed supernova would make the claim more useful and testable.
- [Section 5] The light-curve predictions depend on the assumed 56Ni mixing extent and the explosion-energy relation, and the paper notes this dependence; please state explicitly in the text that the plateau luminosities and durations in Figure 12 are not robust predictions but rather examples tied to these choices, which is already implied but would be clearer as an explicit caveat.
Circularity Check
No significant circularity: the mass cut and 56Ni masses are external inputs from Burrows et al. (2024), not fitted to the paper's own yields, and the light curves are forward models with stated input relations.
full rationale
The paper's load-bearing claims are computed quantities, not re-labeled inputs. The mass cut is fixed by the initial mass-ejected 56Ni relation from Burrows et al. (2024), and the 56Ni values in Table 2 are explicitly stated as assumed inputs rather than predicted outcomes. All other isotopic yields are obtained by running the hydrostatic and explosive nucleosynthesis network on the pre-supernova models, so they are not equal to the external inputs by construction. The light curves are conditional forward models: Section 5 plainly states that the explosion energy and ejected 56Ni relations are adopted from Burrows et al. (2024), and the paper notes that different parameter choices could be made to fit specific supernovae. Self-citations to FRANEC, HYPERION, Paper I, and Limongi & Chieffi (2018) are standard code and previous-publication references; the central claims about steep alpha-element yield decreases, weak-s trends, and the small 9.22-13 Msun IMF-averaged contribution are derived from the present grid rather than from those citations alone. The 'negligible' conclusion is a comparative statement based on the paper's own yields and prior published yields for higher masses, with a factor-of-2 tolerance explicitly stated as an assumption. Whether that tolerance is too loose for flat-yield isotopes is a statistical interpretation concern, not a circularity of the derivation. No equation in the paper reduces a predicted quantity to an input by construction, and no load-bearing argument depends on an unverified self-citation.
Assumptions & free parameters
free parameters (3)
- Ejected 56Ni mass (mass cut calibration) =
0.0104, 0.0195, 0.0292, 0.0355, 0.0417, 0.0542 Msun for 9.22, 10, 11, 12, 13, 15 Msun
- Explosion energy =
1.24, 2.13, 3.26, 3.33, 3.39, 3.52 x 10^50 erg for the six models
- 56Ni mixing extent =
mixed from inner edge of exploding mantle to about half of the H-rich envelope
assumptions (5)
- domain assumption The FRANEC stellar evolution code and HYPERION explosion code are reliable for this purpose.
- domain assumption Thermal bomb explosions are a valid proxy for real core-collapse supernova explosions.
- domain assumption Stars with initial mass 9.22-15 Msun all explode as CCSNe.
- domain assumption Breathing pulses should be inhibited following Constantino et al. (2016).
- domain assumption A Salpeter initial mass function is the appropriate averaging function.
Cite this review
Pith. "Pith review of The chemical yields of stars in the range 9-15 Msun." pith.science (2026). https://pith.science/paper/A7GQNRDC
@misc{pith2026250522030,
  author       = {Pith},
  title        = {Pith review of: The chemical yields of stars in the range 9-15 Msun},
  year         = {2026},
  howpublished = {\url{https://pith.science/paper/A7GQNRDC}},
  note         = {Machine review of arXiv:2505.22030}
}
read the original abstract
In Limongi et al. (2024) we presented and discussed the main evolutionary properties and final fate of stars in the mass range 7-15 Msun. The evolutions of those models were computed by means of a medium size nuclear network that guaranteed a proper calculation of the nuclear energy generation and hence a good modeling of the physical evolution of these stars. In the present paper, we extend this study by computing the detailed chemical yields of stars in the mass range 9-15 Msun, i.e., those stars that explode as core collapse supernovae (CCSNe). The explosive nucleosynthesis is then computed in the framework of the thermal bomb induced explosion by means of the HYPERION code (Limongi and Chieffi 2020). We find that: (1) the yields of the intermediate mass elements (i.e., O to P) show a steep decrease as the inital mass decreases; (2) the yields of s-weak component, i.e., those produced by the slow neutron captures from Ga to to the first neutron closure shell, decrease almost linearly as a function of the initial mass with respect to the ones produced by the more massive stars; (3) the global contribution of the stars in the mass range 9.22-13 Msun to the yields of a generation of massive stars averaged over a standard initial mass function is negligible for essentially all the isotopes. In spite of this, however, the models of stars in this mass range can be fundamental to interpret the observations of specific supernovae.
Figures


Figures from the paper (9 more)


Reference graph
Works this paper leans on
-
[1]
Boccioli, L., Roberti, L., Limongi, M., et al. 2023
work page 2023
- [2]
-
[3]
Castellani, V., Chieffi, A., Tornamb` e, A., et al. 1985, ApJ, 296, 204
work page 1985
- [4]
- [5]
- [6]
-
[7]
L., Gil-Pons, P., Siess, L., et al
Doherty, C. L., Gil-Pons, P., Siess, L., et al. 2017, PASA, 34
work page 2017
-
[8]
& Chieffi, A
Limongi, M. & Chieffi, A. 2003, ApJ, 592, 404
2003
Show all 20 references
-
[9]
& Chieffi, A
Limongi, M. & Chieffi, A. 2006, ApJ, 647, 483
2006
-
[10]
& Chieffi, A
Limongi, M. & Chieffi, A. 2012, ApJS, 199, 38
2012
-
[11]
2018, ApJS, 237, 131985, ApJ, 296, 204
Limongi, M., & Chieffi, A. 2018, ApJS, 237, 131985, ApJ, 296, 204
2018
-
[12]
& Chieffi, A
Limongi, M. & Chieffi, A. 2020, ApJ, 902, 95
2020
-
[13]
2024, ApJS, 270, 29
Limongi, M., Roberti, L., Chieffi, A., et al. 2024, ApJS, 270, 29
2024
-
[14]
1984, ApJ, 277, 791
Nomoto, K. 1984, ApJ, 277, 791
1984
-
[15]
1987, ApJ, 322, 206
Nomoto, K. 1987, ApJ, 322, 206
1987
-
[16]
2013, ARA&A, 51, 1, 457
Nomoto, K., Kobayashi, C., & Tominaga, N. 2013, ARA&A, 51, 1, 457
2013
-
[17]
D., et al
Rauscher, T., Heger, A., Hoffman, R. D., et al. 2002, ApJ, 576, 1
2002
-
[18]
2024, ApJS, 272, 15
Roberti, L., Limongi, M., & Chieffi, A. 2024, ApJS, 272, 15
2024
-
[19]
2024, ApJS, 270, 28
Roberti, L., Limongi, M., & Chieffi, A. 2024, ApJS, 270, 28
2024
-
[20]
1996, ApJ, 460, 408
Thielemann, F.-K., Nomoto, K., & Hashimoto, M.-A. 1996, ApJ, 460, 408
1996
Reviewed August 7, 2026 · model on record in the stance chip above.
Discussion (0). Continue with ORCID to comment.