REVIEW 33 references
Inverse Optimization with Kernel Regression: Application to the Power Forecasting and Bidding of a Fleet of Electric Vehicles
T0 review · reviewed 2026-08-14 · deepseek-v4-flash
Pith's one-line read A kernelized inverse-optimization approach forecasts EV-fleet charging and discharging power and derives market bid curves, outperforming support vector and ridge regression on synthetic case studies.
The pith
A machine-rendered reading of the paper's core claim, the machinery that carries it, and where it could break.
The reading
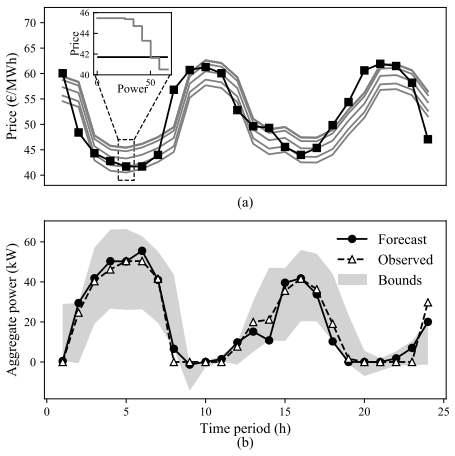
The authors test the method on synthetic data they generate from a more detailed simulator of one hundred electric vehicles, using travel patterns from a national survey and Spanish electricity prices. They compare it with support vector regression, kernel ridge regression, a linear inverse optimization variant, and naive benchmarks. The kernel-based inverse optimization method usually has lower forecast error than the linear variant and is comparable to or better than the machine learning baselines. It also produces a monotonically decreasing bid curve for each hour, which the plain forecasting methods cannot provide.
The main caveat is that all results come from simulated fleets. The simplified model that is learned ignores the battery state-of-charge dynamics that the simulator includes, and no confidence intervals are given for the reported error reductions.
Extended reading notes
Core claim
The central claim is that the proposed kernelized two-step inverse-optimization procedure can forecast the aggregate power of a price-responsive EV fleet with V2G capabilities and derive a market-compliant bid/offer curve, with accuracy comparable to or better than support vector regression and kernel ridge regression. The abstract states that the framework 'allows the aggregator to derive a bid/offer curve' and that the tests show benefits against the machine-learning techniques reported to exhibit the best forecasting performance. If true, an aggregator obtains both a forecast and a bidding curve from one model.
Load-bearing premise
The load-bearing modeling assumption is that the static linear program (1), with blockwise marginal utilities and time-varying power bounds, adequately represents the aggregate response of a real EV fleet to electricity prices. This assumption enters in Section 2.1 when (1) is introduced as the forward model. The fleet simulator in Appendix A includes intertemporal battery state-of-charge constraints (A.3), battery degradation (A.8), and charging/discharging efficiencies, none of which appear in the simplified forward LP. If real fleet behavior is dominated by these dynamics, the estimated bounds and marginal utilities will be misspecified and the forecast and bid curve will degrade.
Signed reviews
Editorial analysis
A structured set of objections, weighed in public.
Assumptions & free parameters
free parameters (5)
- H (feasibility penalty) =
0.64 (naive-ch), 0.82 (sync), 0.94 (non-sync)
- M (regularization weight) =
0.0002 (naive-ch), 0.0001 (sync), 0.002 (non-sync)
- gamma (Gaussian kernel width) =
0.1 or 0.01
- NB (number of energy blocks) =
6
- CS (synchronization penalty in the simulator) =
0, 520, or 52 e/MWh^2 depending on scenario
assumptions (5)
- domain assumption The static linear program (1) with blockwise marginal utilities and time-varying power bounds can represent the aggregate price response of an EV fleet with V2G capabilities.
- domain assumption Synthetic data from simulator (A.1)-(A.9), calibrated with NHTS travel patterns and one six-week Spanish price series, is a valid stand-in for real EV aggregator data.
- standard math Strong duality for the forward LP (1) holds at the estimated parameters, justifying the duality-gap formulation of the optimality problem.
- ad hoc to paper Gaussian kernel in the feasibility problem and linear kernel in the optimality problem is the right modeling choice.
- domain assumption The two-step feasibility-then-optimality procedure recovers parameters acceptably despite the split from the original bilevel problem.
Cite this review
Pith. "Pith review of Inverse Optimization with Kernel Regression: Application to the Power Forecasting and Bidding of a Fleet of Electric Vehicles." pith.science (2026). https://pith.science/paper/A7RKYRXJ
@misc{pith2026190800399,
  author       = {Pith},
  title        = {Pith review of: Inverse Optimization with Kernel Regression: Application to the Power Forecasting and Bidding of a Fleet of Electric Vehicles},
  year         = {2026},
  howpublished = {\url{https://pith.science/paper/A7RKYRXJ}},
  note         = {Machine review of arXiv:1908.00399}
}
read the original abstract
This paper considers an aggregator of Electric Vehicles (EVs) who aims to learn the aggregate power of his/her fleet while also participating in the electricity market. The proposed approach is based on a data-driven inverse optimization (IO) method, which is highly nonlinear. To overcome such a caveat, we use a two-step estimation procedure which requires solving two convex programs. Both programs depend on penalty parameters that can be adjusted by using grid search. In addition, we propose the use of kernel regression to account for the nonlinear relationship between the behaviour of the pool of EVs and the explanatory variables, i.e., the past electricity prices and EV fleet's driving patterns. Unlike any other forecasting method, the proposed IO framework also allows the aggregator to derive a bid/offer curve, i.e. the tuple of price-quantity to be submitted to the electricity market, according to the market rules. We show the benefits of the proposed method against the machine-learning techniques that are reported to exhibit the best forecasting performance for this application in the technical literature.
Figures


Figures from the paper (4 more)


Reference graph
Works this paper leans on
-
[1]
H., Kargarian, A., & Karabasoglu, O
Amini, M. H., Kargarian, A., & Karabasoglu, O. (2016). ARIMA-based decou- pled time series forecasting of electric vehicle charging demand for stochastic power system operation. Electric Power Systems Research , 140, 378–390
work page 2016
-
[2]
Arias, M. B., & Bae, S. (2016). Electric vehicle charging demand forecasting model based on big data technologies. Applied energy, 183, 327–339
work page 2016
-
[3]
Aswani, A., Shen, Z.-J., & Siddiq, A. (2018). Inverse optimization with noisy data. Operations Research, 66, 870–892
work page 2018
-
[4]
Bandpey, M. F., & Firouzjah, K. G. (2018). Two-stage charging strategy of plug-in electric vehicles based on fuzzy control. Computers & Operations Research, 96, 236–243. 28 Ben´ ıtez-Pe˜ na, S., Blanquero, R., Carrizosa, E., & Ram´ ırez-Cobo, P. (2019). Cost-sensitive feature selection for support vector machines. Computers & Operations Research, 106, 169–178
work page 2018
-
[5]
Bertsimas, D., Gupta, V., & Paschalidis, I. C. (2015). Data-driven estimation in equilibrium using inverse optimization. Math. Progr., 153, 595–633
work page 2015
-
[6]
Tattini, J., & Teter, J. (2018). Global EV Outlook 2018: Towards cross-modal electrification. Technical Report – International Energy Agency
work page 2018
-
[7]
Chan, T. C., & Kaw, N. (2019). Inverse optimization for the recovery of con- straint parameters. European Journal of Operational Research, . CPLEX (2019). IBM ILOG CPLEX Optimisation Studio. [Online]. Available: https://www.ibm.com/analytics/cplex-optimizer
work page 2019
-
[8]
Dudek, G. (2018). Probabilistic forecasting of electricity prices using kernel regression. In 2018 15th International Conference on the European Energy Market (EEM) (pp. 1–5). ENTSO-e (2019). European Network of Transmission System Operators (ENTSO-e). [Online]. Available: https://www.entsoe.eu/
work page 2018
Show all 33 references
-
[9]
M., Shafieezadeh-Abadeh, S., Hanasusanto, G
Esfahani, P. M., Shafieezadeh-Abadeh, S., Hanasusanto, G. A., & Kuhn, D. (2018). Data-driven inverse optimization with imperfect information. Math. Progr., 167, 191–234. European Commission (2011). White Paper: Roadmap to a Single European Transport Area – Towards a competi- ti...
2018
-
[10]
E., Watson, J
Hart, W. E., Watson, J. P., & Woodruff, D. L. (2011). Pyomo: Modeling and solving mathematical programs in Python. Mathematical Programming Computation, 3, 219–260. doi: 10.1007/s12532-011-0026-8 . 29
2011 doi
-
[11]
Hofmann, T., Sch¨ olkopf, B., & Smola, A. J. (2008). Kernel methods in machine learning. The annals of statistics , (pp. 1171–1220)
2008
-
[12]
Kekatos, V., Veeramachaneni, S., Light, M., & Giannakis, G. B. (2013). Day- ahead electricity market forecasting using kernels. In 2013 IEEE PES Inno- vative Smart Grid Technologies Conf. (ISGT) (pp. 1–5)
2013
-
[13]
Kekatos, V., Zhang, Y., & Giannakis, G. B. (2014). Electricity market forecast- ing via low-rank multi-kernel learning. IEEE Journal of Selected Topics in Signal Processing, 8, 1182–1193
2014
-
[14]
Kempton, W., & Tomi´ c, J. (2005). Vehicle-to-grid power fundamentals: Calcu- lating capacity and net revenue. Journal of power sources , 144, 268–279
2005
-
[15]
Korolko, N., Sahinoglu, Z., & Nikovski, D. (2015). Modeling and forecasting self-similar power load due to EV fast chargers. IEEE Transactions on Smart Grid, 7, 1620–1629
2015
-
[16]
Lu, T., Wang, Z., Wang, J., Ai, Q., & Wang, C. (2018). A data-driven stack- elberg market strategy for demand response-enabled distribution systems. IEEE Transactions on Smart Grid , 10, 2345–2357
2018
-
[17]
R., & Gadh, R
Majidpour, M., Qiu, C., Chu, P., Pota, H. R., & Gadh, R. (2016). Forecasting the EV charging load based on customer profile or station measurement? Applied energy, 163, 134–141. NHTS (2019). National Household Travel Survey (NHTS) data. [Online]. Avail- able: https://nhts.ornl....
2016
-
[18]
Ortega-Vazquez, M. A. (2014). Optimal scheduling of electric vehicle charg- ing and vehicle-to-grid services at household level including battery degrada- tion and price uncertainty. IET Generation, Transmission & Distribution , 8, 1007–1016. 30
2014
-
[19]
Blondel, M., Prettenhofer, P., Weiss, R., Dubourg, V., Vanderplas, J., Passos, A., Cournapeau, D., Brucher, M., Perrot, M., & Duchesnay, E. (2011). Scikit- learn: Machine learning in Python. Journal of Machine Learning Research , 12, 2825–2830. Renault (2019). Data Sheet Renau...
2011
-
[20]
R., & De Smet, Y
Roland, J., Figueira, J. R., & De Smet, Y. (2016). Finding compromise solutions in project portfolio selection with multiple experts by inverse optimization. Computers & Operations Research , 66, 12–19
2016
-
[21]
J., & Bertsimas, D
Ruiz, C., Conejo, A. J., & Bertsimas, D. J. (2013). Revealing rival marginal offer prices via inverse optimization. IEEE Transactions on Power Systems , 28, 3056–3064
2013
-
[22]
Saez-Gallego, J., & Morales, J. M. (2017). Short-term forecasting of price- responsive loads using inverse optimization. IEEE Transactions on Smart Grid, 9, 4805–4814
2017
-
[23]
M., Zugno, M., & Madsen, H
Saez-Gallego, J., Morales, J. M., Zugno, M., & Madsen, H. (2016). A data-driven bidding model for a cluster of price-responsive consumers of electricity. IEEE Transactions on Power Systems , 31, 5001–5011
2016
-
[24]
R., Ortega-Vazquez, M., Kirschen, D., & Zhang, B
Sarker, M. R., Ortega-Vazquez, M., Kirschen, D., & Zhang, B. (2016). Electric Vehicles as Grid Resources. Ph.D. thesis University of Washington Libraries
2016
-
[25]
Shahidehpour, M., Yamin, H., & Li, Z. (2003). Market operations in electric power systems: forecasting, scheduling, and risk management . John Wiley & Sons
2003
-
[26]
J., & Sch¨ olkopf, B
Smola, A. J., & Sch¨ olkopf, B. (2004). A tutorial on support vector regression. Statistics and computing , 14, 199–222. 31
2004
-
[27]
H., & Whitt, W
Sun, B., Sun, X., Tsang, D. H., & Whitt, W. (2019). Optimal battery purchasing and charging strategy at electric vehicle battery swap stations. European Journal of Operational Research, 279, 524–539
2019
-
[28]
Sun, Q., Liu, J., Rong, X., Zhang, M., Song, X., Bie, Z., & Ni, Z. (2016). Charging load forecasting of electric vehicle charging station based on support vector regression. In 2016 IEEE PES Asia-Pacific Power and Energy Eng. Conf. (APPEEC) (pp. 1777–1781)
2016
-
[29]
Trevor, H., Robert, T., & JH, F. (2009). The elements of statistical learning: data mining, inference, and prediction
2009
-
[30]
M., Hassan, A., & Jenkins, N
Xydas, E., Marmaras, C., Cipcigan, L. M., Hassan, A., & Jenkins, N. (2013). Forecasting electric vehicle charging demand using support vector machines. In 2013 48th International Universities’ Power Engineering Con- ference (UPEC) (pp. 1–6)
2013
-
[31]
Yang, J., & Sun, H. (2015). Battery swap station location-routing problem with capacitated electric vehicles. Computers & Operations Research, 55, 217–232
2015
-
[32]
Zhang, J., & Xu, C. (2010). Inverse optimization for linearly constrained convex separable programming problems. European Journal of Operational Research, 200, 671–679
2010
-
[33]
Zhou, Y., Wang, L., & McCalley, J. D. (2010). Effective incentives design for renewable energy generation expansion planning: An inverse optimization approach. In IEEE PES General Meeting (pp. 1–7). 32
2010
Reviewed August 14, 2026 · model on record in the stance chip above.
Discussion (0). Continue with ORCID to comment.