REVIEW 4 major objections 5 minor 34 references
Universal fluctuations in the bulk of Rayleigh-B\'enard turbulence
T0 review · 4 major / 5 minor · reviewed 2026-08-14 · deepseek-v4-flash
Pith's one-line read Once rescaled by the convective temperature, the rms temperature at the centre of turbulent convection is a constant ≈0.85 across more than seven decades in Rayleigh number.
desk verdict A careful empirical data-collapse paper that makes a solid case for θ* as the bulk temperature scale; the companion velocity claim is less secure because part of the normalization is borrowed from a global heat-flux correlation. read the letter →
The pith
A machine-rendered reading of the paper's core claim, the machinery that carries it, and where it could break.
The reading
What carries the argument
The load-bearing object is a pair of scales from a dimensional argument: $\theta_* \equiv Q_0^{2/3}/(\alpha g H)^{1/3}$ and $w_* \equiv (\alpha g H Q_0)^{1/3}$, where $Q_0$ is the specific heat flux, $\alpha$ the thermal expansion coefficient, $g$ gravity, and $H$ the cell height. These are the only combinations of the supposed bulk-control parameters $\alpha g$, $Q_0$, and $H$ with dimensions of temperature and velocity. The argument works because the paper rewrites them as $\theta_*/\Delta T = Nu^{2/3}/(Ra\,Pr)^{1/3}$ and $Re_{w_*} = w_* H/\nu = (Ra\,Nu\,Pr^{-2})^{1/3}$, so any dataset that reports global $Ra$, $Pr$, and $Nu$ can be rescaled without new local measurements.
What would settle it
In a $\Gamma\approx1$ cylindrical cell, measure $\sigma_T$ and $\sigma_w$ at the centre while simultaneously measuring $Nu$, over $10^8 \leq Ra \leq 10^{10}$, with at least two different plate roughness geometries; the central claim predicts $\sigma_{T,c}/\theta_*$ remains at $0.85$ within scatter and $\sigma_{w,c}/w_*$ follows $Ra^{0.07\pm0.02}$ regardless of roughness. A systematic shift of the temperature ratio with roughness height, a drift of either ratio with $Ra$ beyond the quoted uncertainty, or a velocity exponent outside $0.05$–$0.09$ would refute it.
Extended reading notes
Core claim
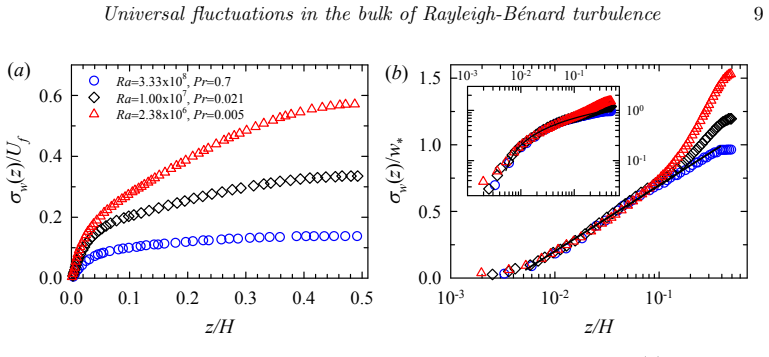
The central discovery is that in aspect-ratio-unity cylindrical cells the root-mean-square temperature fluctuation at the cell centre, normalized by the convective temperature $\theta_* \equiv Q_0^{2/3}/(\alpha g H)^{1/3}$, is a universal constant $\sigma_{T,c}/\theta_* \approx 0.85$ over $10^8 \leq Ra \leq 10^{15}$ and $0.7 \leq Pr \leq 23.34$, independent of whether the top and bottom plates are smooth or rough. The vertical rms velocity at the centre, normalized by $w_* \equiv (\alpha g H Q_0)^{1/3}$, is not exactly constant but scales as $\sigma_{w,c}/w_* \sim Ra^{0.07 \pm 0.02}$ over the measured range and is likewise independent of plate topography. Outside the thermal boundary layer, the centreline temperature profile $\sigma_T(z)/\theta_*$ follows a power law in the distance $z$ from the plate, with exponent about $-0.57$ in cylinders and $-0.74$ in cube and rectangular cells, while the vertical velocity profile $\sigma_w(z)/w_*$ is logarithmic in $z$. These collapses are presented as evidence that $\theta_*$ and $w_*$ are the physically appropriate characteristic scales for bulk fluctuations, with geometry-dependent prefactors reflecting the large-scale circulation.
Load-bearing premise
The load-bearing premise is that the bulk region outside the boundary layers is controlled solely by $\alpha g$, $Q_0$, and $H$, so the convective scales computed from global $Ra$, $Pr$, and $Nu$ correctly represent the core; for the three literature velocity sets without simultaneous $Nu$ measurements, this also depends on the empirical correlation $Nu = 0.14\,Ra^{0.297}Pr^{-0.03}$ being accurate for those runs.
Editorial extensions
If this is right
- The plateau $\sigma_{T,c}/\theta_* \approx 0.85$ means the core temperature fluctuation in a $\Gamma\approx 1$ cylinder can be predicted from $Ra$, $Pr$, and $Nu$ alone, without placing a probe in the cell.
- Since the plateau is the same for smooth and rough plates, the roughness-induced enhancement of $\sigma_T/\Delta T$ is an artefact of the wrong reference scale; $\theta_*$ absorbs the topography.
- The weak residual $\sigma_{w,c}/w_* \sim Ra^{0.07\pm0.02}$ indicates the velocity scale is only nearly universal, leaving a slow dynamical growth that future theories must explain.
- The power-law temperature profile with geometry-dependent exponent (about $-0.57$ in cylinders, $-0.74$ in cubes) ties the mixing-zone fluctuation structure to the shape of the large-scale circulation.
- At $Ra \gtrsim 10^{14}$, $\theta_*$-scaled temperature profiles divide into two distinct logarithmic families, so $\theta_*$ can serve as a probe of an internal flow-state transition.
Reading between the lines
- If the 0.85 plateau holds beyond the parameter range shown, bulk thermal fluctuation levels in geophysical or industrial convection could be estimated from global heat-flux measurements alone, sidestepping intrusive thermometry.
- The cube-cell plateau at $\sigma_{T,c}/\theta_* \approx 0.34$, one-third of the cylinder value, suggests the constant encodes the topology of the large-scale circulation; surveying other aspect ratios would map where universality ends.
- The velocity residual $\sim Ra^{0.07}$ is close to a $1/7$ turbulent boundary-layer exponent, hinting that $w_*$ captures the leading buoyancy balance while a weaker momentum-transport correction leaks in; a Prandtl-number sweep at fixed $Ra$ could test this.
- The ultra-high-$Ra$ split in $\theta_*$-scaled logarithmic profiles could be correlated with independent transition diagnostics, such as changes in heat-transport scaling or spectral signatures, to see whether $\theta_*$ is a reliable transition detector.
Signed reviews
Editorial analysis
A structured set of objections, weighed in public.
Referee Report
Summary. This paper reports new temperature and vertical-velocity fluctuation measurements in an aspect-ratio-one cylindrical Rayleigh–Bénard cell with smooth and rough plates, and combines them with a large set of literature data. The authors introduce the convective temperature and velocity scales θ*=(Q0^2/(αgH))^{1/3} and w*=(αgHQ0)^{1/3}, express them through Ra, Pr, and Nu, and show that the centreline rms temperature scaled by θ*, σT,c/θ*, collapses to about 0.85 for cylindrical cells over Ra≈10^8–10^15 and Pr≈0.7–23.3, independent of plate roughness, while a smaller plateau 0.34 is found in cubic cells. They further report σw,c/w* ~ Ra^{0.07±0.02}, a power-law σT(z)/θ* profile in the mixing zone of cylindrical cells, and a logarithmic σw(z)/w* profile, and suggest that θ* can be used to detect flow-state transitions at ultra-high Ra. The central claimed achievements are that θ* and w* are the proper characteristic scales for bulk temperature and velocity fluctuations in aspect-ratio-unity cylindrical cells.
Significance. If the results hold, the paper provides a valuable empirical simplification: decades of scattered σT,c/ΔT data in cylindrical cells are compressed into a single constant, and the He–Xia result on the functional form of σT(z) is extended to rough plates and to a much wider parameter range. The strength of the paper is its large compiled database and the fact that, for the temperature collapse, Nu was measured simultaneously with σT,c in each source. The velocity part is less secure, because a substantial fraction of the smooth-cell data relies on a substituted global Nusselt correlation rather than simultaneous measurements; a DNS or a new experiment with simultaneous Nu is a concrete, decisive test. The claims are empirical and falsifiable, which is a genuine merit even where the present support is incomplete.
major comments (4)
- [Sec. 3.2, Eq. (2.1), Fig. 4(b)] The σw,c/w* collapse is not self-contained for three of the literature cylinder datasets. For Daya & Ecke (2001), Qiu et al. (2004), and Shang et al. (2008), no Nusselt number was measured simultaneously with σw,c, so w* is computed from the empirical correlation Nu=0.14 Ra^{0.297} Pr^{-0.03}. Because Rew*=(Ra Nu Pr^{-2})^{1/3}, this substituted exponent transfers directly to the normalized velocity: with Reσw ~ Ra^{0.50}, the ratio automatically inherits Ra^{0.50-(1+0.297)/3} ≈ Ra^{0.068}, i.e. essentially the quoted 0.07. The paper itself notes that the Shang et al. data are about 14% low and attributes this to the systematic error introduced when calculating w* with a Nu that was not measured simultaneously. Thus the velocity universality claim, and the stated conclusion that w* is the proper bulk velocity scale, currently rest on a fitted heat-transport model for a large fraction of the data. I request either a sensitivity analysis over plausible deviations of Nu for those experiments, or a demonstration using data with simultaneous Nu (DNS or new measurements), before this part of the claim can be accepted.
- [Sec. 3.1, Fig. 3(b)] The central temperature result is quoted as σT,c/θ* ≈ 0.85 without any quantitative measure of scatter or uncertainty. Figure 3(b) shows visible spread among sources and no error bars, and the value is obtained by averaging over very different experiments with different reported accuracies. To support the claim of a universal constant, the paper should report the standard deviation or coefficient of variation of the cylindrical data, state the Ra range over which the average is taken, and propagate the uncertainties in Ra, Pr, and Nu into θ*/ΔT for each point. Without this, the 0.85 value cannot be distinguished from a loose trend or from a weak residual Ra dependence.
- [Sec. 3.1, Fig. 1(b,d)] The claim that the σT/θ* profile is universal for smooth and rough plates rests on offsetting the vertical coordinate for rough-cell data by the roughness height h. This coordinate shift is not derived, and no sensitivity test is given; different choices of origin (valley, base, midpoint of the roughness elements) would change the extent and quality of the collapse in the mixing zone. If the physical origin at the roughness tips is intended, that should be stated explicitly and justified; otherwise the apparent universality may be an artifact of the chosen offset.
- [Sec. 3.3, Fig. 6] The proposed flow-state transition in the ultra-high-Ra data is inferred from only two groups, Ra ≥ 7.90×10^14 and Ra ≤ 1.18×10^13, with no intermediate points and no confidence intervals on the two logarithmic slopes. Since the paper presents this only as a potential application of θ*, the language should be correspondingly cautious, or the analysis should be extended with a quantitative comparison (e.g., overlapping fit ranges and slope uncertainties).
minor comments (5)
- [Abstract] The phrase "the the convective velocity" in the abstract should read "the convective velocity."
- [Sec. 3.2] The sentence "As these data are taken in a cell with Γ=0.7" appears immediately after a discussion of cube data; a cube does not have Γ=0.7, so the sentence should identify the correct geometry, presumably the cylinder data of Daya & Ecke (2001).
- [Sec. 3.3] The text refers to "the Ra-dependence of θT (z)/θ*"; this should be σT(z)/θ*.
- [Fig. 4(b) and Sec. 3.2] The figure should mark, by symbol or legend, which datasets used the substituted Nusselt correlation and which used simultaneous Nu, so that the reader can separate self-contained data from correlation-dependent data.
- [Sec. 3.2, Fig. 5] The text describing Fig. 5 says "σw,c/w* in the range..." when it is discussing the logarithmic profile plot; the notation should be σw(z)/w* to distinguish the profile from the centre-point values in Fig. 4.
Circularity Check
Partial circularity: the velocity scaling σw,c/w* ~ Ra^0.07 is largely forced by substituting a fitted Nusselt correlation into the definition of w*, while the temperature collapse rests on simultaneous Nu measurements.
-
fitted input called prediction
[Section 3.2, Fig. 4(b) discussion]
"For the data from Daya & Ecke (2001), Qiu et al. (2004) and Shang et al. (2008), there is no Nu data available. To obtain Rew∗, we used the heat transport scaling relation Nu = 0.14Ra^0.297Pr^−0.03, which was obtained in the Ra range 2×10^7 ≤ Ra ≤ 3×10^10 and the Pr range 4 ≤ Pr ≤ 1350 (Xia, Lam & Zhou 2002)."
For these three velocity datasets, w* is not measured; it is constructed from a globally fitted heat-transport correlation. The plotted collapse of σw,c/w* for those points consequently tests that correlation, not an independently measured convective velocity scale. The paper itself concedes the Shang et al. data lie about 14% low and attributes this to 'the systematic error introduced when calculating w*, which involves Nu that was not measured simultaneously with σw,c'. Thus part of the claimed topography-independent velocity universality is inherited from a substituted empirical fit rather than from simultaneous velocity and heat-flux data.
-
self definitional
[Section 2, Eq. (2.1) and Section 3.2, Fig. 4(b) fits]
"θ∗/ΔT = Nu^{2/3}/(RaPr)^{1/3}, Rew∗ = w∗H/ν = (RaNuPr^{−2})^{1/3} (2.1) ... Reσw,c = 0.014Ra^{0.50±0.01} (smooth cell) ... σw,c/w∗ ∼ Ra^{0.07±0.02}."
Since Rew* = (RaNuPr^{−2})^{1/3}, inserting Nu = 0.14Ra^{0.297}Pr^{−0.03} gives Rew* ∝ Ra^{(1+0.297)/3} = Ra^{0.432}. Dividing the fitted Reσw ∝ Ra^{0.50} by this scale yields σw,c/w* ∝ Ra^{0.50−0.432} = Ra^{0.068}, which is exactly the reported exponent 0.07. The weak Ra-dependence is therefore an algebraic consequence of the two fitted exponents already contained in the normalization; it is not an independent empirical scaling of σw,c/w* discovered from the ratio alone.
full rationale
This is an empirical data-collapse study rather than a derivation, so most of its structure is a legitimate test of proposed scales. The temperature claim σT,c/θ* ≈ 0.85 is self-contained: for every temperature dataset the paper states that Nu was measured together with σT,c, so θ* is computed from simultaneous global heat transport rather than from a fitted proxy. The profile comparisons with He & Xia (2019) and Adrian (1996) extend prior results to rough plates and are not forced by construction. The primary circularity concerns the velocity claim. For the smooth-cell velocity data of Daya & Ecke (2001), Qiu et al. (2004) and Shang et al. (2008), no simultaneous Nu is available, so w* is built from the fitted correlation Nu = 0.14Ra^0.297Pr^{−0.03}. The resulting collapse is therefore not an independent measurement of the convective velocity scale. Moreover, the reported residual exponent 0.07 is not a fresh discovery: Eq. (2.1), the fitted Reσw ∝ Ra^{0.50}, and the substituted Nu ∝ Ra^{0.297} combine algebraically to give Ra^{0.068}. This is a partial, construction-level circularity in one of the two central claims. The paper's own note about the 14% offset in Shang et al. shows the normalization's sensitivity to the substituted Nu. Because the temperature universality and the profile results retain independent empirical content, and because no uniqueness theorem or self-citation chain is used to forbid alternatives, a score of 5 is appropriate rather than a higher one.
Assumptions & free parameters
free parameters (3)
- Heat-transport correlation for missing Nu data =
Nu = 0.14 Ra^{0.297} Pr^{-0.03}
- Mixing-zone power-law fit for sigma_T/theta* in cylindrical cells =
0.53 (z/H)^{-0.57 +/- 0.03}
- Logarithmic fit for sigma_w/w* =
sigma_w/w* = 0.22 ln(z/H) + 1.22
assumptions (5)
- domain assumption In the region outside the boundary layers, the relevant physical parameters are alpha*g, Q0, and H only; viscosity and thermal diffusivity do not enter the bulk scale determination.
- standard math The convective scales satisfy theta* = Q0^{2/3}/(alpha*g*H)^{1/3} and w* = (alpha*g*H*Q0)^{1/3}.
- domain assumption The power-law temperature profile in the mixing zone corresponds to a region with mean horizontal shear, and the logarithmic forms correspond to plume-dominated regions.
- ad hoc to paper Offsetting the vertical coordinate for rough-cell data by the roughness height h produces the correct comparison with smooth-cell data.
- domain assumption The measured global Nusselt number used in Eq. 2.1 is accurate for each cell, including rough cells with pyramidal roughness.
Cite this review
Pith. "Pith review of Universal fluctuations in the bulk of Rayleigh-B\'enard turbulence." pith.science (2026). https://pith.science/paper/AA54ZP5A
@misc{pith2026190805837,
  author       = {Pith},
  title        = {Pith review of: Universal fluctuations in the bulk of Rayleigh-B\'enard turbulence},
  year         = {2026},
  howpublished = {\url{https://pith.science/paper/AA54ZP5A}},
  note         = {Machine review of arXiv:1908.05837}
}
abstract
We present an investigation of the root-mean-square (rms) temperature $\sigma_T$ and the rms velocity $\sigma_w$ in the bulk of Rayleigh-B\'enard turbulence, using new experimental data from the current study and experimental and numerical data from previous studies. We find that, once scaled by the convective temperature $\theta_*$, the value of $\sigma_T$ at the cell centre is a constant, i.e. $\sigma_{T,c}/\theta_* \approx 0.85$, over a wide range of the Rayleigh number ($10^{8}\leq Ra\leq 10^{15}$) and the Prandtl number ($0.7\leq Pr \leq 23.34$), and is independent of the surface topographies of the top and bottom plates of the convection cell. A constant close to unity suggests that $\theta_*$ is a proper measure of the temperature fluctuation in the core region. On the other hand, $\sigma_{w,c}/w_*$, the vertical rms velocity at the cell centre scaled by the convective velocity $w_*$, shows a weak $Ra$-dependence ($\sim Ra^{0.07\pm0.02}$) over $10^8\leq Ra\leq 10^{10}$ at $Pr\sim4.3$ and is independent of plate topography. Similar to a previous finding by He \& Xia ({\it Phys. Rev. Lett.,} vol. 122, 2019, 014503), we find that the rms temperature profile $\sigma_T(z)/\theta_*$ in the region of the mixing zone with a mean horizontal shear exhibits a power-law dependence on the distance $z$ from the plate, but now the universal profile applies to both smooth and rough surface topographies and over a wider range of $Ra$. The vertical rms velocity profile $\sigma_w(z)/w_*$ obey a logarithmic dependence on $z$. The study thus demonstrates that the typical scales for the temperature and the velocity are the convective temperature $\theta_*$ and the the convective velocity $w_*$, respectively. Finally, we note that $\theta_*$ may be utilised to study the flow regime transitions in the ultra-high-$Ra$-number turbulent convection.
Figures


Figures from the paper (3 more)


Reference graph
Works this paper leans on
-
[1]
@esa (Ref
\@ifclassloaded aguplus natbib The aguplus class already includes natbib coding, so you should not add it explicitly Type <Return> for now, but then later remove the command natbib from the document \@ifclassloaded nlinproc natbib The nlinproc class already includes natbib coding, so you should not add it explicitly Type <Return> for now, but then later r...
-
[2]
@stdbsttrue NAT@ctr \@lbibitem[ NAT@ctr ] \@lbibitem[#1]#2 \@extra@b@citeb \@ifundefined br@#2\@extra@b@citeb \@namedef br@#2 \@nameuse br@#2\@extra@b@citeb \@ifundefined b@#2\@extra@b@citeb @num @parse #2 [ @natanchorstart #2\@extra@b@citeb \@biblabel @num @natanchorend] @ifcmd#1(@)(@)\@nil #2 @lbibitem\@undefined @lbibitem\@lbibitem \@lbibitem[#1]#2 @lb...
-
[3]
). With the presence of roughness on the top and bottom boundaries (``rough cell
@open @close @open @close and [1] URL: #1 \@ifundefined chapter * \@mkboth \@ifundefined NAT@sectionbib * \@mkboth * \@mkboth\@gobbletwo \@ifclassloaded amsart * \@ifclassloaded amsbook * \@ifundefined bib@heading @heading NAT@ctr thebibliography [1] @ \@biblabel NAT@ctr \@bibsetup #1 NAT@ctr 0 @openbib .11em \@plus.33em \@minus.07em 4000 4000 `\.=1000 \@...
work page 2019
-
[4]
Adrian, R. J. 1996 Variation of temperature and velocity fluctuations in turbulent thermal convection over horizontal surfaces . Int. J. Heat Mass Transfer 39 , 2303--2310
work page 1996
-
[5]
Ahlers, G. , Bodenschatz, E. , Funfschilling, D. , Grossmann, S. , He, X. , Lohse, D. , Stevens, R. J. A. M. & Verzicco, R. 2012 Logarithmic temperature profiles in turbulent Rayleigh-B \'e nard convection . Phys. Rev. Lett. 109 , 114501
work page 2012
-
[6]
Ahlers, G. , Grossmann, S. & Lohse, D. 2009 Heat transfer and large scale dynamics in turbulent Rayleigh-B\'enard convection . Rev. Mod. Phys. 81
work page 2009
-
[7]
Castaing, B. , Gunaratne, G. , Heslot, F. , Kadanoff, L. , Libchaber, A. , Thomae, S. , Wu, X.-Z. , Zaleski, S. & Zanetti, G. 1989 Scaling of hard thermal turbulence in Rayleigh-B\'enard convection . J. Fluid Mech. 204 , 1--30
work page 1989
-
[8]
2012 New perspectives in turbulent Rayleigh-B \'e nard convection
Chill \`a , F & Schumacher, J. 2012 New perspectives in turbulent Rayleigh-B \'e nard convection . Eur. Phys. J. E 35 , 58
work page 2012
Show all 34 references
-
[9]
Daya, Z. A. & Ecke, R. E. 2001 Does turbulent convection feel the shape of the container? Phys. Rev. Lett. 87 , 184501
2001
-
[10]
Deardorff, J. W. 1970 Convective velocity and temperature scales for the unstable planetary boundary layer and for Rayleigh convection . J. Atmos. Sci. 27 , 1211--1213
1970
-
[11]
Du, Y. B. & Tong, P. 2000 Turbulent thermal convection in a cell with ordered rough boundaries . J. Fluid Mech. 407 , 57--84
2000
-
[12]
Du, Y. B. & Tong, P. 2001 Temperature fluctuations in a convection cell with rough upper and lower surfaces . Phys. Rev. E 63 , 046303
2001
-
[13]
& Lohse, D
Grossmann, S. & Lohse, D. 2004 Fluctuations in turbulent Rayleigh-B\'enard convection: the role of plumes . Phys. Fluids 16 , 4462--4472
2004
-
[14]
, Funfschilling, D
He, X. , Funfschilling, D. , Nobach, H. , Bodenschatz, E. & Ahlers, G. 2012 Transition to the Ultimate State of Turbulent Rayleigh-B\'enard Convection . Phys. Rev. Lett. 108 , 024502
2012
-
[15]
& Xia, K.-Q
He, Y.-H. & Xia, K.-Q. 2019 Temperature fluctuation profiles in turbulent thermal convection: a logarithmic dependence versus a power-law dependence . Phys. Rev. Lett. 122 , 014503
2019
-
[16]
, Castaing, B
Heslot, F. , Castaing, B. & Libchaber, A. 1987 Transitions to turbulence in helium gas . Phys. Rev. A 36 , 5870--5873
1987
-
[17]
, Chong, K.-L
Kaczorowski, M. , Chong, K.-L. & Xia, K.-Q. 2014 Turbulent flow in the bulk of Rayleigh-B\'enard convection: aspect-ratio dependence of the small-scale properties . J. Fluid Mech. 747 , 73--102
2014
-
[18]
, Stevens, R
Lakkaraju, R. , Stevens, R. J. A. M. , Verzicco, R. , Grossmann, S. , Prosperetti, A. , Sun, C. & Lohse, D. 2012 Spatial distribution of heat flux and fluctuations in turbulent Rayleigh-B\'enard convection . Phys. Rev. E 86 , 056315
2012
-
[19]
& Xia, K.-Q
Lohse, D. & Xia, K.-Q. 2010 Small-scale properties of turbulent Rayleigh-B\'enard convection . Annu. Rev. Fluid Mech. 42 , 335--364
2010
-
[20]
& Xia, K.-Q
Lui, S.-L. & Xia, K.-Q. 1998 Spatial structure of the thermal boundary layer in turbulent convection . Phys. Rev. E 57 , 5494--5503
1998
-
[21]
Niemela, J. J. , Skrbek, L. , Sreenivasan, K. R. & Donnelly, R. J. 2000 Turbulent convection at very high Rayleigh numbers . Nature 404 , 837--840
2000
-
[22]
Qiu, X. L. , Shang, X.-D. , Tong, P. & Xia, K.-Q. 2004 Velocity oscillations in turbulent Rayleigh-B\'enard convection . Phys. Fluids 16 , 412--423
2004
-
[23]
Scheel, J. D. & Schumacher, J. 2016 Global and local statistics in turbulent convection at low Prandtl numbers . J. Fluid Mech. 802 , 147--173
2016
-
[24]
, Tong, P
Shang, X.-D. , Tong, P. & Xia, K.-Q. 2008 Scaling of the local convective heat flux in turbulent Rayleigh-B\'enard convection . Phys. Rev. Lett. 100 , 244503
2008
-
[25]
, Xia, K.-Q
Shen, Y. , Xia, K.-Q. & Tong, P. 1995 Measured local-velocity fluctuations in turbulent convection . Phys. Rev. Lett. 75 , 437--440
1995
-
[26]
, Cheung, Y.-H
Sun, C. , Cheung, Y.-H. & Xia, K.-Q. 2008 Experimental studies of the viscous boundary layer properties in turbulent Rayleigh-B\'enard convection . J. Fluid Mech. 605 , 79--113
2008
-
[27]
& Xia, K.-Q
Wang, J. & Xia, K.-Q. 2003 Spatial variations of the mean and statistical quantities in the thermal boundary layers of turbulent convection . Eur. Phys. J. B 32 , 127--136
2003
-
[28]
Wang, Y. , Xu, W. , He, X. , Yik, H. , Wang, X. , Schumacher, J. & Tong, P. 2018 Boundary layer fluctuations in turbulent Rayleigh-B\'enard convection . J. Fluid Mech. 840 , 408--431
2018
-
[29]
& Ahlers, G
Wei, P. & Ahlers, G. 2016 On the nature of fluctuations in turbulent Rayleigh-B\'enard convection at large Prandtl numbers . J. Fluid Mech. 802 , 203--244
2016
-
[30]
, Chan, T.-S
Wei, P. , Chan, T.-S. , Ni, R. , Zhao, X.-Z. & Xia, K.-Q. 2014 Heat transport properties of plates with smooth and rough surfaces in turbulent thermal convection . J. Fluid Mech. 740 , 28--46
2014
-
[31]
2013 Current trends and future directions in turbulent thermal convection
Xia, K.-Q. 2013 Current trends and future directions in turbulent thermal convection . Theo. Appl. Mech. Lett 3 , 052001
2013
-
[32]
, Lam, S
Xia, K.-Q. , Lam, S. & Zhou, S.-Q. 2002 Heat-flux measurement in high-Prandtl-number turbulent Rayleigh-B\'enard Convection . Phys. Rev. Lett. 88 , 064501
2002
-
[33]
, Ding, G.-Y
Xie, Y.-C. , Ding, G.-Y. & Xia, K.-Q. 2018 Flow topology transition via global bifurcation in thermally driven turbulence . Phys. Rev. Lett. 120 , 214501
2018
-
[34]
& Xia, K.-Q
Xie, Y.-C. & Xia, K.-Q. 2017 Turbulent thermal convection over rough plates with varying roughness geometries . J. Fluid Mech. 825 , 573--599
2017
Reviewed August 14, 2026 · model on record in the stance chip above.
Discussion (0). Continue with ORCID to comment.