REVIEW 4 major objections 6 minor 50 references
Five decades of US, UK, German and Dutch music charts show that cultural processes are accelerating
T0 review · 4 major / 6 minor · reviewed 2026-08-14 · deepseek-v4-flash
Pith's one-line read According to five decades of US, UK, German, and Dutch album charts, the time an album stays in the top 40 has roughly halved, and the paper reads this as evidence that cultural processes are accelerating.
desk verdict A genuinely new empirical result on accelerating chart dynamics, but the theory section has a real error and the chart-rule confound is not fully addressed. read the letter →
The pith
A machine-rendered reading of the paper's core claim, the machinery that carries it, and where it could break.
The reading
What carries the argument
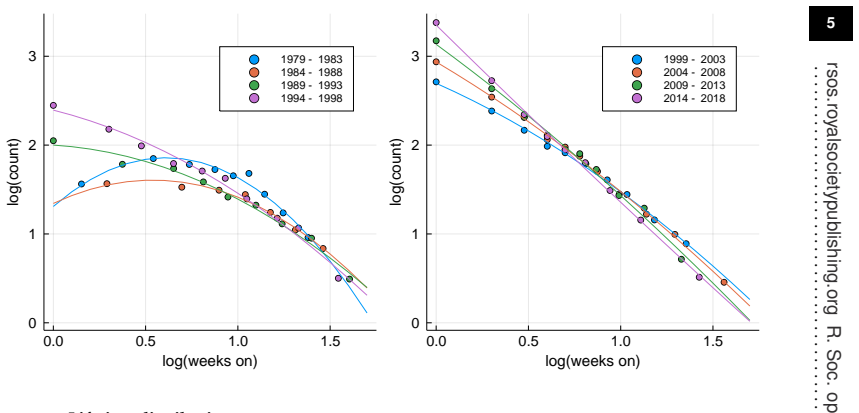
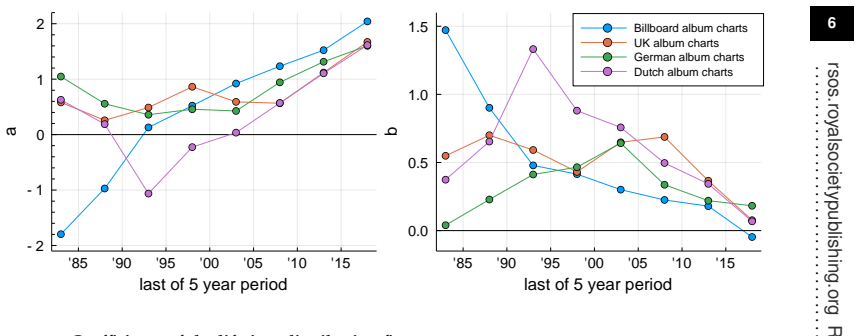
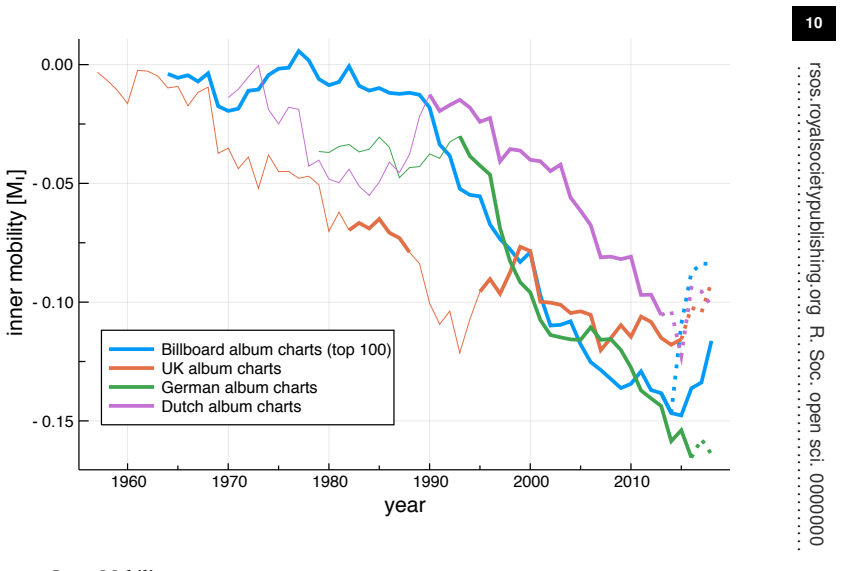
The central objects are the weekly album lifetime $n_w$ and the fitted distribution $P(n_w)\sim \exp(-a\ln n_w - b \ln^2 n_w)$, where $b>0$ gives a log-normal and $b\to 0$ a power law $P(n_w)\sim 1/n_w^a$; the paper tracks $a\to 2$ and $b\to 0$ over successive five-year periods. The other key quantity is the relative inner mobility $M_I = \langle (R(t-1)-R(t))/R\rangle$ with $R=\max(R(t),R(t-1))$, a weekly rank-decay rate. The explanatory machinery is maximum-entropy reasoning under Weber-Fechner logarithmic discounting: entropy maximization with a fixed mean gives an exponential in perceived time, which becomes a power law in physical time; allowing the constraint's weight to vary across individuals gives a log-normal. Decoupling of decisions from personal time horizons drives $b\to 0$.
What would settle it
Recompute the top-40 lifetime distribution and mean lifetime separately within each fixed-methodology era, for example the pre-1991 Billboard charts, the 1991–2014 sales era, and the post-2014 streaming era, and check whether the decline in mean lifetime and the drift of the fit parameter $b$ toward zero persist inside each era; if the changes appear only at the rule-change boundaries, the acceleration claim fails.
Extended reading notes
Core claim
The paper's central claim is that the long-term evolution of four national album charts constitutes quantitative evidence for an acceleration of cultural processes. Over the past five decades the average number of weeks an album remains in the top 40 has roughly halved in the US and Germany; the share of number-one albums that enter at the top has risen from near zero to the large majority; and the distribution of album lifetimes has turned from a log-normal curve into a near power law with exponent approaching two. The paper interprets the power-law endpoint as a self-organized critical state, and notes that these charts allow observation of the critical state while it is still forming rather than only after it has been reached. A further claim is that sales-based and airplay-based charts differ statistically, and that including streaming in chart algorithms reduces chart diversity and inner mobility.
Load-bearing premise
The central conclusion assumes the secular changes in chart statistics reflect real changes in cultural consumption, not the repeated changes in chart compilation rules (electronic sales tracking in 1991, multi-metric consumption in 2014/15, and streaming inclusion in 2014–2017).
Editorial extensions
If this is right
- If the acceleration is real, the yearly number of number-one albums has grown from about a dozen in the 1980s to about 40 today, approaching the maximum of 52 per year.
- An album that does not enter at or near the top now has little chance of ever reaching number one; the average climb time has fallen to under a week in the US, Germany, and the Netherlands.
- The inner-mobility data imply a weekly rank-decay time that shortened by roughly a factor of three between 1990 and 2010 for the US, German, and Dutch charts.
- Charts compiled from sales show self-organization toward power-law lifetimes, while charts based substantially on airplay do not follow the same lifetime-distribution pattern.
- Including streaming in chart algorithms reduces chart diversity and inner mobility, an adverse effect on the number of albums that reach the charts.
Reading between the lines
- The time-horizon decoupling mechanism implies a testable generalization: other cultural consumption measures that allow instant purchase, such as book sales, movie box-office runs, or streaming playlist retention, should show the same log-normal-to-power-law shift as frictions to purchase disappear.
- Because the paper does not model the chart-rule changes, the cleanest test of the acceleration claim would be to recompute all statistics within epochs of fixed methodology; the paper's own continuity series, the sales-only Billboard Top Album Sales, makes part of that test possible.
- The political extension the paper sketches would become more than suggestive if analogous shortening were found in opinion polls or news-attention cycles; those data would decide whether the music-chart acceleration is a cultural curiosity or a general social phenomenon.
Signed reviews
Editorial analysis
A structured set of objections, weighed in public.
Referee Report
Summary. The paper analyzes five decades of US, UK, German and Dutch album charts, using chart diversity, top-40 album lifetimes, entry/exit ranks of number-one albums, and a relative inner-mobility statistic. It reports that chart diversity increased, mean album lifetimes fell by roughly a factor of two, number-one albums increasingly entered at the top rather than climbing, and the lifetime distribution evolved from log-normal to a power law with exponent approaching two. The authors interpret these changes as evidence for accelerating cultural processes. They then propose an information-theoretic model in which maximum-entropy production under the Weber–Fechner law yields power laws, and a Gaussian distribution of individual time-horizon preferences yields log-normals; the observed evolution is attributed to the fading relevance of personal time horizons. The paper also discusses implications for political opinion dynamics and democratic stability.
Significance. If the empirical trends survive controls for chart-methodology changes, the paper would be a valuable contribution to the literature on social acceleration and to empirical studies of self-organized criticality. The multi-country design, the long observation window, and the use of multiple chart statistics are genuine strengths, and the paper is candid about some of its limitations. However, the central empirical claim depends on treating documented changes in chart compilation rules as negligible, and the theoretical derivation in Section 3 contains a mathematical error. At present the manuscript is not technically sound enough for publication, although the main issues appear addressable within the scope of a revision.
major comments (4)
- [§3(b), Eqs (3.4)-(3.5)] The central claim that the observed trends reflect cultural acceleration assumes that the chart rankings are comparable across five decades, but the manuscript itself documents major rule changes that are not modeled or subtracted. The 1991 SoundScan change, the 2010 catalog-album inclusion, the 2014/15 Billboard multi-metric switch, and the streaming inclusions in the Netherlands (2014), UK (2016), and Germany (2017) could each shorten measured lifetimes, raise diversity, and increase top entries. For the UK, German, and Dutch charts only the post-streaming metric is available, so there is no like-for-like control. The statement in §2 that the 2014/15 update "affected the chart statistics profoundly" and the concession in §3(c) that "we cannot rule out that other drivings may cause the observed changes" directly undermine the strong conclusion in the abstract. I request a breakpoint analysis around each rule change, a sensitivity analysis restricted to the sales-based Billboard Top Album Sales metric for the full period, and explicit tests of whether the reported trends remain when streaming-era data are excluded.
- [§2(b), Figs 3 and 4] The marginalization integral in Eq. (3.4) is evaluated incorrectly. For Gaussian p(h) ∝ exp(−(h−h̄)²/(2σ_h²)) with h̄ set to zero, the integral over h of exp(−(a+κh)s − h²/(2σ_h²)) gives exp(−as + (κσ_h)²s²/2), i.e. a positive quadratic term, not exp(−as − bs²). Consequently Eq. (3.5) does not yield a log-normal distribution after the Weber–Fechner transform; it yields a distribution that grows as exp(+b ln² S), which is not normalizable. This is a load-bearing error because the paper's theoretical explanation of the log-normal-to-power-law transition rests on this derivation. The authors should correct the sign and normalization, or explicitly introduce a different mechanism (for example, a constraint on the variance of s) that produces the claimed log-normal.
- [Abstract and §3(c)] The claim that the lifetime distribution evolves from log-normal to a power law is supported only by quadratic fits to binned log-log histograms, with no error bars, no confidence intervals, and no model comparison. The fitted coefficient b in Fig. 4 is reported without uncertainty, and for the German charts the trend is acknowledged to be "less clear". Without bootstrap confidence intervals, goodness-of-fit tests, and a formal comparison between log-normal and power-law models (for example, by AIC or likelihood-ratio tests), the reader cannot assess whether the change in b is statistically meaningful or an artifact of binning and sample-size changes. This is central to the paper's most novel empirical claim and should be quantified.
- [Conclusion, §5] The abstract states that the fading relevance of personal time horizons "may be causing" the observed changes, but no direct measure of time horizons is provided, and the paper itself concedes in §3(c) that the arguments are "at present only circumstantial." The data are consistent with many explanations, including changes in marketing, chart methodology, and consumption technology. The causal language should be softened to "consistent with" or "suggests," and the interpretation should be explicitly framed as a hypothesis rather than an empirical finding.
minor comments (6)
- [Data Accessibility] The caption contains a typo: "20014/15" should be "2014/15."
- [§2(a)] The Data Accessibility statement refers to references 25–28, but the chart data sources are references 20–23; the numbering should be corrected.
- [§2(e)] The approximation w̄ ≈ 1/d should be stated more carefully; it assumes a fixed number of slots and ignores that an album can appear in multiple years, so the inverse-diversity relation is only a rough guide.
- [§2(b)] There is a duplicated word in the text: "the the" in the sentence describing the inner mobility trends.
- [§3(b)] The sentence listing the starting years for the four charts ("since 1963/1967/1978/1979, and respectively since 1963/1982/1993/1990") is confusing and should be rewritten as a table or a clearer enumeration.
- [§2(f)] The statement that setting h̄ to zero can be done "without loss of generality" is only correct if the mean is absorbed into the Lagrange multiplier a; this should be stated explicitly to avoid confusion about the role of h̄.
Circularity Check
No circularity: the acceleration trends are direct measurements of chart data; the theoretical model is post hoc but not used as an independent prediction.
full rationale
The empirical findings (chart diversity, album lifetimes, entry ranks, inner mobility) are computed directly from public chart data. The relation d = Na/Ns and w-bar ≈ 1/d is an accounting identity, but the paper does not present it as independent evidence and separately measures top-40 lifetimes from consecutive weekly listings. The information-theoretic derivation in Sec. 3 produces the same two-parameter functional family as the empirical fit in Eq. (2.1), so it is flexible and non-predictive rather than an independent confirmation; the authors explicitly call the time-horizon interpretation a postulate and concede 'we cannot rule out that other drivings may cause the observed changes' (Sec. 3c). Self-citations (refs 16, 24, 41) support background concepts and the speculative political-instability aside, but the central acceleration claim rests on chart statistics, not on these citations. No equation is defined in terms of its target, no fitted parameter is renamed as a prediction, and no uniqueness theorem is imported from the authors' prior work. The documented chart-rule changes (SoundScan 1991, streaming inclusions 2014-2017) are a validity threat to the causal interpretation, but they are not a circularity in the derivation chain.
Assumptions & free parameters
free parameters (4)
- lifetime distribution exponent a (per 5-year period) =
not tabulated; approaches ~2 over time (Fig. 4)
- lifetime distribution curvature b (per 5-year period) =
not tabulated; tends to 0 (Fig. 4)
- hidden-variable coupling κ
- preference spread σ_h
assumptions (5)
- domain assumption Weber-Fechner law: neural representations of stimuli, numbers, and time scale logarithmically.
- ad hoc to paper Human activities produce maximum-entropy distributions.
- ad hoc to paper Individual preferences (hidden variable h) are Gaussian distributed.
- domain assumption Chart statistics are a valid proxy for cultural and opinion-formation processes.
- ad hoc to paper A power-law lifetime distribution indicates a self-organized critical state.
invented entities (1)
-
hidden variable h (individual time-horizon or preference coupling)
Cite this review
Pith. "Pith review of Five decades of US, UK, German and Dutch music charts show that cultural processes are accelerating." pith.science (2026). https://pith.science/paper/AFKSGW4I
@misc{pith2026190810694,
  author       = {Pith},
  title        = {Pith review of: Five decades of US, UK, German and Dutch music charts show that cultural processes are accelerating},
  year         = {2026},
  howpublished = {\url{https://pith.science/paper/AFKSGW4I}},
  note         = {Machine review of arXiv:1908.10694}
}
read the original abstract
Analyzing the timeline of US, UK, German and Dutch music charts, we find that the evolution of album lifetimes and of the size of weekly rank changes provide evidence for an acceleration of cultural processes. For most of the past five decades number one albums needed more than a month to climb to the top, nowadays an album is in contrast top ranked either from the start, or not at all. Over the last three decades, the number of top-listed albums increased as a consequence from roughly a dozen per year to about 40. The distribution of album lifetimes evolved during the last decades from a log-normal distribution to a powerlaw, a profound change. Presenting an information-theoretical approach to human activities, we suggest that the fading relevance of personal time horizons may be causing this phenomenon. Furthermore we find that sales and airplay based charts differ statistically and that the inclusion of streaming affects chart diversity adversely. We point out in addition that opinion dynamics may accelerate not only in cultural domains, as found here, but also in other settings, in particular in politics, where it could have far reaching consequences.
Figures


Figures from the paper (5 more)



Reference graph
Works this paper leans on
-
[1]
2015 The evolution of popular music: USA 1960–2010
Mauch M, MacCallum RM, Levy M, Leroi AM. 2015 The evolution of popular music: USA 1960–2010. Royal Society Open Science 2, 150081
work page 2015
-
[2]
2018 Race, gender, and the Billboard Top 40 charts between 1997 and 2007
Lafrance M, Scheibling C, Burns L, Durr J. 2018 Race, gender, and the Billboard Top 40 charts between 1997 and 2007. Popular Music and Society 41, 522–538
work page 2018
-
[3]
2016 Objectification in popular music lyrics: An examination of gender and genre differences
Flynn MA, Craig CM, Anderson CN, Holody KJ. 2016 Objectification in popular music lyrics: An examination of gender and genre differences. Sex roles 75, 164–176
work page 2016
-
[4]
Ordanini A, Nunes JC. 2016 From fewer blockbusters by more superstars to more blockbusters by fewer superstars: How technological innovation has impacted convergence on the music chart. International Journal of Research in Marketing 33, 297–313
work page 2016
-
[5]
2017 A study of pop songs based on the billboard corpus
Nishina Y. 2017 A study of pop songs based on the billboard corpus. International Journal of Language and Linguistics 4, 125–134
work page 2017
-
[6]
Nunes JC, Ordanini A, Valsesia F. 2015 The power of repetition: repetitive lyrics in a song increase processing fluency and drive market success. Journal of Consumer Psychology 25, 187– 199
work page 2015
-
[7]
Achterberg P , Heilbron J, Houtman D, Aupers S. 2011 A cultural globalization of popular music? American, Dutch, French, and German popular music charts (1965 to 2006). American behavioral scientist 55, 589–608
work page 2011
-
[8]
2018 Musical trends and predictability of success in contemporary songs in and out of the top charts
Interiano M, Kazemi K, Wang L, Yang J, Yu Z, Komarova NL. 2018 Musical trends and predictability of success in contemporary songs in and out of the top charts. Royal Society Open Science 5, 171274
work page 2018
Show all 50 references
-
[9]
2017 Significance and popularity in music production
Monechi B, Gravino P , Servedio VD, Tria F, Loreto V . 2017 Significance and popularity in music production. Royal Society Open Science 4, 170433
2017
-
[10]
2013 Social acceleration: A new theory of modernity
Rosa H. 2013 Social acceleration: A new theory of modernity. Columbia University Press
2013
-
[11]
2017 Slowing down modernity: A critique
Vostal F. 2017 Slowing down modernity: A critique. Time & Society p. 0961463X17702163
2017
-
[12]
2004 Liberal democracy and the social acceleration of time
Scheuerman WE. 2004 Liberal democracy and the social acceleration of time. JHU Press
2004
-
[13]
2014 A question of time: Responsive and responsible democratic politics
Goetz KH. 2014 A question of time: Responsive and responsible democratic politics. West European Politics 37, 379–399
2014
-
[14]
2013 Acceleration in working life: An empirical test of a sociological framework
Ulferts H, Korunka C, Kubicek B. 2013 Acceleration in working life: An empirical test of a sociological framework. Time & Society 22, 161–185
2013
-
[15]
Private communication
Rosa H. Private communication
-
[16]
2014 Power laws and self-organized criticality in theory and nature
Markovi´ c D, Gros C. 2014 Power laws and self-organized criticality in theory and nature. Physics Reports 536, 41–74
2014
-
[17]
1924 The visual discrimination of intensity and the Weber-Fechner law.The Journal of general physiology 7, 235–267
Hecht S. 1924 The visual discrimination of intensity and the Weber-Fechner law.The Journal of general physiology 7, 235–267
1924
-
[18]
2003 The neural basis of the Weber–Fechner law: a logarithmic mental number line
Dehaene S. 2003 The neural basis of the Weber–Fechner law: a logarithmic mental number line. Trends in cognitive sciences7, 145–147
2003
-
[19]
2018 Memory as Perception of the Past: Compressed Time inMind and Brain
Howard MW. 2018 Memory as Perception of the Past: Compressed Time inMind and Brain. Trends in cognitive sciences22, 124–136
2018
-
[20]
http://www.billboard.com/
Billboard Charts. http://www.billboard.com/
-
[21]
http://www.officialcharts.com
Official Charts. http://www.officialcharts.com
-
[22]
http://www.offiziellecharts.de
Official German Charts. http://www.offiziellecharts.de
-
[23]
http://dutchcharts.nl
Dutch Charts. http://dutchcharts.nl
-
[24]
2012 Neuropsychological constraints to human data production on a global scale
Gros C, Kaczor G, Markovi´ c D. 2012 Neuropsychological constraints to human data production on a global scale. The European Physical Journal B 85, 28
2012
-
[25]
1987 Self-organized criticality: An explanation of the 1/f noise
Bak P , Tang C, Wiesenfeld K. 1987 Self-organized criticality: An explanation of the 1/f noise. Physical review letters 59, 381
1987
-
[26]
2002 Evolution of the social network of scientific collaborations
Barabâsi AL, Jeong H, Néda Z, Ravasz E, Schubert A, Vicsek T. 2002 Evolution of the social network of scientific collaborations. Physica A: Statistical mechanics and its applications311, 590– 614
2002
-
[27]
2018 Unidirectional random growth with resetting
Biro TS, Neda Z. 2018 Unidirectional random growth with resetting. Physica A: Statistical Mechanics and its Applications 499, 335–361
2018
-
[28]
2015 Complex and adaptive dynamical systems: A primer
Gros C. 2015 Complex and adaptive dynamical systems: A primer. Springer. 18rsos.royalsocietypublishing.org R. Soc. open sci. 0000000
2015
-
[29]
2014 The log-dynamic brain: how skewed distributions affect network operations
Buzsáki G, Mizuseki K. 2014 The log-dynamic brain: how skewed distributions affect network operations. Nature Reviews Neuroscience 15, 264
2014
-
[30]
2003 Coding of cognitive magnitude: Compressed scaling of numerical information in the primate prefrontal cortex
Nieder A, Miller EK. 2003 Coding of cognitive magnitude: Compressed scaling of numerical information in the primate prefrontal cortex. Neuron 37, 149–157
2003
-
[31]
2002 Representation of the quantity of visual items in the primate prefrontal cortex
Nieder A, Freedman DJ, Miller EK. 2002 Representation of the quantity of visual items in the primate prefrontal cortex. Science 297, 1708–1711
2002
-
[32]
2005 Loss of self-control in intertemporal choice may be attributable to logarithmic time-perception
Takahashi T. 2005 Loss of self-control in intertemporal choice may be attributable to logarithmic time-perception. Medical hypotheses 65, 691–693
2005
-
[33]
1999 Emergence of scaling in random networks
Barabási AL, Albert R. 1999 Emergence of scaling in random networks. science 286, 509–512
1999
-
[34]
2009 Guided self-organization
Prokopenko M. 2009 Guided self-organization
2009
-
[35]
2014 Generating functionals for guided self-organization
Gros C. 2014 Generating functionals for guided self-organization. In Guided Self-Organization: Inception , pp. 53–66. Springer
2014
-
[36]
2013 Generating functionals for autonomous latching dynamics in attractor relict networks
Linkerhand M, Gros C. 2013 Generating functionals for autonomous latching dynamics in attractor relict networks. Scientific reports 3, 2042
2013
-
[37]
2014 Generating functionals for computational intelligence: the Fisher information as an objective function for self-limiting Hebbian learning rules
Echeveste R, Gros C. 2014 Generating functionals for computational intelligence: the Fisher information as an objective function for self-limiting Hebbian learning rules. Frontiers in Robotics and AI 1, 1
2014
-
[38]
2015 Analysis of genetic and non-genetic factors influencing timing and time perception
Bartholomew AJ, Meck WH, Cirulli ET. 2015 Analysis of genetic and non-genetic factors influencing timing and time perception. PLoS One 10, e0143873
2015
-
[39]
2016 Statistics for the behavioral sciences
Gravetter FJ, Wallnau LB. 2016 Statistics for the behavioral sciences. Cengage Learning
2016
-
[40]
2013 Public Opinion in the US States: 1956 to 2010
Enns PK, Koch J. 2013 Public Opinion in the US States: 1956 to 2010. State Politics & Policy Quarterly 13, 349–372
2013
-
[41]
2017 Entrenched time delays versus accelerating opinion dynamics: Are advanced democracies inherently unstable?
Gros C. 2017 Entrenched time delays versus accelerating opinion dynamics: Are advanced democracies inherently unstable?. The European Physical Journal B 90, 223
2017
-
[42]
2015 Politics and popular culture
Street J, Inthorn S, Scott M. 2015 Politics and popular culture. In From entertainment to citizenship , . Manchester University Press
2015
-
[43]
2005 The speed of global flows and the pace of democratic politics
Rosa H. 2005 The speed of global flows and the pace of democratic politics. New Political Science 27, 445–459
2005
-
[44]
2015 Is democracy in decline?
Plattner MF. 2015 Is democracy in decline?. Journal of Democracy 26, 5–10
2015
-
[45]
2015 Crisis and transition, but not decline
Schmitter PC. 2015 Crisis and transition, but not decline. Journal of Democracy 26, 32–44
2015
-
[46]
2018 How to lose a constitutional democracy
Huq A, Ginsburg T. 2018 How to lose a constitutional democracy. UCLA L. Rev. 65, 78
2018
-
[47]
2018 Quantifying reputation and success in art
Fraiberger SP , Sinatra R, Resch M, Riedl C, Barabási AL. 2018 Quantifying reputation and success in art. Science 362, 825–829
2018
-
[48]
2018 Hot streaks in artistic, cultural, and scientific careers
Liu L, Wang Y, Sinatra R, Giles CL, Song C, Wang D. 2018 Hot streaks in artistic, cultural, and scientific careers. Nature 559, 396
2018
-
[49]
2009 Billboard 200 Undergoes Makeover
Trust G. 2009 Billboard 200 Undergoes Makeover. Billboard Magazine 11/17
2009
-
[50]
2014 Billboard 200 Makeover: Album Chart to Incorporate Streams & Track Sales
Staff B. 2014 Billboard 200 Makeover: Album Chart to Incorporate Streams & Track Sales. Billboard Magazine 11/19
2014
Reviewed August 14, 2026 · model on record in the stance chip above.
Discussion (0). Continue with ORCID to comment.