REVIEW 3 major objections 6 minor 26 references
SDSS J1001+5027: Strong microlensing-induced chromatic variation caught in the act
T0 review · 3 major / 6 minor · reviewed 2026-08-05 · deepseek-v4-flash
Pith's one-line read A decade of time-delay-separated spectra of the lensed quasar SDSS J1001+5027 shows that microlensing is now making the trailing image brighter and bluer than the leading one.
desk verdict A well-run monitoring programme yields a plausible microlensing event, but the 2025 'changing look' rests on blue-edge flux calibration the authors themselves flag as unreliable. read the letter →
The pith
A machine-rendered reading of the paper's core claim, the machinery that carries it, and where it could break.
The reading
What carries the argument
Delay-corrected spectral flux ratio: for each observing pair, the spectrum of the trailing image B at the second epoch is divided by the spectrum of the leading image A at an epoch one time delay earlier, so the spectra correspond to the same emission time and intrinsic quasar variability cancels out. The remaining ratio contains a constant macrolens term, constant dust extinction, and any time-variable microlensing. The chromatic content is carried by the ratio's slope: blue continuum photons come from the smallest, innermost radii of the accretion disk, so an increase of the blue side of the ratio relative to the red side is the signature of differential microlensing magnification of the i
What would settle it
Obtain new time-delay-separated spectra of both images with an independent spectrograph whose response is directly measured across 4000–4500 Å (for example on an 8–10 m telescope or a space telescope), reducing or re-deriving the blue calibration from first principles. If the B/A ratio still rises steeply blueward of 4500 Å as seen in 2025, the chromatic microlensing interpretation is confirmed; if the blue upturn disappears or changes shape, it was an artefact of the extrapolated response fit.
Extended reading notes
Core claim
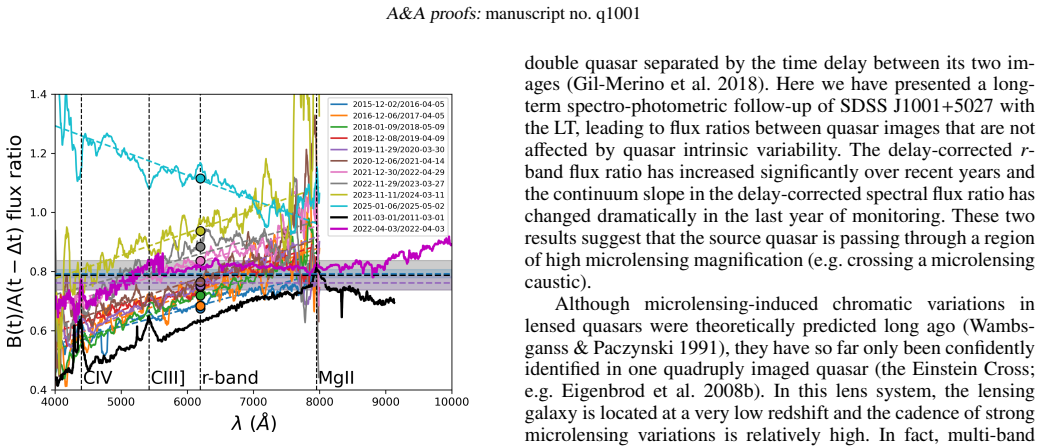
The central claim is that SDSS J1001+5027 is currently undergoing a strong microlensing-induced chromatic variation, caught in the act. The evidence is the delay-corrected spectral flux ratio B/A assembled from ten pairs of spectra separated by the time delay: the r-band ratio increased monotonically over nine years, and the continuum slope of the ratio barely changed until 2025, when it reversed dramatically—the ratio now rises steeply towards blue wavelengths, meaning image B is brighter and bluer than image A. Since macrolensing and dust extinction are constant in time, and since the line-core flux ratios (C iv and C iii]) remain consistent with the K-band macrolens ratio of about 0.79, t
Load-bearing premise
The blue end of the spectrum (roughly 4000–4500 Å), where the claimed colour change is largest, is calibrated by extrapolating polynomial fits to the instrument response from the central 4500–7500 Å region; if the telescope's response at those blue wavelengths drifted between epochs in a way the standard-star calibration did not capture, the dramatic blue upturn in the 2025 ratio could be a calibration artefact rather than microlensing.
Editorial extensions
If this is right
- The event should keep evolving: if the source is crossing a caustic, the B/A flux ratio and its chromatic slope will continue to change measurably on roughly yearly timescales, giving a live map of the caustic.
- Multi-wavelength follow-up (X-ray, UV, optical, IR) during the event can probe different accretion-disk radii, linking microlensing magnification to the disk's radial structure around the central supermassive black hole.
- The stable C iv and C iii] line-core ratios near 0.79 provide a built-in calibration anchor, so future deviations of the continuum from that anchor are cleanly attributable to microlensing rather than to intrinsic quasar activity.
- The successful time-delay-separated spectroscopic monitoring strategy demonstrates that long, robotic-telescope time series can catch microlensing chromatic events outside the special four-image geometry seen before.
- The monotonic nine-year rise of the delay-corrected r-band flux ratio argues that the differential magnification has been building steadily, not as a short burst, so the system merits continued dense monitoring.
Reading between the lines
- If the caustic interpretation is correct, continued X-ray and UV monitoring should show the same differential magnification pattern at even shorter wavelengths; an X-ray/UV brightening of image B correlated with the optical blue excess would independently confirm that the innermost disk is the most magnified region.
- Fitting the 2022–2025 slope of the delay-corrected ratio against standard thin-disk microlensing models could yield a measurement of the accretion disk's scale radius at the source redshift, a testable prediction that does not require reverberation mapping.
- The same time-delay-pair scheduling could be applied to other wide-separation lensed doubles; if robotic telescopes can maintain the cadence, microlensing chromatic events may become discoverable systematically rather than as rare single-object cases.
- The near-constancy of the line-core ratios while the continuum changes implies the broad-line region is largely unaffected by this caustic; combining continuum and line ratios could allow a clean separation of dust extinction from microlensing in future epochs.
Editorial analysis
A structured set of objections, weighed in public.
Referee Report
Summary. The paper reports long-term spectro-photometric monitoring of the doubly imaged quasar SDSS J1001+5027 with the Liverpool Telescope/SPRAT. Observations are scheduled in pairs separated by the ~119 day time delay, yielding ten delay-corrected B/A spectral flux ratios over 2015–2025. The authors find that the r-band flux ratio has increased monotonically over the last nine years, and that the delay-corrected spectral ratio undergoes a dramatic chromatic change in 2025, with image B becoming brighter and bluer than image A. They interpret this as microlensing-induced chromatic variability, possibly a caustic crossing, and claim an unambiguous detection. Auxiliary spectra from Gemini, Keck, and Subaru are used as cross-checks.
Significance. If the result holds, this would be one of the few clear detections of chromatic microlensing in a gravitationally lensed quasar outside the Einstein Cross, and the time-delay-pair strategy is a promising approach for separating intrinsic variability from microlensing. The paper has real strengths: the observations are designed around the known time delay; the r-band photometric trend is monotonic over a decade; and the constant C III] line-core ratio and the K-band ratio provide useful internal consistency checks. However, the central 2025 chromatic signal sits in the bluest part of the spectrum, exactly where the authors themselves state that the flux calibration is least reliable. The claim of an unambiguous detection is therefore not yet fully supported, and the manuscript needs either additional calibration validation or a more cautious interpretation.
major comments (3)
- [Appendix A.2, Fig. 5]
- [Section 4.2, Fig. 5]
- [Appendix A.2, Figs. A.4–A.5]
minor comments (6)
- [Key words]
- [Throughout]
- [Appendix A.2]
- [Section 5]
- [Section 3]
- [Fig. 2 and Fig. 5]
Circularity Check
No significant circularity: the microlensing chromatic variation is a direct delay-corrected flux-ratio measurement; the main caveat is a blue-edge calibration systematic, not a self-referential derivation.
full rationale
The paper's central claim is a direct observational measurement, not a fitted derivation. The delay-corrected spectral flux ratio (Fig. 5) is obtained by dividing spectra of image A and B taken at epochs separated by the independently measured time delay (Rathna Kumar et al. 2013), and the resulting wavelength-dependent ratios are presented as data. The macrolens baseline of ~0.79 is adopted from C iv and C iii] line-core ratios and an external K-band measurement (Rusu et al. 2016), not fitted to the continuum whose variability is claimed, so the microlensing interpretation is not forced by construction. The self-citations (e.g., Shalyapin & Goicoechea 2014 for extraction, Gil-Merino et al. 2018 for the GLENDAMA project) are methodological or contextual and are not load-bearing for the physical conclusion. The Appendix A.2 limitation about unreliable 1D stellar spectra at the low-sensitivity spectral edges is a genuine systematic uncertainty: the polynomial extrapolation of the response from 4500–7500 Å to the blue edge could conceivably create a spurious chromatic trend. However, this is a calibration artifact risk, not circularity, because the response functions are derived from standard-star observations and are not defined in terms of the B/A ratio being interpreted as microlensing. No equation in the paper reduces the claimed prediction to its own input, and no fitted parameter is renamed as a prediction. Thus the derivation chain is self-contained against external benchmarks, and the score is low.
Assumptions & free parameters
free parameters (3)
- Per-epoch response polynomial coefficients =
night-dependent second-degree polynomial fits (Fig. A.2)
- Per-epoch slit-loss model parameters (Gaussian width sigma and transverse offset delta_y) =
night-dependent values from through-slit acquisition frames and DAR analysis (Figs. A.3-A.5)
- Macrolens flux ratio proxy (~0.79) =
0.761 +/- 0.023 (C IV core), 0.792 +/- 0.014 (C III] core), consistent with K-band 0.787 +/- 0.05
assumptions (5)
- domain assumption Time delay between images A and B is 119.3 +/- 3.3 d (Rathna Kumar et al. 2013)
- domain assumption Quasar optical flux varies negligibly on ~5 d timescales
- domain assumption Differential dust extinction between images is constant over the monitoring period
- domain assumption Emission-line cores (C IV, C III]) are not significantly microlensed and their B/A ratio is time-invariant
- domain assumption Differential atmospheric refraction corrections based on Filippenko (1982) with a circular Gaussian source model are accurate
Cite this review
Pith. "Pith review of SDSS J1001+5027: Strong microlensing-induced chromatic variation caught in the act." pith.science (2026). https://pith.science/paper/AIV3N6U6
@misc{pith2026250902169,
  author       = {Pith},
  title        = {Pith review of: SDSS J1001+5027: Strong microlensing-induced chromatic variation caught in the act},
  year         = {2026},
  howpublished = {\url{https://pith.science/paper/AIV3N6U6}},
  note         = {Machine review of arXiv:2509.02169}
}
abstract
We conducted long-term monitoring of the doubly imaged gravitationally lensed quasar SDSS J1001+5027 consisting of spectro-photometric observations separated by $\sim$120 days (time delay between both quasar images), as well as test and auxiliary data. This monitoring approach allowed us to reliably find a strong microlensing-induced chromatic variation of the quasar continuum in the period 2022$-$2025. The ongoing microlensing event has caused the delay-corrected spectral flux ratio in 2025 to have a dramatic changing look, opening the door to very promising observations of the system in the coming years. These future follow-up observations of such a rare event are expected to provide critical information to discuss, among other things, the structure of the inner accretion flow towards the central supermassive black hole in SDSS J1001+5027.
Figures


Figures from the paper (3 more)


Reference graph
Works this paper leans on
-
[1]
Eigenbrod, A., Courbin, F., Sluse, D., Meylan, G., & Agol, E.\ 2008a, , 480, 647
-
[2]
Eigenbrod, A., Courbin, F., Meylan G., et al.\ 2008b, , 490, 933
- [3]
-
[4]
Fitzpatrick, M., Placco, V., Bolton, A., et al.\ 2024, arXiv e-prints [arXiv:2401.01982]
arXiv 2024
-
[5]
Flewelling, H. A., Magnier, E. A., Chambers, K. C., et al.\ 2020, , 251, 7
work page 2020
-
[6]
Gil-Merino, R., Goicoechea, L. J., Shalyapin, V. N., & Oscoz, A.\ 2018, , 616, A118
work page 2018
-
[7]
Goicoechea, L. J., Artamonov, B. P., Shalyapin, V. N., et al.\ 2020, , 637, A89
work page 2020
-
[8]
Inada, N., Oguri, M., Shin, M.-S., et al.\ 2012, , 143, 119
work page 2012
Show all 26 references
-
[9]
J., Laher, R
Masci, F. J., Laher, R. R., Rusholme, B., et al.\ 2019, , 131, 018003
2019
-
[10]
Misawa, T., Inada, N., Oguri, M., et al.\ 2018, , 854, 69
2018
-
[11]
A., Hamann, F., Capellupo, D
Moravec, E. A., Hamann, F., Capellupo, D. M., et al.\ 2017, , 468, 4539
2017
-
[12]
F., et al.\ 2005, , 622, 106
Oguri, M., Inada, N., Hennawi, J. F., et al.\ 2005, , 622, 106
2005
-
[13]
S., Steele, I
Piascik, A. S., Steele, I. A., Bates, S. D., et al.\ 2014, Proc. SPIE, 9147, 91478H
2014
-
[14]
Prusti, T., de Bruijne, J. H. J., Brown, A. G. A., et al.\ 2016, , 595, A1
2016
-
[15]
S., et al.\ 2013, , 557, A44
Rathna Kumar, S., Tewes, M., Stalin, C. S., et al.\ 2013, , 557, A44
2013
-
[16]
E., Oguri, M., Minowa, Y., et al.\ 2016, , 458, 2
Rusu, C. E., Oguri, M., Minowa, Y., et al.\ 2016, , 458, 2
2016
-
[17]
E., & Smith, R
Schild, R. E., & Smith, R. C.\ 1991, , 101, 813
1991
-
[18]
J., Vernardos, G., Collett, T
Shajib, A. J., Vernardos, G., Collett, T. E., et al.\ 2024, Space Sci. Rev., 220, 87
2024
-
[19]
N., & Goicoechea, L
Shalyapin, V. N., & Goicoechea, L. J.\ 2014, , 568, A116
2014
-
[20]
Sluse, D., Hutsem \'e kers, D., Courbin, F., Meylan, G., & Wambsganss, J.\ 2012, , 544, A62
2012
-
[21]
A., Smith, R
Steele, I. A., Smith, R. J., Rees, P. C., et al.\ 2004, Proc. SPIE, 5489, 679
2004
-
[22]
E., Wilhite, B
Vanden Berk, D. E., Wilhite, B. C., Kron, R. G., et al.\ 2004, , 601, 692
2004
-
[23]
G.\ 2001, , 113, 1420
van Dokkum, P. G.\ 2001, , 113, 1420
2001
-
[24]
Rev., 220, 14
Vernardos, G., Sluse, D., Pooley, D., et al.\ 2024, Space Sci. Rev., 220, 14
2024
-
[25]
Wambsganss, J., & Paczynski B.\ 1991, , 102, 864
1991
-
[26]
Yonehara, A., Hirashita, H., & Richter, P.\ 2008, , 478, 95
2008
Reviewed August 5, 2026 · model on record in the stance chip above.
Discussion (0). Continue with ORCID to comment.