REVIEW 2 major objections 5 minor 208 references
Visualising Geographically-Embedded Origin-Destination Flows: in 2D and immersive environments
T0 review · 2 major / 5 minor · reviewed 2026-08-14 · deepseek-v4-flash
Pith's one-line read This thesis sets out to establish that a hybrid OD-matrix-and-map visualisation called MapTrix combines the scalability of matrices with the geographic context of flow maps, and that in controlled studies it matches OD Maps and beats…
desk verdict A solid thesis with a real MapTrix contribution; the one caveat worth checking is the untested highlighting aid in the regional-flow scalability study. read the letter →
The pith
A machine-rendered reading of the paper's core claim, the machinery that carries it, and where it could break.
The reading
What carries the argument
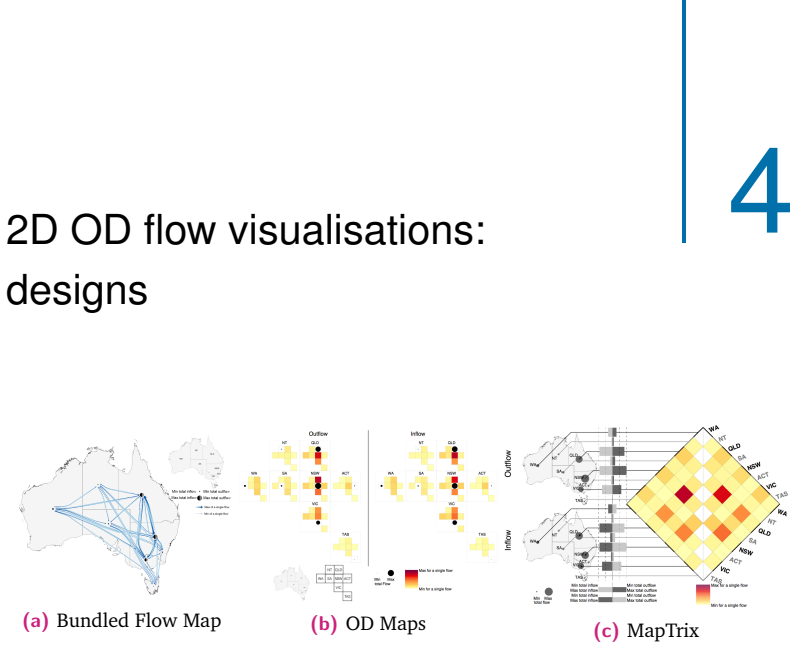
The load-bearing object is MapTrix itself: an OD matrix whose rows and columns share the same ordering, flanked by an origin map and a destination map, with every map location connected to its matrix row or column by a leader line. The crossing-free leader-line layout comes from a one-sided boundary labelling model, refined by a quadratic program that repositions connection sites within region boundaries to maximise separation between adjacent leaders. That machinery is what lets MapTrix show every pairwise flow as a matrix cell while keeping undistorted geographic context, and it is fast enough to re-layout dense datasets interactively, in the order of milliseconds for 51 locations. In the immersive thread, the equivalent machinery is the orthogonal decomposition of flow-map design into flow encoding and geographic reference-space encoding.
What would settle it
Run the second user study's regional-flow tasks without the added highlighting for both representations, or remove highlighting for only one: if accuracy or response time diverges substantially between MapTrix and OD Maps, the claim that the two methods scale equally for regional-flow tasks is wrong. A simpler version is a within-subject comparison of each method with highlighting on and off, using the same 34- and 51-location datasets.
Extended reading notes
Core claim
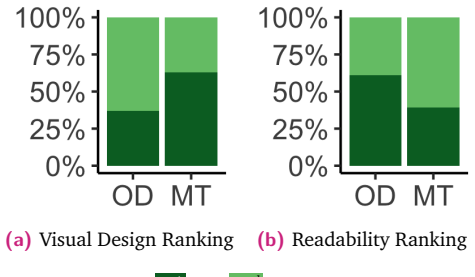
The central claim is that MapTrix overcomes the clutter associated with a traditional flow map while providing geographic embedding that standard OD matrices omit. The thesis supports this with two quantitative user studies: in the first, MapTrix and OD Maps had very similar task performance, both much better than a bundled flow map, and participants ranked MapTrix first for design and readability; in the second, on larger datasets with up to 51 locations, MapTrix and OD Maps continued to perform similarly for single-flow and total-flow tasks, with regional-flow tasks feasible only after highlighting was added. For immersive environments, the thesis claims that an exocentric globe supports distance, area, and direction tasks at least as well as flat maps, egocentric globes, or curved maps, and it proposes and evaluates flow encodings and a linked flat-map design called MapsLink for OD flows in VR.
Load-bearing premise
The regional-flow comparison assumes that highlighting selected regions helps MapTrix and OD Maps equally, because without that highlighting, added after pilots made the tasks nearly impossible, neither method gave users a workable way to aggregate flows.
Editorial extensions
If this is right
- Dense many-to-many OD data at 16 to 51 locations is better served by MapTrix or OD Maps than by bundled flow maps for single-flow and total-flow reading tasks.
- MapTrix can be preferred over OD Maps on design grounds while matching its accuracy, so geographic embedding does not have to be sacrificed to get matrix scalability.
- Country shape and prior geographic knowledge are not decisive for these visualisations, since elongated and compact countries performed similarly and knowledge effects were inconsistent.
- Regional-flow aggregation remains the hard case for static matrix-based representations; making it work at scale requires interactive highlighting, which the thesis then implements as a prototype interaction.
- In immersive VR, an exocentric globe is a robust default for basic geographic tasks such as comparing distances and areas and estimating direction.
Reading between the lines
- The crossing-free leader-line layout is not specific to OD matrices; the same mechanism could link a map to any tabular view such as a heatmap, a temporal series, or a scatterplot, so the method may generalise to other paired spatial-and-abstract views.
- The highlighting dependence uncovered in the pilots suggests that static MapTrix and OD Maps do not truly scale to regional aggregation on their own; interactive highlighting is a required component, not a polish layer.
- The immersive finding that an exocentric globe beat an egocentric globe hints that familiarity and a stable reference frame matter more than immersion or minimal perceptual distortion for analytic geography tasks in VR.
- A testable extension would be to run the same MapTrix-versus-OD-Maps comparison with highlighting available on demand as an interaction rather than baked into the stimuli, to see whether the equal-performance result survives.
Signed reviews
Editorial analysis
A structured set of objections, weighed in public.
Referee Report
Summary. This PhD thesis develops and evaluates visualisations for geographically embedded origin-destination (OD) flows in both 2D and immersive environments. It introduces MapTrix, a hybrid of an OD matrix and a flow map connected by crossing-free leader lines, and compares it against bundled flow maps and OD Maps in two online user studies at scales from 8 to 51 locations. In immersive environments, the thesis explores geographic reference representations (exocentric globe, flat map, egocentric globe, curved map) in VR and then studies different flow encodings and combinations such as MapsLink, each evaluated with controlled user studies. The central claims are that MapTrix overcomes flow-map clutter while retaining geographic context, that MapTrix and OD Maps perform similarly and much better than bundled flow maps for dense many-to-many flows, and that an exocentric globe is generally the best geographic reference in VR for the tested spatial tasks.
Significance. If the results hold, this is one of the first quantitative evaluations of dense many-to-many OD flow visualisations and a systematic exploration of the immersive design space. The work has real strengths: it uses publicly available migration data, runs multiple controlled studies with standard non-parametric statistics, reports pilot-driven design changes transparently, and makes concrete design recommendations for both 2D and VR systems. The main risk is that the second 2D study's conclusion about equal scalability for regional-flow tasks rests on an untested assumption about the symmetry of a highlighting aid across MapTrix and OD Maps.
major comments (2)
- [§5.4.3 and §5.4.4] The conclusion that MapTrix and OD Maps scale equally well for regional-flow tasks at 34 and 51 locations rests on an unvalidated assumption. Section 5.4.3 states: “our assumption is that such simple highlighting is easily made available with interaction,” but no experiment or analysis tests whether highlighting is symmetric across the two representations. In MapTrix, highlighting must trace leaders from map regions to matrix rows and columns; in OD Maps, it highlights constituent cells of a spatial treemap. These are perceptually different operations. Moreover, the actual MapTrix interaction implemented in Section 5.5 goes beyond static highlighting: aggregate selection triggers a re-layout of the matrix and leaders (Figs. 5.11–5.12), so the implemented system is not exactly what was tested. If the highlighting aid compensates for MapTrix’s leader-tracing difficulty more than it helps OD Maps, the “very similar” RF performance observed in Fig. 5.6 could be an artifact of the aid rather than evidence of equal scalability. I recommend either adding a controlled comparison with the implemented interactions, or explicitly restricting the scalability claim to static highlighted representations and discussing the asymmetry risk in the limitations.
- [§5.2.5] The statistical analysis description is internally ambiguous. The text says “we treat all conditions as being independent” but then uses Friedman’s ANOVA and Wilcoxon signed-rank tests, which are repeated-measures procedures that require the same participants across conditions. This makes it unclear whether participant-level clustering was properly accounted for in the first study’s reported p-values. Please clarify whether the reported tests are fully within-subjects or whether some comparisons pool across different participants, and adjust the wording accordingly.
minor comments (5)
- [§2.3] There is a typo: “specalising” should be “specialising.”
- [§2.7.2] The phrase “like weather, like weather” repeats “like weather”; please remove the duplication.
- [§4.3.2] The leader-placement quadratic program includes a weight w in PCentre + w(PSep), but the manuscript does not report the chosen value of w or any sensitivity analysis. Please state how w was set for the MapTrix stimuli used in the studies.
- [§5.4.3] The sentence introducing the highlighting assumption would be stronger if it also appeared in the Limitations or Discussion: because the implemented interaction in Section 5.5 performs re-layout in addition to highlighting, the static study in Section 5.4 does not directly validate the interactive system.
- [§5.4.4] The response-time comparison for RF subtasks (RFB vs RFW, p = 0.0404) is reported without a multiple-comparison correction even though six RF subtasks are compared; please state whether correction was applied.
Circularity Check
No circularity: the thesis evaluates novel visualisations against external baselines in controlled user studies; no derivation reduces to its own inputs.
full rationale
This thesis is an empirical design-study dissertation, not a formal derivation. The central claims about MapTrix and the immersive visualisations are supported by controlled user studies in which MapTrix is compared with baseline techniques from other research groups: the bundled flow map follows Pupyrev et al. [151] and OD Maps follows Wood et al. [197], with the OD Maps layout discussed with the original authors. MapTrix is a newly proposed hybrid, and its leader-line placement algorithm is a quadratic program built on the boundary labelling model of Bekos et al.; the algorithm does not assume the task-performance results. The headline findings are statistical comparisons of accuracy and response time, e.g. 'MapTrix and OD Maps had very similar task performance which was much better than with the bundled flow map.' These are empirical outcomes, not quantities reconstructed from fitted parameters or from self-citations. The self-referential element is that the authors designed the visualisations they evaluated, which is standard in visualisation research and not a circularity in the sense of a derivation reducing to its input. The one methodological concern—the highlighting aid introduced in the second study after pilots (Section 5.4.3)—is a potential threat to internal validity for the regional-flow comparison, because the paper states 'our assumption is that such simple highlighting is easily made available with interaction' without testing symmetry of the aid across MapTrix and OD Maps. However, this is a limitation of an empirical comparison, not a case of a prediction being equivalent to its input by construction or of a load-bearing claim resting wholly on a self-citation. The paper even reports that RF tasks were 'very difficult' for both representations, which qualifies rather than conceals the finding. No equation or fitted parameter is silently reused as an output, and no uniqueness theorem or prior result by the same authors is invoked to force a choice. Therefore the appropriate circularity score is 0.
Assumptions & free parameters
free parameters (1)
- w (leader separation weight) =
not fitted; user-tunable
assumptions (5)
- domain assumption The SF, TF, RF task abstraction covers the important analytical tasks for OD flow data.
- domain assumption Performance on the synthetic, time-limited tasks transfers to real-world analytic performance.
- domain assumption The Hammer projection and Natural Earth basemap are appropriate representations for the geographic tasks.
- domain assumption User studies with self-selected participants are representative of the target analyst population.
- standard math Standard statistical tests (Friedman, Wilcoxon, LME ANOVA) correctly model the within-subject design.
Cite this review
Pith. "Pith review of Visualising Geographically-Embedded Origin-Destination Flows: in 2D and immersive environments." pith.science (2026). https://pith.science/paper/ATLZPJV7
@misc{pith2026190800662,
  author       = {Pith},
  title        = {Pith review of: Visualising Geographically-Embedded Origin-Destination Flows: in 2D and immersive environments},
  year         = {2026},
  howpublished = {\url{https://pith.science/paper/ATLZPJV7}},
  note         = {Machine review of arXiv:1908.00662}
}
read the original abstract
This thesis develops and evaluates effective techniques for visualisation of flows (e.g. of people, trade, knowledge) between places on geographic maps. This geographically-embedded flow data contains information about geographic locations, and flows from origin locations to destination locations. We explored the design space of OD flow visualisation in both 2D and immersive environments. We do so by creating novel OD flow visualisations in both environments, and then conducting controlled user studies to evaluate different designs.
Figures


Figures from the paper (70 more)













Reference graph
Works this paper leans on
-
[1]
Quantifying Global International Migration Flows
Guy J Abel and Nikola Sander. “Quantifying Global International Migration Flows”. In: Science 343.6178 (Mar. 2014), pp. 1520–1522 (cit. on p. 119)
2014
-
[2]
EvalBench: A Software Library for Visualization Evaluation
Wolfgang Aigner, Stephan Hoffmann, and Alexander Rind. “EvalBench: A Software Library for Visualization Evaluation”. In:Computer Graphics Forum32 (2013), pp. 41– 50 (cit. on p. 150)
2013
-
[3]
A General Framework for Using Aggre- gation in Visual Exploration of Movement Data
Gennady Andrienko and Natalia Andrienko. “A General Framework for Using Aggre- gation in Visual Exploration of Movement Data”. In:The Cartographic Journal 47.1 (July 2013), pp. 22–40 (cit. on p. 150)
2013
-
[4]
Visual Analytics of Movement
Gennady Andrienko, Natalia Andrienko, Peter Bak, Daniel Keim, and Stefan Wrobel. Visual Analytics of Movement. Berlin, Heidelberg: Springer Berlin Heidelberg, 2013 (cit. on p. 150)
2013
-
[5]
Space, time and visual analytics
Gennady Andrienko, Natalia Andrienko, Urska Demsar, et al. “Space, time and visual analytics”. In:International Journal of Geographical Information Science 24.10 (Oct. 2010), pp. 1577–1600 (cit. on pp. 2, 38)
2010
-
[6]
Clustering Trajectories by Relevant Parts for Air Traffic Analysis
Gennady Andrienko, Natalia Andrienko, Georg Fuchs, and Jose Manuel Cordero Garcia. “Clustering Trajectories by Relevant Parts for Air Traffic Analysis”. In:IEEE Transactions on Visualization and Computer Graphics 24.1 (2017), pp. 34–44 (cit. on p. 150)
2017
-
[7]
Revealing Patterns and Trends of Mass Mobility Through Spatial and Temporal Abstraction of Origin-Destination Movement Data
Gennady Andrienko, Natalia Andrienko, Georg Fuchs, and Jo Wood. “Revealing Patterns and Trends of Mass Mobility Through Spatial and Temporal Abstraction of Origin-Destination Movement Data”. In: IEEE Transactions on Visualization and Computer Graphics 23.9 (2017), pp. 2120–2136 (cit. on p. 149)
2017
-
[8]
A visual analytics framework for spatio- temporal analysis and modelling
Natalia Andrienko and Gennady Andrienko. “A visual analytics framework for spatio- temporal analysis and modelling”. In: Data Mining and Knowledge Discovery 27.1 (Aug. 2012), pp. 55–83 (cit. on p. 150)
2012
Show all 208 references
-
[9]
Exploratory Analysis of Spatial and Temporal Data
Natalia Andrienko and Gennady Andrienko. Exploratory Analysis of Spatial and Temporal Data. A Systematic Approach. Berlin/Heidelberg: Springer-Verlag, 2006 (cit. on pp. 64, 150)
2006
-
[10]
Spatial Generalization and Aggregation of Massive Movement Data
Natalia Andrienko and Gennady Andrienko. “Spatial Generalization and Aggregation of Massive Movement Data”. In: IEEE Transactions on Visualization and Computer Graphics 17.2 (Feb. 2010), pp. 205–219 (cit. on p. 150). 153
2010
-
[11]
Natalia Andrienko and Gennady Andrienko. “Tasks”. In: Exploratory Analysis of Spatial and Temporal Data. Berlin/Heidelberg: Springer Berlin Heidelberg, 2006, pp. 47–161 (cit. on p. 34)
2006
-
[12]
Space Transformation for Understanding Group Movement
Natalia Andrienko, Gennady Andrienko, Louise Barrett, Marcus Dostie, and Peter Henzi. “Space Transformation for Understanding Group Movement”. In:IEEE Trans- actions on Visualization and Computer Graphics 19.12 (2013), pp. 2169–2178 (cit. on p. 150)
2013
-
[13]
Analysis of Flight Variability: a Systematic Approach
Natalia Andrienko, Gennady Andrienko, Jose Manuel Cordero Garcia, and David Scarlatti. “Analysis of Flight Variability: a Systematic Approach.” In:IEEE Transactions on Visualization and Computer Graphics to appear (Aug. 2018) (cit. on p. 150)
2018
-
[14]
A GIS-based decision support system for planning urban transportation policies
George Arampatzis, Chris T Kiranoudis, P Scaloubacas, and Dionysis Assimacopoulos. “A GIS-based decision support system for planning urban transportation policies”. In: European Journal of Operational Research 152.2 (Jan. 2004), pp. 465–475 (cit. on p. 84)
2004
-
[15]
Immersive Analytics: Exploring Future Interaction and Visualization Technologies for Data Analytics
Benjamin Bach, Raimund Dachselt, Sheelagh Carpendale, et al. “Immersive Analytics: Exploring Future Interaction and Visualization Technologies for Data Analytics”. In: the 2016 ACM International Conference on Interactive Surfaces and Spaces. ACM, Nov. 2016, pp. 529–533 (cit. on p. 48)
2016
-
[16]
Towards Unambiguous Edge Bundling: Investigating Confluent Drawings for Network Visualization
Benjamin Bach, Nathalie Henry Riche, Christophe Hurter, Kim Marriott, and Tim Dwyer. “Towards Unambiguous Edge Bundling: Investigating Confluent Drawings for Network Visualization”. In:IEEE Transactions on Visualization and Computer Graphics 23.1 (2016), pp. 541–550 (cit. on p. 42)
2016
-
[17]
Area Estimation of World Regions and the Projection of the Global-Scale Cognitive Map
Sarah E Battersby and Daniel R Montello. “Area Estimation of World Regions and the Projection of the Global-Scale Cognitive Map”. In: Annals of the Association of American Geographers 99.2 (Apr. 2009), pp. 273–291 (cit. on p. 90)
2009
-
[18]
Immersive Group-to-Group Telepresence
Stephan Beck, Andre Kunert, Alexander Kulik, and Bernd Froehlich. “Immersive Group-to-Group Telepresence”. In:IEEE Transactions on Visualization and Computer Graphics 19.4 (2013), pp. 616–625 (cit. on p. 50)
2013
-
[19]
Studying commuting behaviours using collaborative visual analytics
Roger Beecham, Jo Wood, and Audrey Bowerman. “Studying commuting behaviours using collaborative visual analytics”. In: Computers, Environment and Urban Systems 47 (Sept. 2014), pp. 5–15 (cit. on p. 24)
2014
-
[20]
Explorative Blood Flow Visualization using Dynamic Line Filtering based on Surface Features
Benjamin Behrendt, Philipp Berg, Oliver Beuing, Bernhard Preim, and Sylvia Saalfeld. “Explorative Blood Flow Visualization using Dynamic Line Filtering based on Surface Features”. In:Computer Graphics Forum 37.3 (June 2018), pp. 183–194 (cit. on p. 5)
2018
-
[21]
Boundary Labeling with Octilinear Leaders
Michael A Bekos, Michael Kaufmann, Martin Nöllenburg, and Antonios Symvonis. “Boundary Labeling with Octilinear Leaders”. In: Algorithmica 57.3 (Feb. 2009), pp. 436–461 (cit. on p. 54)
2009
-
[22]
Boundary labeling: Models and efficient algorithms for rectangular maps
Michael A Bekos, Michael Kaufmann, and Antonios Symvonis. “Boundary labeling: Models and efficient algorithms for rectangular maps”. In: Computational Geometry 36.3 (Apr. 2007), pp. 215–236 (cit. on p. 54)
2007
-
[23]
Boundary Labeling with Octilinear Leaders and Minimum Number of Leader-Bends
Michael A Bekos and Anronios Symvonis. “Boundary Labeling with Octilinear Leaders and Minimum Number of Leader-Bends”. In: International conference on applied computer science. 2010, pp. 208–213 (cit. on p. 54). 154 Chapter 8 References
2010
-
[24]
Semiologie graphique: les diagrammes, les rŽseaux, les cartes
Jacques Bertin. Semiologie graphique: les diagrammes, les rŽseaux, les cartes. La Haye, Mouton; Gauthier-Villars, 1967 (cit. on pp. 43, 44)
1967
-
[25]
Tracking apex marine predator movements in a dynamic ocean
Barbara A Block, Ian D Jonsen, Salvador J Jorgensen, et al. “Tracking apex marine predator movements in a dynamic ocean”. In: Nature 475.7354 (July 2011), pp. 86– 90 (cit. on p. 90)
2011
-
[26]
Motion Sickness Symptoms in a Ship Motion Simulator: Effects of Inside, Outside and No View
Jelte E Bos, Scott N MacKinnon, and Anthony Patterson. “Motion Sickness Symptoms in a Ship Motion Simulator: Effects of Inside, Outside and No View”. In: Aviation Space and Environmental Medicine 76.12 (Jan. 2006), pp. 1111–8 (cit. on p. 88)
2006
-
[27]
Code as Cartography
Michael Bostock and Jason Davies. “Code as Cartography”. In: The Cartographic Journal 50.2 (Nov. 2013), pp. 129–135 (cit. on pp. 87, 89)
2013
-
[28]
Clustered edge routing
Quirijn W Bouts. “Clustered edge routing”. In:2015 IEEE Pacific Visualization Sympo- sium (PacificVis). IEEE, 2015, pp. 55–62 (cit. on pp. 42, 52)
2015
-
[29]
Visual Encoding of Dissimilarity Data via Topology-Preserving Map Deformation
Quirijn W Bouts, Tim Dwyer, Jason Dykes, et al. “Visual Encoding of Dissimilarity Data via Topology-Preserving Map Deformation”. In:IEEE Transactions on Visualiza- tion and Computer Graphics 22.9 (2015), pp. 2200–2213 (cit. on p. 28)
2015
-
[30]
Flowstrates: An Ap- proach for Visual Exploration of Temporal Origin-Destination Data
Ilya Boyandin, Enrico Bertini, Peter Bak, and Denis Lalanne. “Flowstrates: An Ap- proach for Visual Exploration of Temporal Origin-Destination Data”. In:Computer Graphics Forum 30.3 (June 2011), pp. 971–980 (cit. on pp. 45, 115, 149)
2011
-
[31]
A Qualitative Study on the Explo- ration of Temporal Changes in Flow Maps with Animation and Small-Multiples
Ilya Boyandin, Enrico Bertini, and Denis Lalanne. “A Qualitative Study on the Explo- ration of Temporal Changes in Flow Maps with Animation and Small-Multiples”. In: 31.3pt2 (June 2012), pp. 1005–1014 (cit. on p. 148)
2012
-
[32]
A Multi-Level Typology of Abstract Visual- ization Tasks
Matthew Brehmer and Tamara Munzner. “A Multi-Level Typology of Abstract Visual- ization Tasks”. In:IEEE Transactions on Visualization and Computer Graphics 19.12 (2013), pp. 2376–2385 (cit. on p. 16)
2013
-
[33]
Coefficient of Variation
Charles E Brown. “Coefficient of Variation”. In: Applied Multivariate Statistics in Geohydrology and Related Sciences. Berlin, Heidelberg: Springer, Berlin, Heidelberg, 1998, pp. 155–157 (cit. on p. 91)
1998
-
[34]
Challenges and approaches for the visualization of movement trajectories in 3D geovirtual environments
Stefan Buschmann, Matthias Trapp, and Jürgen Döllner. “Challenges and approaches for the visualization of movement trajectories in 3D geovirtual environments”. In: Proc. GIScience Workshop on GeoVisual Analytics–Time to Focus on Time. Vol. 11. 2012 (cit. on p. 48)
2012
-
[35]
Clusters, Trends, and Outliers: How Immersive Technologies Can Facilitate the Collaborative Analysis of Multidimensional Data
Simon Butscher, Sebastian Hubenschmid, Jens Müller, Johannes Fuchs, and Harald Reiterer. “Clusters, Trends, and Outliers: How Immersive Technologies Can Facilitate the Collaborative Analysis of Multidimensional Data”. In:the 2018 CHI Conference on Human Factors in Computing Sy...
2018
-
[36]
The Earth is flat when personally significant experiences with the sphericity of the Earth are absent
Claus-Christian Carbon. “The Earth is flat when personally significant experiences with the sphericity of the Earth are absent”. In:Cognition 116.1 (July 2010), pp. 130– 135 (cit. on p. 90)
2010
-
[37]
Readings in information visualization: using vision to think
Stuart K Card, Jock D Mackinlay, and Ben Shneiderman. Readings in information visualization: using vision to think . Morgan Kaufmann Publishers Inc., Jan. 1999 (cit. on p. 38). 155
1999
-
[38]
The Psychology of Human- Computer Interaction
Stuart K Card, Allen Newell, and Thomas P Moran. The Psychology of Human- Computer Interaction. L. Erlbaum Associates Inc., Jan. 1983 (cit. on p. 39)
1983
-
[39]
Immersive Analytics
Tom Chandler, Maxime Cordeil, Tobias Czauderna, et al. “Immersive Analytics”. In: 2015 Big Data Visual Analytics (BDVA). IEEE, 2015, pp. 1–8 (cit. on p. 48)
2015
-
[40]
A Novel Interface for Interactive Explo- ration of DTI Fibers
Wei Chen, Zi’ang Ding, Song Zhang, et al. “A Novel Interface for Interactive Explo- ration of DTI Fibers”. In:IEEE Transactions on Visualization and Computer Graphics 15.6 (2009), pp. 1433–1440 (cit. on p. 5)
2009
-
[41]
Final Report, Vol I, Survey Findings
Chicago Area Transportation Study. Final Report, Vol I, Survey Findings. 1959 (cit. on p. 40)
1959
-
[42]
Visual exploration of (French) commuter networks
Yves Chiricota, Guy Melancon, Trung Tien Phan Quang, and Patrice Tissandier. “Visual exploration of (French) commuter networks”. In:Geovisualization of Dynamics, Movement, and Change AGILE’08 Satellite Workshop. 2008 (cit. on p. 1)
2008
-
[43]
Global monitoring of air pollution over land from the Earth Observing System-Terra Moderate Resolution Imaging Spectrora- diometer (MODIS)
D Allen Chu, YJ Kaufman, G Zibordi, et al. “Global monitoring of air pollution over land from the Earth Observing System-Terra Moderate Resolution Imaging Spectrora- diometer (MODIS)”. In:Journal of Geophysical Research: Atmospheres 108.D21 (Nov. 2003), pp. 32, 141 (cit. on p. 90)
2003
-
[44]
VisLink: Revealing Relationships Amongst Visualizations
Christopher Collins and Sheelagh Carpendale. “VisLink: Revealing Relationships Amongst Visualizations”. In:IEEE Transactions on Visualization and Computer Graphics 13.6 (2007), pp. 1192–1199 (cit. on p. 115)
2007
-
[45]
Exploration et exploitation de l’espace de conception des transi- tions animées en visualisation d’information
Maxime Cordeil. “Exploration et exploitation de l’espace de conception des transi- tions animées en visualisation d’information”. PhD thesis. LII - ENAC - Laboratoire d’Informatique Interactive: Institut Supérieur de l’Aéronautique et de l’Espace (ISAE), Dec. 2013 (cit. on p. 33)
2013
-
[46]
IATK: Immersive Analytics Toolkit
Maxime Cordeil. IATK: Immersive Analytics Toolkit. https://github.com/MaximeCordeil/ IATK. 2018 (cit. on p. 144)
2018
-
[47]
De- sign space for spatio-data coordination: Tangible interaction devices for immersive information visualisation
Maxime Cordeil, Benjamin Bach, Yongchao Li, Elliott Wilson, and Tim Dwyer. “De- sign space for spatio-data coordination: Tangible interaction devices for immersive information visualisation”. In: 2017 IEEE Pacific Visualization Symposium (PacificVis). IEEE, 2017, pp. 46–50 (cit....
2017
-
[48]
ImAxes: Immersive Axes as Embodied Affordances for Interactive Multivariate Data Visualisation
Maxime Cordeil, Andrew Cunningham, Tim Dwyer, Bruce H Thomas, and Kim Mar- riott. “ImAxes: Immersive Axes as Embodied Affordances for Interactive Multivariate Data Visualisation”. In:the 30th Annual ACM Symposium on User Interface Software and Technology. Oct. 2017, pp. 71–83 ...
2017
-
[49]
Immersive solutions for future Air Traffic Control and Management
Maxime Cordeil, Tim Dwyer, and Christophe Hurter. “Immersive solutions for future Air Traffic Control and Management”. In:the 2016 ACM Companion on Interactive Surfaces and Spaces. New York, New York, USA: ACM, Nov. 2016, pp. 25–31 (cit. on pp. 31, 33)
2016
-
[50]
Immersive Collaborative Analysis of Network Connectivity: CAVE-style or Head-Mounted Display?
Maxime Cordeil, Tim Dwyer, Karsten Klein, et al. “Immersive Collaborative Analysis of Network Connectivity: CAVE-style or Head-Mounted Display?” In: IEEE Trans- actions on Visualization and Computer Graphics 23.1 (2016), pp. 441–450 (cit. on pp. 50, 85, 112). 156 Chapter 8 References
2016
-
[51]
Assess- ing and improving 3D rotation transition in dense visualizations
Maxime Cordeil, Christophe Hurter, Stéphane Conversy , and Mickaël Causse. “Assess- ing and improving 3D rotation transition in dense visualizations”. In:th International BCS Human Computer Interaction Conference. British Computer Society , Sept. 2013, p. 7 (cit. on pp. 48, 144)
2013
-
[52]
Case study: 3D displays of Internet traffic
Kenneth C Cox and Stephen G Eick. “Case study: 3D displays of Internet traffic”. In: Visualization 1995 Conference. IEEE, 1995, pp. 129–131 (cit. on pp. 47, 115)
1995
-
[53]
3D geographic network displays
Kenneth C Cox, Stephen G Eick, and Taosong He. “3D geographic network displays”. In: ACM SIGMOD Record 25.4 (Dec. 1996), pp. 50–54 (cit. on p. 47)
1996
-
[54]
Geometry- based edge clustering for graph visualization
Weiwei Cui, Hong Zhou, Huamin Qu, Pak Chung Wong, and Xiaoming Li. “Geometry- based edge clustering for graph visualization.” In: IEEE Transactions on Visualization and Computer Graphics 14.6 (Nov. 2008), pp. 1277–1284 (cit. on p. 42)
2008
-
[55]
Rotate the World
Jason Davies. Rotate the World. https://www.jasondavies.com/maps/rotate/ . 2013 (cit. on p. 89)
2013
-
[56]
Supervised Force Directed Algorithm for the Generation of Flow Maps
Alberto Debiasi, Bruno Simões, and Raffaele De Amicis. “Supervised Force Directed Algorithm for the Generation of Flow Maps”. In:International Conference on Computer Graphics, Visualization and Computer Vision. June 2014 (cit. on p. 41)
2014
-
[57]
Globes in Renaissance Europe
Elly Dekker. “Globes in Renaissance Europe”. In:The History of Cartography: Volume 3–Cartography in the European Renaissance (Part 1) . University of Chicago Press, 2007, pp. 135–173 (cit. on p. 84)
2007
-
[58]
The Teardown: HTC Vive virtual reality headset
Paul Dempsey. “The Teardown: HTC Vive virtual reality headset”. In:Engineering & Technology 11.7 (Aug. 2016), pp. 80–81 (cit. on p. 92)
2016
-
[59]
Cartography: Thematic Map Design
Borden D Dent, Jeffrey S Torguson, and Thomas W Hodler. Cartography: Thematic Map Design. 6th ed. New York: McGraw-Hill, 2008 (cit. on p. 43)
2008
-
[60]
2D and 3D presentation of spatial data: A systematic review
Steve Dübel, Martin Röhlig, Heidrun Schumann, and Matthias Trapp. “2D and 3D presentation of spatial data: A systematic review”. In:2014 IEEE VIS International Workshop on 3DVis (3DVis). IEEE, 2014, pp. 11–18 (cit. on pp. 7, 45, 48, 84, 113, 114)
2014
-
[61]
In Situ Distribution Guided Analysis and Visualization of Transonic Jet Engine Simulations
Soumya Dutta, Chun-Ming Chen, Gregory Heinlein, Han-Wei Shen, and Jen-Ping Chen. “In Situ Distribution Guided Analysis and Visualization of Transonic Jet Engine Simulations”. In: IEEE Transactions on Visualization and Computer Graphics 23.1 (2016), pp. 811–820 (cit. on p. 5)
2016
-
[62]
Immersive Analytics (Dagstuhl Seminar 16231)
Tim Dwyer, Nathalie Henry Riche, Karsten Klein, Wolfgang Stuerzlinger, and Bruce Thomas. “Immersive Analytics (Dagstuhl Seminar 16231)”. In: Dagstuhl Reports. Vol. 6. 6. Schloss Dagstuhl-Leibniz-Zentrum fuer Informatik. 2016 (cit. on p. 48)
2016
-
[63]
Aspects of Network Visualization
Stephen G. Eick. “Aspects of Network Visualization”. In:IEEE Computer Graphics and Applications 16 (1996), pp. 69–72 (cit. on p. 47)
1996
-
[64]
Aspects of network visualization
Stephen G. Eick. “Aspects of network visualization”. In:IEEE Computer Graphics and Applications 16.2 (Mar. 1996), pp. 69–72 (cit. on p. 115)
1996
-
[65]
Situated Analytics
Neven ElSayed, Bruce Thomas, Kim Marriott, Julia Piantadosi, and Ross Smith. “Situated Analytics”. In:2015 Big Data Visual Analytics (BDVA). IEEE, 2015, pp. 1–8 (cit. on p. 85). 157
2015
-
[66]
Sit- uated analytics: Demonstrating immersive analytical tools with augmented reality
Neven ElSayed, Bruce Thomas, Kim Marriott, Julia Piantadosi, and Ross Smith. “Sit- uated analytics: Demonstrating immersive analytical tools with augmented reality”. In: Journal of Visual Languages & Computing 36 (2016), pp. 13–23 (cit. on pp. 50, 112, 143)
2016
-
[67]
Multivariate Network Exploration and Presentation: From Detail to Overview via Selections and Aggregations
Stef van den Elzen and Jarke J Van Wijk. “Multivariate Network Exploration and Presentation: From Detail to Overview via Selections and Aggregations”. In: IEEE Transactions on Visualization and Computer Graphics 20.12 (Dec. 2014), pp. 2310– 2319 (cit. on p. 43)
2014
-
[68]
Skeleton-based edge bundling for graph visualization
Ozan Ersoy, Christophe Hurter, Fernando V Paulovich, Gabriel Cantareiro, and Alexandru Telea. “Skeleton-based edge bundling for graph visualization.” In:IEEE Transactions on Visualization and Computer Graphics 17.12 (Dec. 2011), pp. 2364– 2373 (cit. on p. 42)
2011
-
[69]
Knowledge-based augmented reality
Steven Feiner, Blair Macintyre, and Dorée Seligmann. “Knowledge-based augmented reality”. In:Communications of the ACM 36.7 (July 1993), pp. 53–62 (cit. on pp. 91, 119)
1993
-
[70]
Overlay- ing Graph Links on Treemaps
Jean-Daniel Fekete, David Wang, Niem Dang, and Catherine Plaisant. “Overlay- ing Graph Links on Treemaps”. In: IEEE Symposium on Information Visualization Conference. 2003 (cit. on p. 43)
2003
-
[71]
Discovering Statistics Using R
Andy Field, Jeremy Miles, and Zoë Field. Discovering Statistics Using R. SAGE Publi- cations, 2012 (cit. on pp. 67, 122)
2012
-
[72]
Reasoning about geography
Alinda Friedman and Norman R Brown. “Reasoning about geography”. In:Journal of Experimental Psychology: Learning, Memory, and Cognition129.2 (2000), pp. 193–219 (cit. on p. 90)
2000
-
[73]
Global-scale location and distance esti- mates: Common representations and strategies in absolute and relative judgments
Alinda Friedman and Daniel R Montello. “Global-scale location and distance esti- mates: Common representations and strategies in absolute and relative judgments”. In: Journal of Experimental Psychology: Learning, Memory, and Cognition 32.2 (2006), pp. 333–346 (cit. on p. 90)
2006
-
[74]
Multilevel agglomerative edge bundling for visualizing large graphs
Emden R Gansner, Yifan Hu, Stephen North, and Carlos Scheidegger. “Multilevel agglomerative edge bundling for visualizing large graphs”. In: 2011 IEEE Pacific Visualization Symposium (PacificVis). IEEE, 2011, pp. 187–194 (cit. on p. 42)
2011
-
[75]
A Comparison of the Readability of Graphs Using Node-Link and Matrix-Based Representations
Mohammad Ghoniem, Jean-Daniel Fekete, and Philippe Castagliola. “A Comparison of the Readability of Graphs Using Node-Link and Matrix-Based Representations”. In: IEEE Symposium on Information Visualization (2004), pp. 17–24 (cit. on pp. 44, 63)
2004
-
[76]
Cattle movements and bovine tuberculosis in Great Britain
Marius Gilbert, Andy Mitchell, David Bourn, et al. “Cattle movements and bovine tuberculosis in Great Britain”. In:Nature 435.7041 (May 2005), pp. 491–496 (cit. on p. 1)
2005
-
[77]
Google Earth VR
Google. Google Earth VR. https://vr.google.com/earth/ . 2018 (cit. on pp. 47, 85)
2018
-
[78]
The world- wide air transportation network: Anomalous centrality, community structure, and cities’ global roles
Roger Guimerà, Stefano Mossa, Adrian Turtschi, and LA Nunes Amaral. “The world- wide air transportation network: Anomalous centrality, community structure, and cities’ global roles”. In:Proceedings of the National Academy of Sciences 102.22 (May 2005), pp. 7794–7799 (cit. on p...
2005
-
[79]
Visual analytics of spatial interaction patterns for pandemic decision support
Diansheng Guo. “Visual analytics of spatial interaction patterns for pandemic decision support”. In: International Journal of Geographical Information Science 21.8 (Sept. 2007), pp. 859–877 (cit. on pp. 1, 56)
2007
-
[80]
What about people in regional science?
Torsten Hägerstrand. “What about people in regional science?” In: Papers of the Regional Science Association. Vol. 24. 1. Springer. 1970, pp. 6–21 (cit. on p. 48)
1970
-
[81]
High-Resolution Global Maps of 21st-Century Forest Cover Change
Matthew C Hansen, Peter V Potapov, Rebecca Moore, et al. “High-Resolution Global Maps of 21st-Century Forest Cover Change”. In: Science 342.6160 (Nov. 2013), pp. 850–853 (cit. on p. 90)
2013
-
[82]
1) - Preface
John Brian Harley and David Woodward.The History of Cartography (Vol. 1) - Preface. The University of Chicago Press, 1987, p. xvi (cit. on p. 3)
1987
-
[83]
ColorBrewer.org: An Online Tool for Selecting Colour Schemes for Maps
Mark Harrower and Cynthia A Brewer. “ColorBrewer.org: An Online Tool for Selecting Colour Schemes for Maps”. In:The Cartographic Journal 40.1 (June 2003), pp. 27–37 (cit. on pp. 52, 55)
2003
-
[84]
Spatial Data Analysis-Challenges
John Haslett. “Spatial Data Analysis-Challenges”. In:The Statistician 41.3 (1992), p. 271 (cit. on p. 3)
1992
-
[85]
Global production networks and the analysis of economic development
Jeffrey Henderson, Peter Dicken, Martin Hess, Neil Coe, and Henry Wai-Chung Yeung. “Global production networks and the analysis of economic development”. In:Review of International Political Economy 9.3 (Feb. 2011), pp. 436–464 (cit. on p. 1)
2011
-
[86]
Beyond the Periphery: Child and Adult Understanding of World Map Continuity
Pontus Hennerdal. “Beyond the Periphery: Child and Adult Understanding of World Map Continuity”. In:Annals of the Association of American Geographers 105.4 (July 2015), pp. 773–790 (cit. on p. 46)
2015
-
[87]
NodeTrix: a hybrid visualization of social networks
Nathalie Henry, Jean-Daniel Fekete, and Michael J McGuffin. “NodeTrix: a hybrid visualization of social networks.” In:IEEE Transactions on Visualization and Computer Graphics 13.6 (2007), pp. 1302–1309 (cit. on p. 54)
2007
-
[88]
Myles Hollander and Douglas A. Wolfe. Nonparametric Statistical Methods. New York: Wiley-Interscience, 1999, p. 295 (cit. on pp. 95, 122)
1999
-
[89]
An ex- tended evaluation of the readability of tapered, animated, and textured directed-edge representations in node-link graphs
Danny Holten, Petra Isenberg, Jarke J Van Wijk, and Jean-Daniel Fekete. “An ex- tended evaluation of the readability of tapered, animated, and textured directed-edge representations in node-link graphs”. In:2011 IEEE Pacific Visualization Symposium (PacificVis). IEEE, 2011, pp. ...
2011
-
[90]
A user study on visualizing directed edges in graphs
Danny Holten and Jarke J Van Wijk. “A user study on visualizing directed edges in graphs”. In: Proceedings of the SIGCHI conference on Human Factors in Computing Systems, CHI’13. New York, New York, USA: ACM, Apr. 2009, pp. 2299–2308 (cit. on pp. 43, 117)
2009
-
[91]
Force-Directed Edge Bundling for Graph Visualization
Danny Holten and Jarke J Van Wijk. “Force-Directed Edge Bundling for Graph Visualization”. In:Computer Graphics Forum 28.3 (June 2009), pp. 983–990 (cit. on p. 42)
2009
-
[92]
Implementing a Class of Permutation Tests: The coin Package
Torsten Hothorn, Kurt Hornik, Mark A van de Wiel, and Achim Zeileis. “Implementing a Class of Permutation Tests: The coin Package”. In:Journal of Statistical Software 28.1 (Nov. 2008), pp. 1–23 (cit. on p. 132)
2008
-
[93]
Statistical methods for psychology
David C Howell. Statistical methods for psychology. Cengage Learning, 2012 (cit. on p. 122). 159
2012
-
[94]
Journey to the End of the World Map – How Edges of World Maps Shape the Spatial Mind
Florian Hruby, Monica Chico Avelino, and Raymundo Montoya Ayala. “Journey to the End of the World Map – How Edges of World Maps Shape the Spatial Mind”. In: Journal for Geographic Information Science Volume 1 (2016), pp. 314–323 (cit. on p. 46)
2016
-
[95]
2000 Years of ‘globes vs. maps’ – lessons (to be) learned
Florian Hruby and Andreas Riedl. “2000 Years of ‘globes vs. maps’ – lessons (to be) learned”. In:International Journal of Cartography 1.4 (Mar. 2018), pp. 1–15 (cit. on pp. 3, 7, 46)
2000
-
[96]
A gesture system for graph visualization in virtual reality environments
Yi-Jheng Huang, Takanori Fujiwara, Yun-Xuan Lin, Wen-Chieh Lin, and Ma Kwan-Liu. “A gesture system for graph visualization in virtual reality environments”. In:2017 IEEE Pacific Visualization Symposium (PacificVis) . IEEE, 2017, pp. 41–45 (cit. on p. 50)
2017
-
[97]
Using eye tracking to investigate graph layout effects
Weidong Huang. “Using eye tracking to investigate graph layout effects”. In:Asia- Pacific Symposium on Visualisation 2007. IEEE, 2007, pp. 97–100 (cit. on p. 43)
2007
-
[98]
Larger crossing angles make graphs easier to read
Weidong Huang, Peter Eades, and Seok-Hee Hong. “Larger crossing angles make graphs easier to read”. In:Journal of Visual Languages & Computing25.4 (Aug. 2014), pp. 452–465 (cit. on p. 43)
2014
-
[99]
Graph Bundling by Kernel Density Estimation
Christophe Hurter, Ozan Ersoy, and Alexandru Telea. “Graph Bundling by Kernel Density Estimation”. In:Computer Graphics Forum 31.3pt1 (June 2012), pp. 865–874 (cit. on p. 42)
2012
-
[100]
Functional Decomposition for Bundled Simplification of Trail Sets
Christophe Hurter, Stephane Puechmorel, Florence Nicol, and Alexandru Telea. “Functional Decomposition for Bundled Simplification of Trail Sets.” In:IEEE Transac- tions on Visualization and Computer Graphics 24.1 (Jan. 2018), pp. 500–510 (cit. on p. 42)
2018
-
[101]
FiberClay: Sculpt- ing Three Dimensional Trajectories to Reveal Structural Insights
Christophe Hurter, Nathalie Henry Riche, Steven M Drucker, et al. “FiberClay: Sculpt- ing Three Dimensional Trajectories to Reveal Structural Insights”. In: IEEE Trans- actions on Visualization and Computer Graphics (2019), to apeear (cit. on pp. 33, 150)
2019
-
[102]
FromDaDy: Spread- ing Aircraft Trajectories Across Views to Support Iterative Queries
Christophe Hurter, Benjamin Tissoires, and Stéphane Conversy . “FromDaDy: Spread- ing Aircraft Trajectories Across Views to Support Iterative Queries”. In:IEEE Transac- tions on Visualization and Computer Graphics 15.6 (2009), pp. 1017–1024 (cit. on p. 33)
2009
-
[103]
A system to generate a solid figure from three view
Masanori Idesawa. “A system to generate a solid figure from three view”. In:Bulletin of JSME 16.92 (1973), pp. 216–225 (cit. on p. 4)
1973
-
[104]
Vor- tex Visualization for Practical Engineering Applications
Monika Jankun-Kelly, Ming Jiang, David Thompson, and Raghu Machiraju. “Vor- tex Visualization for Practical Engineering Applications”. In: IEEE Transactions on Visualization and Computer Graphics 12.5 (2006), pp. 957–964 (cit. on p. 5)
2006
-
[105]
Evaluating the efficiency of physical visualizations
Yvonne Jansen, Pierre Dragicevic, and Jean-Daniel Fekete. “Evaluating the efficiency of physical visualizations”. In:Proceedings of the SIGCHI conference on Human Factors in Computing Systems, CHI’13. New York, New York, USA: ACM Press, 2013, pp. 2593– 2602 (cit. on p. 148)
2013
-
[106]
A Guide to Selecting Map Projections for World and Hemisphere Maps
Bernhard Jenny, Bojan Šavriˇc, Nicholas D. Arnold, Brooke E. Marston, and Charles A. Preppernau. “A Guide to Selecting Map Projections for World and Hemisphere Maps”. In: Choosing a Map Projection. Ed. by Miljenko Lapaine and E. Lynn Usery. Cham: Springer International Publish...
2017
-
[107]
Real-time raster projection for web maps
Bernhard Jenny, Bojan Šavriˇc, and Johannes Liem. “Real-time raster projection for web maps”. In:International Journal of Digital Earth 9.3 (Jan. 2015), pp. 215–229 (cit. on p. 87)
2015
-
[108]
Design principles for origin-destination flow maps
Bernhard Jenny, Daniel M Stephen, Ian Muehlenhaus, et al. “Design principles for origin-destination flow maps”. In:Cartography and Geographic Information Science 11 (July 2017), pp. 1–15 (cit. on pp. 42, 43, 53, 114, 116, 117, 120)
2017
-
[109]
Force-directed layout of origin-destination flow maps
Bernhard Jenny, Daniel M Stephen, Ian Muehlenhaus, et al. “Force-directed layout of origin-destination flow maps”. In: International Journal of Geographical Information Science 31.8 (Mar. 2017), pp. 1521–1540 (cit. on p. 116)
2017
-
[110]
Interactive Design of 3D Maps with Progressive Projection
Helen Jenny, Bernhard Jenny, and Lorenz Hurni. “Interactive Design of 3D Maps with Progressive Projection”. In:The Cartographic Journal 47.3 (July 2013), pp. 211–221 (cit. on p. 5)
2013
-
[111]
KOMPLOT “Do-it-yourself
Naftali Kadmon. “KOMPLOT “Do-it-yourself” Computer Cartography”. In:The Carto- graphic Journal 8.2 (1971), pp. 139–144 (cit. on p. 40)
1971
-
[112]
The complex network of global cargo ship movements
Pablo Kaluza, Andrea Kölzsch, Michael T Gastner, and Bernd Blasius. “The complex network of global cargo ship movements”. In:Journal of The Royal Society Interface 7.48 (July 2010), pp. 1093–1103 (cit. on p. 90)
2010
-
[113]
Do 3D visual- izations fail? An empirical discussion on 2D and 3D representations of the spatio- temporal data
Erdem Kaya, M Tolga Eren, Candemir Doger, and Selim Balcisoy. “Do 3D visual- izations fail? An empirical discussion on 2D and 3D representations of the spatio- temporal data”. In:Proceedings of EURASIA GRAPHICS. 2014 (cit. on p. 48)
2014
-
[114]
Visual Analytics: Defi- nition, Process, and Challenges
Daniel Keim, Gennady Andrienko, Jean-Daniel Fekete, et al. “Visual Analytics: Defi- nition, Process, and Challenges”. In:Information Visualization. Berlin, Heidelberg: Springer, Berlin, Heidelberg, 2008, pp. 154–175 (cit. on pp. 2, 38)
2008
-
[115]
Historical Internal Migration in Ireland
Mary Kelly, Aidan Slingsby, Jason Dykes, and Jo Wood. “Historical Internal Migration in Ireland”. In:the GIS Research UK (GISRUK). 2013 (cit. on pp. 45, 53, 143)
2013
-
[116]
Robust Detection and Visualization of Jet-Stream Core Lines in Atmospheric Flow
Michael Kern, Tim Hewson, Filip Sadlo, Rudiger Westermann, and Marc Rautenhaus. “Robust Detection and Visualization of Jet-Stream Core Lines in Atmospheric Flow.” In: IEEE Transactions on Visualization and Computer Graphics 24.1 (Jan. 2018), pp. 893–902 (cit. on p. 5)
2018
-
[117]
MAPIT: A computer program for production of flow maps, dot maps and graduated symbol maps
R. Kern and G. Rushton. “MAPIT: A computer program for production of flow maps, dot maps and graduated symbol maps”. In: The Cartographic Journal 6.2 (1969), pp. 131–137 (cit. on p. 40)
1969
-
[118]
Instant Construction and Visu- alization of Crowded Biological Environments
Tobias Klein, Ludovic Autin, Barbora Kozlikova, et al. “Instant Construction and Visu- alization of Crowded Biological Environments.” In:IEEE Transactions on Visualization and Computer Graphics 24.1 (Jan. 2018), pp. 862–872 (cit. on p. 5)
2018
-
[119]
Visualisation design for representing bird migration tracks in time and space
A Kölzsch, A Slingsby, Jo Wood, B A Nolet, and Jason Dykes. “Visualisation design for representing bird migration tracks in time and space”. In: Workshop on Visualisation in Environmental Sciences EnvirVis. 2013 (cit. on p. 84)
2013
-
[120]
An evaluation of space time cube representation of spatiotemporal patterns
Per Ola Kristensson, Nils Dahlbäck, Daniel Anundi, et al. “An evaluation of space time cube representation of spatiotemporal patterns.” In:IEEE Transactions on Visualization and Computer Graphics 15.4 (July 2009), pp. 696–702 (cit. on p. 48). 161
2009
-
[121]
A Study of Layout, Rendering, and Interaction Methods for Immersive Graph Visualization
Oh-Hyun Kwon, Chris Muelder, Kyungwon Lee, and Kwan-Liu Ma. “A Study of Layout, Rendering, and Interaction Methods for Immersive Graph Visualization”. In: IEEE Transactions on Visualization and Computer Graphics 22.7 (2016), pp. 1802– 1815 (cit. on pp. 49, 50, 89, 92)
2016
-
[122]
Pathway Preserving Represen- tation of Metabolic Networks
Antoine Lambert, J. Dubois, and Romain Bourqui. “Pathway Preserving Represen- tation of Metabolic Networks”. In: Computer Graphics Forum 30.3 (June 2011), pp. 1021–1030 (cit. on p. 42)
2011
-
[123]
Discovering knowledge in data: an introduction to data mining
Daniel T Larose and Chantal D Larose. Discovering knowledge in data: an introduction to data mining. John Wiley & Sons, 2014 (cit. on p. 37)
2014
-
[124]
State of the Art in Edge and Trail Bundling Techniques
Antoine Lhuillier, Christophe Hurter, and Alex Telea. “State of the Art in Edge and Trail Bundling Techniques”. In: 36.3 (2017), pp. 619–645 (cit. on p. 42)
2017
-
[125]
FFTEB: Edge bundling of huge graphs by the Fast Fourier Transform
Antoine Lhuillier, Christophe Hurter, and Alexandru Telea. “FFTEB: Edge bundling of huge graphs by the Fast Fourier Transform”. In: 2017 IEEE Pacific Visualization Symposium (PacificVis). IEEE, 2017, pp. 190–199 (cit. on p. 42)
2017
-
[126]
Image-based streamline generation and rendering
Liya Li and Han-Wei Shen. “Image-based streamline generation and rendering”. In: IEEE Transactions on Visualization and Computer Graphics 13.3 (2007), pp. 630–640 (cit. on p. 5)
2007
-
[127]
Human-Centered Approaches in Geovisualization Design: Investigating Multiple Methods Through a Long-Term Case Study
David Lloyd and Jason Dykes. “Human-Centered Approaches in Geovisualization Design: Investigating Multiple Methods Through a Long-Term Case Study”. In:IEEE Transactions on Visualization and Computer Graphics 17.12 (2011), pp. 2498–2507 (cit. on p. 151)
2011
-
[128]
Recent advances in the exploratory analysis of interregional flows in space and time
Duane F Marble, Zaiyong Gou, Lin Liu, and James Saunders. “Recent advances in the exploratory analysis of interregional flows in space and time”. In: Innovations in GIS 4 (1997), pp. 75–88 (cit. on p. 44)
1997
-
[129]
Springer International Publishing, 2018 (cit
Kim Marriott, Falk Schreiber, Tim Dwyer, et al., eds.Immersive Analytics. Springer International Publishing, 2018 (cit. on pp. 48, 151)
2018
-
[130]
Mapping Population Data from Zone Centroid Locations
David Martin. “Mapping Population Data from Zone Centroid Locations”. In:Transac- tions of the Institute of British Geographers 14.1 (1989), p. 90 (cit. on p. 84)
1989
-
[131]
Repeated Measures ANOVA, R.I.P.?
Charles E McCulloch. “Repeated Measures ANOVA, R.I.P.?” In:CHANCE 18.3 (Aug. 2013), pp. 29–33 (cit. on p. 95)
2013
-
[132]
Generating Tile Maps
Graham McNeill and Scott A Hale. “Generating Tile Maps”. In:Computer Graphics Forum 36.3 (July 2017), pp. 435–445 (cit. on pp. 45, 73)
2017
-
[133]
Small Multiples with Gaps
Wouter Meulemans, Jason Dykes, Aidan Slingsby, Cagatay Turkay, and Jo Wood. “Small Multiples with Gaps”. In: IEEE Transactions on Visualization and Computer Graphics 23.1 (2017), pp. 381–390 (cit. on p. 73)
2017
-
[134]
http://publications
International Organization for Migration.IOM Online Bookstore. http://publications. iom.int/. 2018 (cit. on p. 19)
2018
-
[135]
The magical number seven, plus or minus two: Some limits on our capacity for processing information
George A Miller. “The magical number seven, plus or minus two: Some limits on our capacity for processing information.” In:Psychological review 63.2 (1956), p. 81 (cit. on p. 39)
1956
-
[136]
Spatial Analytical Methods and Geographic Information Systems: Use in Health Research and Epidemiology
Dale A Moore and Tim E Carpenter. “Spatial Analytical Methods and Geographic Information Systems: Use in Health Research and Epidemiology”. In:Epidemiologic Reviews 21.2 (Feb. 1999), pp. 143–161 (cit. on p. 84). 162 Chapter 8 References
1999
-
[137]
Epidemic forecasts as a tool for public health: interpretation and (re)calibration
Robert Moss, James E Fielding, Lucinda J Franklin, et al. “Epidemic forecasts as a tool for public health: interpretation and (re)calibration”. In: Australian and New Zealand Journal of Public Health 42.1 (Feb. 2018), pp. 69–76 (cit. on p. 26)
2018
-
[138]
Forecasting influenza outbreak dynamics in Melbourne from Internet search query surveillance data
Robert Moss, Alexander Zarebski, Peter Dawson, and James M McCaw. “Forecasting influenza outbreak dynamics in Melbourne from Internet search query surveillance data”. In: Influenza and Other Respiratory Viruses 10.4 (July 2016), pp. 314–323 (cit. on p. 26)
2016
-
[139]
Retrospective forecasting of the 2010–2014 Melbourne influenza seasons using multiple surveil- lance systems
Robert Moss, Alexander Zarebski, Peter Dawson, and James M McCaw. “Retrospective forecasting of the 2010–2014 Melbourne influenza seasons using multiple surveil- lance systems”. In:Epidemiology & Infection 145.1 (Jan. 2017), pp. 156–169 (cit. on p. 26)
2010
-
[140]
Visualization Analysis and Design
Tamara Munzner. Visualization Analysis and Design. CRC Press, 2014 (cit. on pp. 2, 5, 8, 14–17, 36–38, 48, 112, 144)
2014
-
[141]
Visualizing the global topology of the MBone
Tamara Munzner, Eric Hoffman, K Claffy, and Bill Fenner. “Visualizing the global topology of the MBone”. In:Proceedings IEEE Symposium on Information Visualiza- tion’96 (INFOVIS). IEEE. 1996, pp. 85–92 (cit. on p. 47)
1996
-
[142]
Comparative Eye Tracking Study on Node-Link Visualizations of Trajectories
Rudolf Netzel, Michel Burch, and Daniel Weiskopf. “Comparative Eye Tracking Study on Node-Link Visualizations of Trajectories”. In:IEEE Transactions on Visualization and Computer Graphics 20.12 (2014), pp. 2221–2230 (cit. on p. 43)
2014
-
[143]
On the faithfulness of graph visualizations
Quan Nguyen, Peter Eades, and Seok-Hee Hong. “On the faithfulness of graph visualizations”. In:2013 IEEE Pacific Visualization Symposium (PacificVis). IEEE, 2013, pp. 209–216 (cit. on p. 43)
2013
-
[144]
Stub Bundling and Confluent Spirals for Geographic Networks
Arlind Nocaj and Ulrik Brandes. “Stub Bundling and Confluent Spirals for Geographic Networks”. In:Graph Drawing. Springer International Publishing, 2013, pp. 388–399 (cit. on p. 41)
2013
-
[145]
Knowledge flows across European regions
Raffaele Paci and Stefano Usai. “Knowledge flows across European regions”. In:The Annals of Regional Science 43.3 (July 2008), pp. 669–690 (cit. on p. 1)
2008
-
[146]
A Design Science Research Methodology for Information Systems Research
Ken Peffers, Tuure Tuunanen, Marcus A Rothenberger, and Samir Chatterjee. “A Design Science Research Methodology for Information Systems Research”. In:Journal of Management Information Systems 24.3 (Feb. 2008), pp. 45–77 (cit. on p. 8)
2008
-
[147]
Attribute-driven edge bundling for general graphs with applications in trail analysis
Vsevolod Peysakhovich, Christophe Hurter, and Alexandru Telea. “Attribute-driven edge bundling for general graphs with applications in trail analysis”. In:2015 IEEE Pacific Visualization Symposium (PacificVis). IEEE, 2015, pp. 39–46 (cit. on p. 42)
2015
-
[148]
Flow map layout
Doantam Phan, Ling Xiao, Ryan Yeh, and P Hanrahan. “Flow map layout”. In:Pro- ceedings of IEEE Symposium on Information Visualization. INFOVIS 2005. IEEE, 2005, pp. 219–224 (cit. on p. 41)
2005
-
[149]
Mixed-Effects Models in S and S-PLUS
José C Pinheiro and Douglas M Bates. Mixed-Effects Models in S and S-PLUS. Springer, New York, NY, 2000 (cit. on p. 95)
2000
-
[150]
The challenge of information visualization evaluation
Catherine Plaisant. “The challenge of information visualization evaluation”. In:the working conference on Advanced visual interfaces. New York, New York, USA: ACM, May 2004, pp. 109–116 (cit. on p. 150). 163
2004
-
[151]
Edge Routing with Ordered Bundles
Sergey Pupyrev, Lev Nachmanson, Sergey Bereg, and Alexander E Holroyd. “Edge Routing with Ordered Bundles”. In: International Symposium on Graph Drawing (GD’11). Berlin, Heidelberg: Springer, Berlin, Heidelberg, Sept. 2011, pp. 136–147 (cit. on pp. 9, 42, 52)
2011
-
[152]
Edge routing with ordered bundles
Sergey Pupyrev, Lev Nachmanson, Sergey Bereg, and Alexander E Holroyd. “Edge routing with ordered bundles”. In:Computational Geometry 52 (Feb. 2016), pp. 18– 33 (cit. on p. 42)
2016
-
[153]
Validating graph drawing aesthetics
Helen C. Purchase, Robert F. Cohen, and Murray James. “Validating graph drawing aesthetics”. In: Graph Drawing. Ed. by Franz J. Brandenburg. Berlin, Heidelberg: Springer Berlin Heidelberg, 1996, pp. 435–446 (cit. on p. 43)
1996
-
[154]
Theoret- ical Foundations of Information Visualization
Helen C Purchase, Natalia Andrienko, T J Jankun-Kelly, and Matthew Ward. “Theoret- ical Foundations of Information Visualization”. In:Information Visualization. Berlin, Heidelberg: Springer, Berlin, Heidelberg, 2008, pp. 46–64 (cit. on p. 38)
2008
-
[155]
Framework for Studying Spatially Ordered Treemaps
Ali Ramathan, Jason Dykes, and Jo Wood. “Framework for Studying Spatially Ordered Treemaps”. In:26th International Cartographic Conference. Dresden, Germany, 2013 (cit. on pp. 45, 64)
2013
-
[156]
Visualization in Me- teorology — A Survey of Techniques and Tools for Data Analysis Tasks
Marc Rautenhaus, Michael Bottinger, Stephan Siemen, et al. “Visualization in Me- teorology — A Survey of Techniques and Tools for Data Analysis Tasks.” In: IEEE Transactions on Visualization and Computer Graphics (Dec. 2017), to appear (cit. on p. 5)
2017
-
[157]
Research and reports
United Nations High Commissioner for Refugees. Research and reports. https://www. unicef.org/eca/reports. 2018 (cit. on p. 19)
2018
-
[158]
Ex- ploring the design space of interactive link curvature in network diagrams
Nathalie Henry Riche, Tim Dwyer, Bongshin Lee, and Sheelagh Carpendale. “Ex- ploring the design space of interactive link curvature in network diagrams”. In:the International Working Conference. ACM, May 2012, pp. 506–513 (cit. on pp. 42, 114)
2012
-
[159]
Visually driven analysis of movement data by progressive clustering:
Salvatore Rinzivillo, Dino Pedreschi, Mirco Nanni, et al. “Visually driven analysis of movement data by progressive clustering:” in:Information Visualization 7.3-4 (Sept. 2008), pp. 225–239 (cit. on p. 150)
2008
-
[160]
The 1837 Maps of Henry Drury Harness
Arthur H Robinson. “The 1837 Maps of Henry Drury Harness”. In:The Geographical Journal 121.4 (Dec. 1955), pp. 440–450 (cit. on p. 39)
1955
-
[161]
The Thematic Maps of Charles Joseph Minard
Arthur H Robinson. “The Thematic Maps of Charles Joseph Minard”. In:Imago Mundi 21 (Jan. 1967), pp. 95–108 (cit. on p. 39)
1967
-
[162]
Elements of cartography, john wiley&sons
Arthur H Robinson, JL Morrison, Phillip C Muehrcke, AJ Kimerling, and SC Guptill. Elements of cartography, john wiley&sons. 1995 (cit. on p. 38)
1995
-
[163]
An Empirically-Derived Taxonomy of Interaction Primitives for Interactive Cartography and Geovisualization
Robert E Roth. “An Empirically-Derived Taxonomy of Interaction Primitives for Interactive Cartography and Geovisualization”. In: IEEE Transactions on Visualization and Computer Graphics 19.12 (2013), pp. 2356–2365 (cit. on p. 34)
2013
-
[164]
Projection Wizard – An Online Map Projection Selection Tool
Bojan Šavriˇc, Bernhard Jenny, and Helen Jenny. “Projection Wizard – An Online Map Projection Selection Tool”. In:The Cartographic Journal 53.2 (2016), pp. 177–185 (cit. on p. 46)
2016
-
[165]
Divided Edge Bundling for Direc- tional Network Data
David Selassie, Brandon Heller, and Jeffrey Heer. “Divided Edge Bundling for Direc- tional Network Data”. In:IEEE Transactions on Visualization and Computer Graphics 17.12 (2011), pp. 2354–2363 (cit. on p. 42). 164 Chapter 8 References
2011
-
[166]
DXR: A Toolkit for Building Immersive Data Visualizations
Ronell Sicat, Jiabao Li, JunYoung Choi, et al. “DXR: A Toolkit for Building Immersive Data Visualizations”. In:IEEE Transactions on Visualization and Computer Graphics (2019), to appear (cit. on p. 144)
2019
-
[167]
Human problem solving: The state of the theory in 1970
Herbert A Simon and Allen Newell. “Human problem solving: The state of the theory in 1970.” In:American Psychologist 26.2 (1971), p. 145 (cit. on p. 39)
1971
-
[168]
Temporal tile-maps for characterising the temporal occupancy of places: A seabird case study
A Slingsby and E van Loon. “Temporal tile-maps for characterising the temporal occupancy of places: A seabird case study”. In: the 25th Geographical Information Science GIS Research UK Conference. Apr. 2017 (cit. on pp. 1, 84)
2017
-
[169]
Thematic cartography and geovisualization
Terry A Slocum, Robert Bach McMaster, Fritz C Kessler, and Hugh H Howard. Thematic cartography and geovisualization. 3rd. Pearson Prentice Hall Upper Saddle River, NJ, 2009 (cit. on pp. 38, 43, 84)
2009
-
[170]
Flattening the earth: two thousand years of map projections
John P Snyder. Flattening the earth: two thousand years of map projections. University of Chicago Press, 1997 (cit. on pp. 46, 84)
1997
-
[171]
Map projections: A working manual
John P Snyder. Map projections: A working manual. U.S. Government Printing Office, 1987 (cit. on pp. 4, 46, 94)
1987
-
[172]
The Use of 2D and 3D Displays for Shape-Understanding versus Relative-Position Tasks
Mark St John, Michael B Cowen, Harvey S Smallman, and Heather M Oonk. “The Use of 2D and 3D Displays for Shape-Understanding versus Relative-Position Tasks”. In: Human Factors: The Journal of the Human Factors and Ergonomics Society 43.1 (Sept. 2016), pp. 79–98 (cit. on p. 5)
2016
-
[173]
Automated layout of origin–destination flow maps: U.S. county-to-county migration 2009–2013
Daniel M Stephen and Bernhard Jenny. “Automated layout of origin–destination flow maps: U.S. county-to-county migration 2009–2013”. In:Journal of Maps 13.1 (May 2017), pp. 46–55 (cit. on p. 43)
2009
-
[174]
A spatial one-to-many flow layout algorithm using triangulation, approximate Steiner trees, and path smoothing
Shipeng Sun. “A spatial one-to-many flow layout algorithm using triangulation, approximate Steiner trees, and path smoothing”. In: Cartography and Geographic Information Science 11.1 (Feb. 2018), pp. 1–17 (cit. on p. 41)
2018
-
[175]
The Judgment of Size
Martha Teghtsoonian. “The Judgment of Size”. In:The American Journal of Psychology 78.3 (Sept. 1965), p. 392 (cit. on p. 106)
1965
-
[176]
Psychophysics: Introduc- tion to Its Perceptual, Neural, and Social Prospects
Robert Teghtsoonian, SS Stevens, and Geraldine Stevens. “Psychophysics: Introduc- tion to Its Perceptual, Neural, and Social Prospects”. In: The American Journal of Psychology 88.4 (1975), p. 677 (cit. on p. 106)
1975
-
[177]
A Computer Movie Simulating Urban Growth in the Detroit Region
W. R. Tobler. “A Computer Movie Simulating Urban Growth in the Detroit Region”. In: Economic Geography 46.sup1 (1970), pp. 234–240 (cit. on p. 2)
1970
-
[178]
Depicting Federal Fiscal Transfers
Waldo R Tobler. “Depicting Federal Fiscal Transfers”. In:The Professional Geographer 33.4 (Nov. 1981), pp. 419–422 (cit. on p. 40)
1981
-
[179]
Experiments In Migration Mapping By Computer
Waldo R Tobler. “Experiments In Migration Mapping By Computer”. In:Cartography and Geographic Information Science 14.2 (Apr. 1987), pp. 155–163 (cit. on pp. 1, 40, 43)
1987
-
[180]
Evaluating Geographic Visualization Tools and Methods: An Ap- proach and Experiment Based upon User Tasks
Carolina Tobon. “Evaluating Geographic Visualization Tools and Methods: An Ap- proach and Experiment Based upon User Tasks”. In:Exploring Geovisualization. Ed. by Menno-Jan Kraak, Jason Dykes, and Alan M. MacEachren. International Cartographic Association. Elsevier, 2005, pp. ...
2005
-
[181]
Evaluating Visualizations: Do Expert Reviews Work?
Melanie Tory and Torsten Moller. “Evaluating Visualizations: Do Expert Reviews Work?” In: IEEE Computer Graphics and Applications 25.5 (Sept. 2005), pp. 8–11 (cit. on p. 151)
2005
-
[182]
Flow Map Layout via Spiral Trees
Kevin Verbeek, Kevin Buchin, and Bettina Speckmann. “Flow Map Layout via Spiral Trees”. In: IEEE Transactions on Visualization and Computer Graphics 17.12 (Dec. 2011), pp. 2536–2544 (cit. on p. 41)
2011
-
[183]
A general theory of traffic movement
Alan M Voorhees. “A general theory of traffic movement”. In:Transportation 40.6 (Oct. 2013), pp. 1105–1116 (cit. on pp. 3, 44)
2013
-
[184]
An Interactive Approach for Exploration of Flows Through Direction-Based Filtering
Katerina Vrotsou, Georg Fuchs, Natalia Andrienko, and Gennady Andrienko. “An Interactive Approach for Exploration of Flows Through Direction-Based Filtering”. In: Journal of Geovisualization and Spatial Analysis 1.1-2 (May 2017), p. 205 (cit. on pp. 48, 115)
2017
-
[185]
VirtualDesk: A Com- fortable and Efficient Immersive Information Visualization Approach
Jorge A Wagner Filho, Carla MDS Freitas, and Luciana Nedel. “VirtualDesk: A Com- fortable and Efficient Immersive Information Visualization Approach”. In:Computer Graphics Forum 37.3 (July 2018), pp. 415–426 (cit. on p. 50)
2018
-
[186]
Immer- sive Visualization of Abstract Information: An Evaluation on Dimensionally-Reduced Data Scatterplots
Jorge A Wagner Filho, Marina F Rey, Carla MDS Freitas, and Luciana Nedel. “Immer- sive Visualization of Abstract Information: An Evaluation on Dimensionally-Reduced Data Scatterplots”. In:Proceedings of the 25th IEEE Conference on Virtual Reality and 3D User Interfaces. Vol. 2...
2018
-
[187]
Chapter Five - Visual Salience and Finding Information
Colin Ware. “Chapter Five - Visual Salience and Finding Information”. In:Information Visualization: Perception for Design (Third Edition). Third Edition. Morgan Kaufmann, 2013, pp. 139–177 (cit. on p. 3)
2013
-
[188]
Information visualization: perception for design
Colin Ware. Information visualization: perception for design. 3rd. Elsevier, 2013 (cit. on p. 86)
2013
-
[189]
Reevaluating stereo and motion cues for visualizing graphs in three dimensions
Colin Ware and Peter Mitchell. “Reevaluating stereo and motion cues for visualizing graphs in three dimensions”. In: the 2nd symposium on Applied perception in graphics and visualization. New York, New York, USA: ACM, Aug. 2005, pp. 51–58 (cit. on p. 50)
2005
-
[190]
The History of the Cluster Heat Map
Leland Wilkinson and Michael Friendly. “The History of the Cluster Heat Map”. In: The American Statistician 63.2 (May 2009), pp. 179–184 (cit. on p. 44)
2009
-
[191]
Lightweight Relief Shearing for Enhanced Terrain Perception on Interactive Maps
Wesley Willett, Bernhard Jenny, Tobias Isenberg, and Pierre Dragicevic. “Lightweight Relief Shearing for Enhanced Terrain Perception on Interactive Maps”. In:the 33rd Annual ACM Conference on Human Factors in Computing Systems . New York, New York, USA: ACM, Apr. 2015, pp. 356...
2015
-
[192]
Interview Techniques for UX Practitioners
Chauncey Wilson. Interview Techniques for UX Practitioners. a user-centered design method. Elsevier, 2014 (cit. on p. 8)
2014
-
[193]
A computer system for mapping and analyzing transportation networks
Robert I Wittick. “A computer system for mapping and analyzing transportation networks”. In:Southeastern Geographer 16.1 (1976), pp. 74–81 (cit. on p. 40)
1976
-
[194]
Edgelens: an interactive method for managing edge congestion in graphs
Nelson Wong, Sheelagh Carpendale, and Saul Greenberg. “Edgelens: an interactive method for managing edge congestion in graphs”. In:IEEE Symposium on Information Visualization 2003. IEEE, 2003, pp. 51–58 (cit. on p. 43)
2003
-
[195]
Landserf
Jo Wood. Landserf. http://www.landserf.org/. 2009 (cit. on p. 5). 166 Chapter 8 References
2009
-
[196]
Spatially Ordered Treemaps
Jo Wood and Jason Dykes. “Spatially Ordered Treemaps”. In:IEEE Transactions on Visualization and Computer Graphics 14.6 (2008), pp. 1348–1355 (cit. on pp. 44, 53)
2008
-
[197]
Visualisation of Origins, Destinations and Flows with OD Maps
Jo Wood, Jason Dykes, and Aidan Slingsby. “Visualisation of Origins, Destinations and Flows with OD Maps”. In:The Cartographic Journal 47.2 (May 2010), pp. 117– 129 (cit. on pp. 9, 44, 53, 54)
2010
-
[198]
Us- ing 3D in Visualization
Jo Wood, Sabine Kirschenbauer, Jürgen Döllner, Adriano Lopes, and Lars Bodum. “Us- ing 3D in Visualization”. In:Exploring Geovisualization. Elsevier, Jan. 2005, pp. 293– 312 (cit. on pp. 5, 48)
2005
-
[199]
Visualizing the Dynamics of London’s Bicycle-Hire Scheme
Jo Wood, Aidan Slingsby, and Jason Dykes. “Visualizing the Dynamics of London’s Bicycle-Hire Scheme”. In: Cartographica: The International Journal for Geographic Information and Geovisualization 46.4 (Dec. 2011), pp. 239–251 (cit. on pp. 45, 149)
2011
-
[200]
Many-to-Many Geographically- Embedded Flow Visualisation: An Evaluation
Yalong Yang, Tim Dwyer, Sarah Goodwin, and Kim Marriott. “Many-to-Many Geographically- Embedded Flow Visualisation: An Evaluation”. In:IEEE Transactions on Visualization and Computer Graphics 23.1 (Jan. 2017), pp. 411–420 (cit. on pp. 10, 114, 115)
2017
-
[201]
https://vis.yalongyang.com/maptrix/index.html
Yalong Yang, Tim Dwyer, Sarah Goodwin, and Kim Marriott.MapTrix online demo. https://vis.yalongyang.com/maptrix/index.html. 2016 (cit. on pp. 78, 79)
2016
-
[202]
Origin-Destination Flow Maps in Immersive Environments
Yalong Yang, Tim Dwyer, Bernhard Jenny, et al. “Origin-Destination Flow Maps in Immersive Environments”. In: IEEE Transactions on Visualization and Computer Graphics 25.1 (2019), to appear (cit. on p. 10)
2019
-
[203]
Maps and Globes in Virtual Reality
Yalong Yang, Bernhard Jenny, Tim Dwyer, et al. “Maps and Globes in Virtual Reality”. In: Computer Graphics Forum 37.3 (2018), pp. 427–438 (cit. on pp. 10, 113, 115, 117, 127)
2018
-
[204]
An Immersive Approach to the Visual Ex- ploration of Geospatial Network Datasets
Meng-Jia Zhang, Jie Li, and Kang Zhang. “An Immersive Approach to the Visual Ex- ploration of Geospatial Network Datasets”. In:Proceedings of the 15th ACM SIGGRAPH Conference on Virtual-Reality Continuum and Its Applications in Industry. VRCAI ’16. Zhuhai, China: ACM, 2016, pp...
2016
-
[205]
Visual Exploration of 3D Geospa- tial Networks in a Virtual Reality Environment
Meng-Jia Zhang, Kang Zhang, Jie Li, and Yi-Na Li. “Visual Exploration of 3D Geospa- tial Networks in a Virtual Reality Environment”. In: The Computer Journal 61.3 (2018), pp. 447–458 (cit. on pp. 47, 115)
2018
-
[206]
Optimization Of Bicycle Lane, Xiamen
Jiafen Zheng, Shili Chen, Xun Li, Tingting Chen, and Depei Wang. “Optimization Of Bicycle Lane, Xiamen”. In:Planners 7 (2018), pp. 100–105 (cit. on p. 22)
2018
-
[207]
Urban Computing: Concepts, Methodologies, and Applications
Yu Zheng, Licia Capra, Ouri Wolfson, and Hai Yang. “Urban Computing: Concepts, Methodologies, and Applications”. In:ACM Transactions on Intelligent Systems and Technology (TIST) 5.3 (Oct. 2014), pp. 38–55 (cit. on p. 22). 167 List of Figures 1.1 Two main approaches to visualis...
2014
-
[2018]
21 2.5 Different urban OD types in a part of Xiamen, China
Screen capture from http://migration.iom.int/europe/. . . 21 2.5 Different urban OD types in a part of Xiamen, China. Figure provided by UI-SYSU. . . . . . . . . . . . . . . . . . . . . . . . . . . . . . . . . . 25 2.6 Using flow maps to show part of short-distance OD flows. (a)...
2018
Reviewed August 14, 2026 · model on record in the stance chip above.
Discussion (0). Continue with ORCID to comment.