Accretion geometry and spectral evolution in 1A 1118-61: a comparison of the 2009 and 2026 outbursts
Pith reviewed 2026-05-19 22:38 UTC · model grok-4.3
pith:AV6VARRR Add to your LaTeX paper
What is a Pith Number?\usepackage{pith}
\pithnumber{AV6VARRR}
Prints a linked pith:AV6VARRR badge after your title and writes the identifier into PDF metadata. Compiles on arXiv with no extra files. Learn more
The pith
The cyclotron line energy in 1A 1118-61 stays nearly constant across a factor of 25 luminosity change between its 2009 and 2026 outbursts.
A machine-rendered reading of the paper's core claim, the machinery that carries it, and where it could break.
Core claim
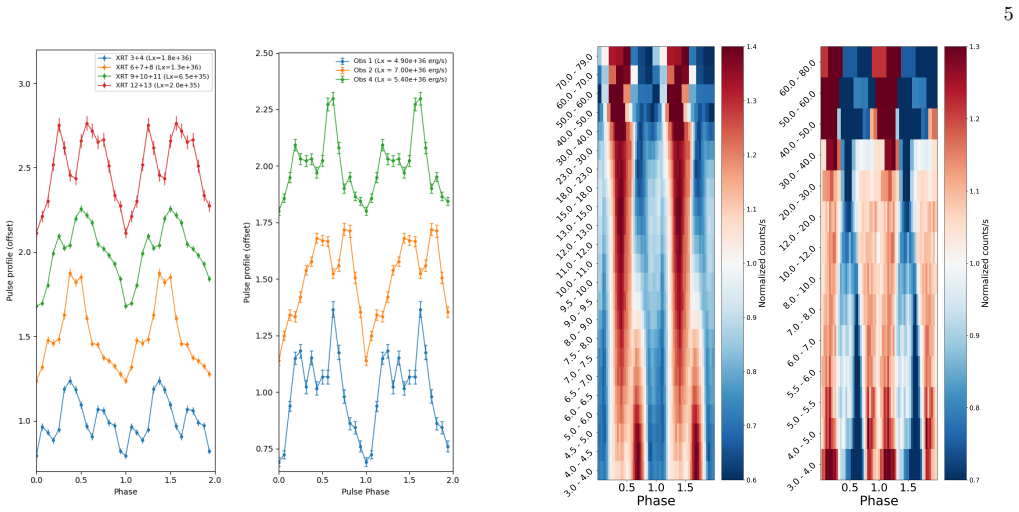
A cyclotron resonance scattering feature appears in the two NuSTAR spectra with its centroid energy essentially unchanged despite a factor of roughly 25 variation in source luminosity; the 2026 outburst is systematically harder and brighter than the 2009 one, pointing to persistent differences in accretion structure and the physical conditions in the emission regions.
What carries the argument
The cyclotron resonance scattering feature, whose measured energy directly traces the magnetic field strength at the site where X-ray photons scatter off electrons in the accretion column; its constancy with luminosity is used to argue that the effective emission height or geometry adjusts to keep the local field nearly fixed.
If this is right
- The magnetospheric radius moves with accretion rate while the line-forming layer samples a fixed magnetic field strength.
- Pulse-profile evolution with luminosity reflects changing beam patterns from the accretion column.
- The QPO frequency-luminosity relation supports an origin tied to instabilities at the magnetosphere-disk boundary.
- Long-term differences in hardness between outbursts imply that the Be-star disk or mass-transfer rate can alter the overall accretion geometry.
Where Pith is reading between the lines
- Similar cyclotron-line stability might appear in other accreting pulsars if the column height self-regulates with mass inflow.
- Repeated monitoring across multiple outbursts could reveal whether the harder 2026 state represents a new equilibrium or a transient phase.
- If the line energy truly does not shift, it constrains models in which radiation pressure lifts the emission region to weaker-field altitudes.
Load-bearing premise
The thermal Comptonization model fully accounts for the continuum shape without extra unmodeled components, and the 2009 and 2026 observations can be compared directly without significant calibration offsets or incomplete outburst sampling.
What would settle it
A new observation of 1A 1118-61 at a luminosity well outside the current range that shows the cyclotron line centroid shifted by more than the reported measurement uncertainty.
Figures


read the original abstract
We present a detailed spectro-temporal study of the Be X-ray binary pulsar $1A$ $1118-61$ during its brightest recorded outburst in 2026, using \textit{Swift} and \textit{NuSTAR} observations, and compare its properties with the 2009 outburst. Coherent pulsations at $\sim400$ s are detected throughout the outburst, with pulse profiles evolving strongly with energy and luminosity, indicating changes in emission geometry. A transient quasi-periodic oscillation (QPO) at $\sim$0.11 Hz is observed during the rising phase. The luminosity dependence of the QPO frequency during the current and previous outbursts suggests an origin associated with instabilities near the magnetospheric radius. The broadband spectra are well described by thermal Comptonization and show clear spectral hardening at higher luminosities. A cyclotron line is detected in the two \textit{NuSTAR} observations, with its energy remaining nearly constant despite a factor of $\sim25$ change in luminosity. Long-term monitoring reveals that the 2026 outburst is systematically harder and brighter, suggesting significant difference in the accretion structure and emission regions between the two outbursts.
Editorial analysis
A structured set of objections, weighed in public.
Referee Report
Summary. The manuscript presents a spectro-temporal study of the Be X-ray binary pulsar 1A 1118-61 during its 2026 outburst using Swift and NuSTAR observations, with comparison to the 2009 outburst. It reports detection of coherent ~400 s pulsations whose profiles evolve with energy and luminosity, a transient QPO at ~0.11 Hz during the rise whose frequency-luminosity trend suggests a magnetospheric origin, broadband spectra well-fit by thermal Comptonization that harden at higher luminosities, and a cyclotron resonant scattering feature (CRSF) detected in the two NuSTAR pointings whose centroid energy remains nearly constant despite a factor of ~25 luminosity change. The 2026 outburst is described as systematically harder and brighter than 2009, implying differences in accretion structure and emission regions.
Significance. If the central results hold, particularly the reported constancy of the CRSF energy across a wide luminosity range, the work would provide useful observational constraints on cyclotron line formation and accretion column geometry in magnetized neutron stars. The direct comparison of two outbursts from the same source, combined with timing features such as the QPO and energy-dependent pulse profiles, adds to the empirical picture of accretion regime transitions in Be/X-ray binaries. The NuSTAR broadband coverage is a clear asset for the spectral analysis.
major comments (2)
- Spectral analysis of the NuSTAR observations: The claim that the CRSF centroid energy remains nearly constant despite the factor ~25 luminosity drop rests on fits with a single thermal Comptonization plus Gaussian absorption model. No robustness checks against alternative continua (e.g., inclusion of bulk-motion Comptonization, reflection, or a second Compton component) are shown; such variations can shift the apparent line energy by several keV and directly affect the interpretation of unchanged accretion geometry.
- Outburst comparison section: The assertion that the 2026 outburst is systematically harder and brighter, indicating different accretion structure, assumes the 2009 and 2026 datasets are directly comparable. Quantitative assessment of cross-calibration offsets, differences in outburst phase coverage, or instrument response between the archival 2009 data and the new Swift/NuSTAR observations is not provided, weakening the load-bearing claim of intrinsic differences.
minor comments (2)
- The abstract omits quantitative details on fit statistics (reduced chi-squared, detection significances for the CRSF and QPO) and data selection criteria, which would strengthen the presentation of the central claims.
- Table or figure presenting the best-fit CRSF parameters for the two NuSTAR observations should explicitly list the luminosity values, energy ranges, and any tied parameters to facilitate direct comparison.
Simulated Author's Rebuttal
We thank the referee for the constructive and detailed report. The comments highlight important aspects that will improve the robustness and clarity of our analysis. We respond to each major comment below and outline the revisions we will make.
read point-by-point responses
-
Referee: Spectral analysis of the NuSTAR observations: The claim that the CRSF centroid energy remains nearly constant despite the factor ~25 luminosity drop rests on fits with a single thermal Comptonization plus Gaussian absorption model. No robustness checks against alternative continua (e.g., inclusion of bulk-motion Comptonization, reflection, or a second Compton component) are shown; such variations can shift the apparent line energy by several keV and directly affect the interpretation of unchanged accretion geometry.
Authors: We acknowledge that the referee is correct: the manuscript does not present explicit robustness checks against alternative continuum models. The thermal Comptonization model was chosen because it provides statistically acceptable fits to the NuSTAR data with physically reasonable parameters, consistent with prior studies of this source. Nevertheless, to address this concern directly, we will add a new subsection in the revised manuscript showing fits with bulk-motion Comptonization, a reflection component, and a two-component Comptonization model. We will report the resulting CRSF centroid energies and demonstrate that they remain consistent within uncertainties (shifts of at most ~1.5 keV), thereby supporting the conclusion of stable accretion geometry. These additional fits will be included in the next version. revision: yes
-
Referee: Outburst comparison section: The assertion that the 2026 outburst is systematically harder and brighter, indicating different accretion structure, assumes the 2009 and 2026 datasets are directly comparable. Quantitative assessment of cross-calibration offsets, differences in outburst phase coverage, or instrument response between the archival 2009 data and the new Swift/NuSTAR observations is not provided, weakening the load-bearing claim of intrinsic differences.
Authors: We agree that a quantitative treatment of cross-calibration and phase coverage is necessary to strengthen the comparison. In the revised manuscript we will add a dedicated paragraph that (i) quantifies cross-calibration offsets using standard methods for Swift and archival RXTE/PCA data from 2009, (ii) compares the sampled luminosity and orbital phases of the two outbursts, and (iii) propagates calibration uncertainties into the hardness-ratio differences. While the primary evidence for spectral hardening is the luminosity-dependent trend observed within the 2026 NuSTAR+Swift dataset alone, the direct inter-outburst comparison will now be presented with these quantitative caveats and supporting figures. revision: yes
Circularity Check
No circularity: purely observational analysis of NuSTAR/Swift data
full rationale
The paper reports direct measurements from Swift and NuSTAR observations of the 2026 outburst of 1A 1118-61, including coherent pulsations at ~400 s, a transient QPO at ~0.11 Hz, broadband spectral fits using standard thermal Comptonization models, and detection of a cyclotron line whose energy is measured to remain nearly constant across luminosity changes. The 2009 vs 2026 comparison is based on empirical spectral hardness and luminosity differences. No derivation chain, uniqueness theorem, ansatz, or prediction is presented that reduces by construction to fitted inputs or self-citations. All central claims rest on standard data reduction and model fitting without self-referential steps.
Axiom & Free-Parameter Ledger
Lean theorems connected to this paper
-
IndisputableMonolith/Foundation/AbsoluteFloorClosure.leanreality_from_one_distinction unclear?
unclearRelation between the paper passage and the cited Recognition theorem.
A cyclotron line is detected in the two NuSTAR observations, with its energy remaining nearly constant despite a factor of ~25 change in luminosity; the broadband spectra are well described by thermal Comptonization
-
IndisputableMonolith/Foundation/AlexanderDuality.leanalexander_duality_circle_linking unclear?
unclearRelation between the paper passage and the cited Recognition theorem.
The luminosity dependence of the QPO frequency ... suggests an origin associated with instabilities near the magnetospheric radius
What do these tags mean?
- matches
- The paper's claim is directly supported by a theorem in the formal canon.
- supports
- The theorem supports part of the paper's argument, but the paper may add assumptions or extra steps.
- extends
- The paper goes beyond the formal theorem; the theorem is a base layer rather than the whole result.
- uses
- The paper appears to rely on the theorem as machinery.
- contradicts
- The paper's claim conflicts with a theorem or certificate in the canon.
- unclear
- Pith found a possible connection, but the passage is too broad, indirect, or ambiguous to say the theorem truly supports the claim.
Reference graph
Works this paper leans on
-
[1]
Alpar, M. A., & Shaham, J. 1985, Nature, 316, 239, doi: 10.1038/316239a0
-
[2]
Arnaud, K. A. 1996, in Astronomical Society of the Pacific Conference Series, Vol. 101, Astronomical Data Analysis Software and Systems V, ed. G. H. Jacoby & J. Barnes, 17 Astropy Collaboration, Robitaille, T. P., Tollerud, E. J., et al. 2013, A&A, 558, A33, doi: 10.1051/0004-6361/201322068
-
[3]
2022, MNRAS, 517, 4138, doi: 10.1093/mnras/stac2901
Bachhar, R., Raman, G., Bhalerao, V., & Bhattacharya, D. 2022, MNRAS, 517, 4138, doi: 10.1093/mnras/stac2901
-
[4]
Demleitner, M., & Andrae, R. 2021, AJ, 161, 147, doi: 10.3847/1538-3881/abd806
work page internal anchor Pith review doi:10.3847/1538-3881/abd806 2021
-
[5]
Barthelmy, S. D., Barbier, L. M., Cummings, J. R., et al. 2005, Space Sci. Rev., 120, 143, doi: 10.1007/s11214-005-5096-3
work page internal anchor Pith review doi:10.1007/s11214-005-5096-3 2005
-
[6]
Basko, M. M., & Sunyaev, R. A. 1976, MNRAS, 175, 395, doi: 10.1093/mnras/175.2.395
-
[7]
Becker, P. A., & Wolff, M. T. 2007, ApJ, 654, 435, doi: 10.1086/509108
-
[8]
A., Klochkov, D., Sch¨ onherr, G., et al
Becker, P. A., Klochkov, D., Sch¨ onherr, G., et al. 2012, A&A, 544, A123, doi: 10.1051/0004-6361/201219065
-
[9]
Beri, A., Girdhar, T., Iyer, N. K., & Maitra, C. 2021, MNRAS, 500, 1350, doi: 10.1093/mnras/staa3345
-
[10]
Burrows, D. N., Hill, J. E., Nousek, J. A., et al. 2005, Space Sci. Rev., 120, 165, doi: 10.1007/s11214-005-5097-2
work page internal anchor Pith review doi:10.1007/s11214-005-5097-2 2005
-
[11]
Chevalier, C., & Ilovaisky, S. A. 1975, IAU Circ., 2778, 1 Chun-Che Lin, L., Takata, J., Kong, A. K. H., & Hwang, C.-Y. 2010, arXiv e-prints, arXiv:1007.2828, doi: 10.48550/arXiv.1007.2828
work page internal anchor Pith review Pith/arXiv arXiv doi:10.48550/arxiv.1007.2828 1975
-
[12]
J., Roche, P., Everall, C., et al
Coe, M. J., Roche, P., Everall, C., et al. 1994, A&A, 289, 784
work page 1994
-
[13]
Davies, R. E., & Pringle, J. E. 1981, MNRAS, 196, 209, doi: 10.1093/mnras/196.2.209
-
[14]
2011, MNRAS, 418, 2292, doi: 10.1111/j.1365-2966.2011.19566.x
Devasia, J., James, M., Paul, B., & Indulekha, K. 2011, MNRAS, 414, 1023, doi: 10.1111/j.1365-2966.2011.18407.x
-
[15]
2011, MNRAS, 418, 2292, doi: 10.1111/j.1365-2966.2011.19566.x
Devasia, J., James, M., Paul, B., & Indulekha, K. 2011, Monthly Notices of the Royal Astronomical Society, 417, 348, doi: 10.1111/j.1365-2966.2011.19269.x
-
[16]
2010, A&A, 515, L1, doi: 10.1051/0004-6361/201014858
Doroshenko, V., Suchy, S., Santangelo, A., et al. 2010, A&A, 515, L1, doi: 10.1051/0004-6361/201014858
-
[17]
Doroshenko, V., Tsygankov, S. S., Mushtukov, A. A., et al. 1995, MNRAS, 466, 2143, doi: 10.1093/mnras/stw3236
-
[18]
Eyles, C. J., Skinner, G. K., Willmore, A. P., & Rosenberg, F. D. 1975, Nature, 254, 577, doi: 10.1038/254577a0
-
[19]
Fabian, A. C. 1975, MNRAS, 173, 161, doi: 10.1093/mnras/173.1.161
-
[20]
2023, A&A, 677, A103, doi: 10.1051/0004-6361/202347062
Ferrigno, C., D’A` ı, A., & Ambrosi, E. 2023, A&A, 677, A103, doi: 10.1051/0004-6361/202347062
-
[21]
Finger, M. H. 1998, Advances in Space Research, 22, 1007, doi: 10.1016/S0273-1177(98)00136-7
-
[22]
Frank, J., King, A., & Raine, D. 1992, Accretion power in astrophysics, Vol. 21 Gaia Collaboration, Vallenari, A., Brown, A. G. A., et al. 2023, A&A, 674, A1, doi: 10.1051/0004-6361/202243940
-
[23]
Gupta, R., Kuin, N. P. M., Page, K. L., & Sakamoto, T. 2026, The Astronomer’s Telegram, 17608, 1
work page 2026
-
[24]
Harrison, F. A., Craig, W. W., Christensen, F. E., et al. 2013, ApJ, 770, 103, doi: 10.1088/0004-637X/770/2/103 HI4PI Collaboration, Ben Bekhti, N., Fl¨ oer, L., et al. 2016, A&A, 594, A116, doi: 10.1051/0004-6361/201629178
-
[25]
Ives, J. C., Sanford, P. W., & Bell Burnell, S. J. 1975, Nature, 254, 578, doi: 10.1038/254578a0
-
[26]
James, M., Paul, B., Devasia, J., & Indulekha, K. 2010, MNRAS, 407, 285, doi: 10.1111/j.1365-2966.2010.16880.x
-
[27]
Kaastra, J. S., & Bleeker, J. A. M. 2016, A&A, 587, A151, doi: 10.1051/0004-6361/201527395
-
[28]
Kalberla, P. M. W., Burton, W. B., Hartmann, D., et al. 2005, A&A, 440, 775, doi: 10.1051/0004-6361:20041864
-
[29]
Kong, L. D., Zhang, S., Ji, L., et al. 2021, ApJ, 917, L38, doi: 10.3847/2041-8213/ac1ad3
-
[30]
Krimm, H. A., Holland, S. T., Corbet, R. H. D., et al. 2013, ApJS, 209, 14, doi: 10.1088/0067-0049/209/1/14
-
[31]
Leahy, D. A. 1987, A&A, 180, 275
work page 1987
-
[32]
Levine, A. M., Bradt, H., Cui, W., et al. 1996, ApJ, 469, L33, doi: 10.1086/310260
-
[33]
2020, ApJ, 900, 41, doi: 10.3847/1538-4357/aba4a5
Liu, B.-S., Tao, L., Zhang, S.-N., et al. 2020, ApJ, 900, 41, doi: 10.3847/1538-4357/aba4a5
-
[34]
2015, MNRAS, 448, 2175, doi: 10.1093/mnras/stv125 16
Lutovinov, A., Tsygankov, S., Suleimanov, V., et al. 2015, MNRAS, 448, 2175, doi: 10.1093/mnras/stv125 16
-
[35]
Lutovinov, A. A., & Tsygankov, S. S. 2009, Astronomy Letters, 35, 433, doi: 10.1134/S1063773709070019
-
[36]
2011, MNRAS, 418, 2292, doi: 10.1111/j.1365-2966.2011.19566.x
Maitra, C., Paul, B., & Naik, S. 2012, MNRAS, 420, 2307, doi: 10.1111/j.1365-2966.2011.20196.x
-
[37]
Malacaria, C., Jenke, P., Roberts, O. J., et al. 2020, ApJ, 896, 90, doi: 10.3847/1538-4357/ab855c
-
[38]
2024, MNRAS, 531, 530, doi: 10.1093/mnras/stae1170
Rana, V. 2024, MNRAS, 531, 530, doi: 10.1093/mnras/stae1170
-
[39]
2009, PASJ, 61, 999, doi: 10.1093/pasj/61.5.999
Matsuoka, M., Kawasaki, K., Ueno, S., et al. 2009, PASJ, 61, 999, doi: 10.1093/pasj/61.5.999
-
[40]
1992, High-energy radiation from magnetized neutron stars
Meszaros, P. 1992, High-energy radiation from magnetized neutron stars
work page 1992
-
[41]
Mukerjee, K., & Antia, H. M. 2021, ApJ, 920, 139, doi: 10.3847/1538-4357/ac11f1
-
[42]
Mushtukov, A. A., Lipunova, G. V., Ingram, A., et al. 2019, MNRAS, 486, 4061, doi: 10.1093/mnras/stz948
-
[43]
1989, PASJ, 41, 1, doi: 10.1093/pasj/41.1.1
Nagase, F. 1989, PASJ, 41, 1, doi: 10.1093/pasj/41.1.1
-
[44]
Roming, P. W. A., Hunsberger, S. D., Mason, K. O., et al. 2004, in Society of Photo-Optical Instrumentation Engineers (SPIE) Conference Series, Vol. 5165, X-Ray and Gamma-Ray Instrumentation for Astronomy XIII, ed. K. A. Flanagan & O. H. W. Siegmund, 262–276, doi: 10.1117/12.504554
-
[45]
E., K¨ uhnel, M., Pottschmidt, K., et al
Rothschild, R. E., K¨ uhnel, M., Pottschmidt, K., et al. 2017, MNRAS, 466, 2752, doi: 10.1093/mnras/stw3222
-
[46]
Roy, J., Agrawal, P. C., Iyer, N. K., et al. 2019, ApJ, 872, 33, doi: 10.3847/1538-4357/aafaf1
-
[47]
2024a, A&A, 690, A50, doi: 10.1051/0004-6361/202450395
Roy, K., Manikantan, H., & Paul, B. 2024a, A&A, 690, A50, doi: 10.1051/0004-6361/202450395
-
[48]
Roy, K., Manikantan, H., & Paul, B. 2024b, MNRAS, 527, 2652, doi: 10.1093/mnras/stad3395
-
[49]
Roy, K., & Sharma, R. 2025, New A, 121, 102435, doi: 10.1016/j.newast.2025.102435 Sch¨ onherr, G., Schwarm, F.-W., Falkner, S., et al. 2014, A&A, 564, L8, doi: 10.1051/0004-6361/201322448
-
[50]
2026, A&A, 706, A322, doi: 10.1051/0004-6361/202557736
Sharma, R., Beri, A., Paul, B., et al. 2026, A&A, 706, A322, doi: 10.1051/0004-6361/202557736
-
[51]
2025, MNRAS, 538, 1046, doi: 10.1093/mnras/staf379
Sharma, R., Jain, C., Paul, B., & Beri, A. 2025, MNRAS, 538, 1046, doi: 10.1093/mnras/staf379
-
[52]
2024, MNRAS, 534, 1028, doi: 10.1093/mnras/stae2175
Sharma, R., Mandal, M., Pal, S., et al. 2024, MNRAS, 534, 1028, doi: 10.1093/mnras/stae2175
-
[53]
2002, ApJ, 565, 1134, doi: 10.1086/324548
Shirakawa, A., & Lai, D. 2002, ApJ, 565, 1134, doi: 10.1086/324548
-
[54]
2019, A&A, 622, A61, doi: 10.1051/0004-6361/201834479
Staubert, R., Tr¨ umper, J., Kendziorra, E., et al. 2019, A&A, 622, A61, doi: 10.1051/0004-6361/201834479
-
[55]
Suchy, S., Pottschmidt, K., Rothschild, R. E., et al. 2011, ApJ, 733, 15, doi: 10.1088/0004-637X/733/1/15
-
[56]
2023, ApJ, 944, 9, doi: 10.3847/1538-4357/acadde
Tamba, T., Odaka, H., Tanimoto, A., et al. 2023, ApJ, 944, 9, doi: 10.3847/1538-4357/acadde
-
[57]
Titarchuk, L. 1994, ApJ, 434, 570, doi: 10.1086/174760
-
[58]
2017, MNRAS, 470, 126, doi: 10.1093/mnras/stx1255
Tsygankov, S., Wijnands, R., Lutovinov, A., Degenaar, N., & Poutanen, J. 2017, MNRAS, 470, 126, doi: 10.1093/mnras/stx1255
-
[59]
Sunyaev, R. A. 2007, Astronomy Letters, 33, 368, doi: 10.1134/S1063773707060023 van der Klis, M., Stella, L., White, N., Jansen, F., &
-
[60]
Parmar, A. N. 1987, ApJ, 316, 411, doi: 10.1086/165210
-
[61]
Verner, D. A., Ferland, G. J., Korista, K. T., & Yakovlev, D. G. 1996, ApJ, 465, 487, doi: 10.1086/177435
-
[62]
Wilms, J., Allen, A., & McCray, R. 2000, ApJ, 542, 914, doi: 10.1086/317016
work page internal anchor Pith review doi:10.1086/317016 2000
-
[63]
Wilson-Hodge, C. A., Malacaria, C., Jenke, P. A., et al. 2018, ApJ, 863, 9, doi: 10.3847/1538-4357/aace60
discussion (0)
Sign in with ORCID, Apple, or X to comment. Anyone can read and Pith papers without signing in.