REVIEW 3 major objections 4 minor 43 references
Multi-waveband detection of quasi-periodic pulsations in a stellar flare on EK Draconis observed by XMM-Newton
T0 review · 3 major / 4 minor · reviewed 2026-08-14 · deepseek-v4-flash
Pith's one-line read Stellar X-ray flare pulses every 76 minutes, with harder X-rays leading.
desk verdict Solid QPP detection on EK Dra, but the headline energy-dependent period and phase differences rest on a stationary-sinusoid fit to a signal the paper itself shows is drifting; the Neupert conclusion is a suggestion, not a result. read the letter →
The pith
A machine-rendered reading of the paper's core claim, the machinery that carries it, and where it could break.
The reading
What carries the argument
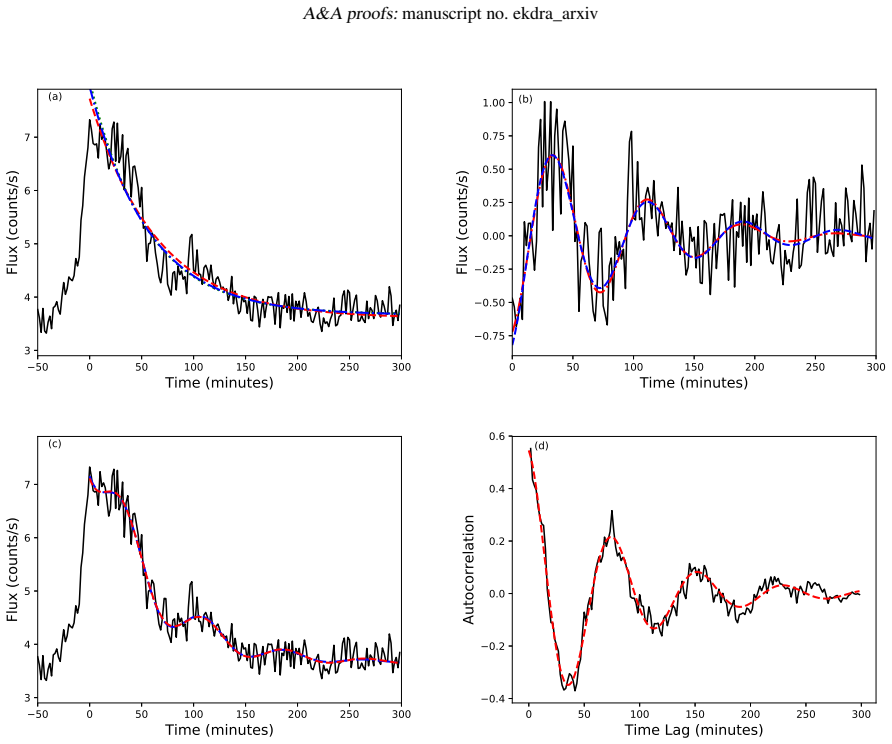
The central objects are the detrended flare residuals, obtained by subtracting an exponential decay (Eq. 1), and the exponentially and Gaussian decaying sinusoids (Eqs. 2 and 3) that are fitted to those residuals to extract the QPP period, damping time, and phase. The Morlet wavelet transform, global wavelet spectrum, autocorrelation, and cross-correlation of the residuals in different energy bands supply the period and phase measurements and the assessment of significance. The paper's interpretive mechanism is the Neupert effect: the observed high-energy lead is what would be expected if hard X-ray pulses track the time derivative of the soft X-ray emission, implying that the QPP modulates charged-particle propagation speeds or acceleration rather than modulating the X-ray intensity directly.
What would settle it
Compute the QPP period separately in the first and second halves of the 190-minute window; if the periods differ by more than the quoted ±2-minute uncertainties, the stationary-sinusoid model is rejected and the reported low- and high-band period and phase differences become suspect.
Extended reading notes
Core claim
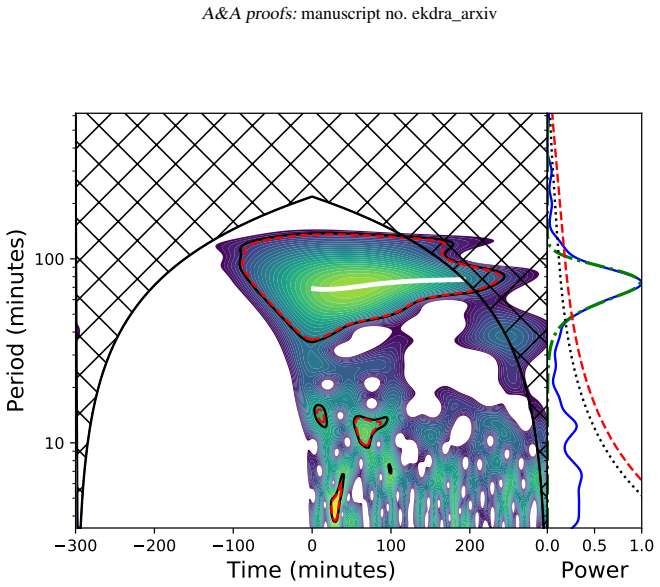
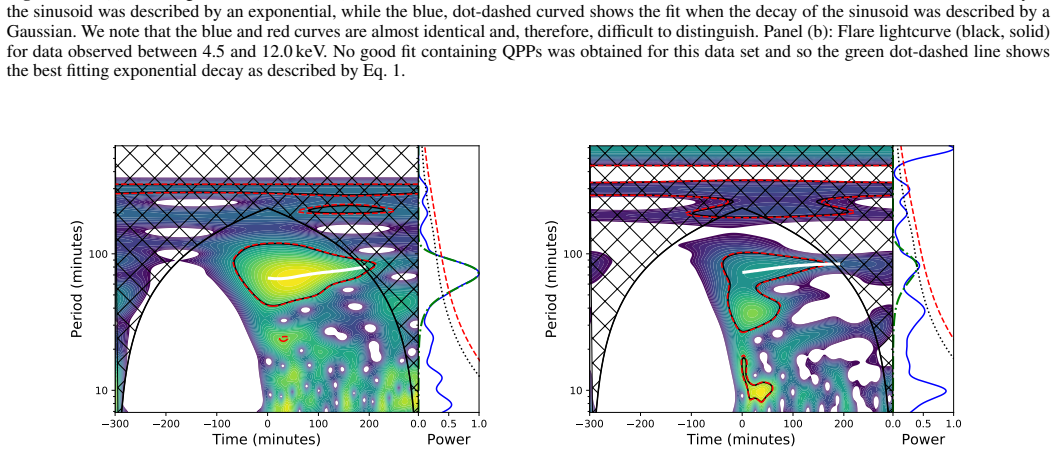
The central claim is that EK Draconis, a young Sun-like star, exhibited quasi-periodic pulsations in a large X-ray flare, with a period of 76±2 min in the 0.2–12.0 keV band. When the data are split into congruent energy bands, the fitted period is 73±2 min in the low-energy band (0.2–1.0 keV) and 82±2 min in the high-energy band (1.0–12.0 keV); the paper quantifies the period difference as significant at more than 3σ and the phase difference as significant at 9σ, with the high-energy band leading. The first peak of the cross-correlation of the detrended residuals is offset from zero by more than 3σ. The paper interprets this energy-dependent lead as evidence for the Neupert effect: high-energy X-ray emission tracks the derivative of the lower-energy emission, which in the QPP context would mean the periodic modulation acts on charged-particle propagation or acceleration. The paper also acknowledges that the wavelet peaks are broad, that the ridge of maximum power drifts from about 70 min to 77–82 min over 190 minutes, and that the period difference obtained from the wavelet spectra alone is not significant.
Load-bearing premise
The fit's quoted period, phase, and their uncertainties assume the pulsation is a stationary decaying sinusoid, yet the wavelet analysis itself shows the period drifts from about 70 to 77–82 minutes; if the signal is non-stationary, the small error bars and the claimed 3σ/9σ differences are not reliable.
Editorial extensions
If this is right
- If QPPs in stellar X-ray flares are governed by the same physics as solar flares, EK Draconis becomes a nearby laboratory for studying the solar–stellar connection in flare physics.
- Energy-dependent period and phase lags can serve as a diagnostic for whether a flare's pulsations are driven by particle-beam modulation (Neupert-like) rather than by direct modulation of the emitting plasma.
- The observed 76-minute period lies within the 9–90 minute range found in Kepler white-light stellar flares, supporting a common mechanism across wavelength regimes.
- The period-damping relation from Pugh et al. (2016) predicts a damping time consistent with the measured Gaussian damping value, so the QPP decays no faster or slower than other stellar QPPs.
- Observing more stellar X-ray flares in multiple energy bands should reveal whether EK Dra-like energy-dependent leads are common or unique.
Reading between the lines
- My extension: if the period drift shown by the wavelet ridge is real, the reported period values and their small error bars should be treated with caution; a chirp model might absorb part of the apparent low- versus high-energy difference.
- My extension: the Neupert interpretation predicts that a flare observed simultaneously in hard X-rays above 12 keV would show a high-energy pulse leading the soft-X-ray pulse by roughly the same ~4-minute offset, a testable prediction for future observations.
- My extension: the fact that the high-energy band has both a longer period and a leading phase is not naturally explained by the Neupert effect alone; a sharper test would compare the shape of the low-energy pulse with the time derivative of the high-energy pulse.
- My extension: reanalysing archival XMM-Newton flares of other young solar analogues with the same split-band procedure would show whether the ~76-minute period and energy-dependent lead are universal properties or specific to this flare.
Signed reviews
Editorial analysis
A structured set of objections, weighed in public.
Referee Report
Summary. This paper analyzes an XMM-Newton EPIC-pn observation of a stellar flare on the young solar analogue EK Draconis and reports quasi-periodic pulsations (QPPs) in the X-ray light curve. The authors detect a significant QPP with period 76±2 min in the total 0.2–12.0 keV band, and, after splitting the data, periods of 73±2 min (0.2–1.0 keV) and 82±2 min (1.0–12.0 keV). They also report a significant phase difference of 1.8±0.2 rad and a cross-correlation peak offset of 4.7±1.3 min between the two bands, with the high-energy band leading, and interpret these as possible evidence for the Neupert effect. The detection methodology combines exponential background detrending, sinusoidal model fits, wavelet analysis, autocorrelation, Monte Carlo uncertainty estimation, Fisher randomization, and red-noise significance testing.
Significance. If the multi-waveband period and phase differences are real, this would be a rare stellar observation capable of linking QPP physics to energy-dependent emission mechanisms and the Neupert effect, with implications for the solar–stellar connection. The basic QPP detection is well supported: it is confirmed by wavelet significance under white- and red-noise assumptions, by Fisher randomization, by autocorrelation, and by consistent periods from model fits. However, the load-bearing energy-dependence claims rest on stationary-sinusoid fits whose uncertainties the authors themselves state may be underestimated because the wavelet ridge shows period drift. The paper contains a clear, acknowledged tension between the model-fit uncertainties and the broad, drifting wavelet peaks, and that tension must be resolved before the Neupert interpretation can be accepted.
major comments (3)
- [Sects. 4.1, 4.2, and 5, Eqs. (2)–(3)] The claimed 3σ period difference and 9σ phase difference between the two energy bands are extracted by fitting a stationary decaying sinusoid (Eqs. 2 and 3), but the paper's own wavelet analysis shows the instantaneous period drifts: from 70 to 77 min in the total band, from 68 to 79 min in the low-energy band, and from 70 to 82 min in the high-energy band. Section 4.1 explicitly states that the uncertainties on the fitted period may be underestimated, and Section 5 repeats this concern. The Monte Carlo uncertainties in Tables 3 and 5 propagate only random noise under the exact stationary model; they do not account for this model misspecification. The 3σ and 9σ claims are therefore not robust until a drifting-period model is fitted or the significance statements are revised to match the non-significant wavelet period difference.
- [Sect. 4.2 and Table 5] The period difference between the low- and high-energy bands is presented as significant in the model fits (73±2 min versus 82±2 min), but the global wavelet periods are 74±16 min and 77±17 min, which the authors themselves state are not significantly different. Since the wavelet analysis is the method that explicitly tests period stability, and since it does not support a significant period difference, the abstract's presentation of the period difference as a headline result overstates the evidence. The conclusion should be reframed to emphasize that the period difference is a model-dependent, marginally supported effect rather than a robust multi-method detection.
- [Sect. 4.2 and Table 5] The low-energy full-flare fit gives a period of 73±2 min, whereas the low-energy residual fit gives 79±2 min and the autocorrelation gives 79±2 min. This shows that the fitted period depends on the detrending step, which is not a minor detail: the same detrending step also differs between the energy bands because the flare parameters A0, t0, and C are fitted separately for each band. The possibility that the apparent period difference between bands is an artifact of different detrending is not excluded by the 2D histograms in Appendix C, since those histograms only sample noise under the same stationary model. A sensitivity test that varies the detrending function, or that fits both bands with a common flare-decay model, would be needed to support the claim that the period difference is physical.
minor comments (4)
- [Abstract and Sect. 4.2] The abstract quotes a cross-correlation peak offset of 4.1±1.3 min, while Section 4.2 reports the median offset as 4.7±1.3 min. These values should be reconciled.
- [Sect. 4.1 and Tables 3 and 5] The phrase "Histogram fit" in the tables is ambiguous; it should be clarified that this refers to the Gaussian fit to the Monte Carlo histogram of each parameter, as opposed to the median and quartile values.
- [Sect. 2 and throughout] The term "congruent energy bands" is non-standard; since 0.2–1.0 keV and 1.0–12.0 keV are not equal in width, "contiguous" or "adjacent" would be a clearer description.
- [Eqs. (2)–(4)] The phase convention in the cos(2πt/P + φ) terms should be stated explicitly, including the zero-time reference and the treatment of phase wrapping, because the reported phase difference of 1.8±0.2 rad is a key quantity and its interpretation depends on this convention.
Circularity Check
No significant circularity; the QPP detection is self-contained, and the only self-citation is a non-load-bearing external consistency check.
full rationale
The paper's central claim—that QPPs are detected in the EK Dra flare and that the period and phase differ between energy bands—is derived directly from the XMM-Newton data using the paper's own analysis steps: detrending with Eq. 1, fitting the decaying sinusoids of Eqs. 2 and 3, wavelet and autocorrelation analysis, cross-correlation, and Monte Carlo uncertainty estimation. These steps are described and executed within the paper, so the derivation does not depend on any prior result for its content. The self-citations (Pugh et al. 2015, 2016) are used for methodology or as an external benchmark. In Sect. 5, the empirical period-damping relation from Pugh et al. (2016), Eq. 5, is used to predict a damping time from the flare's period, but that relation was fitted to an independent sample of Kepler QPP flares, not to EK Dra data, so this is a consistency check rather than a circular prediction. The paper also explicitly acknowledges a potential limitation: the wavelet ridge drifts in period with time, and fitting a stationary sinusoid (Eqs. 2 and 3) may underestimate period uncertainties (Sects. 4.1 and 5). This is a model-misspecification or statistical robustness concern, not circularity, because the fitted periods and phases are compared with independent wavelet and cross-correlation results rather than being defined as the target conclusion. No equation is defined in terms of the target result, no fitted parameter is renamed as a prediction, and no uniqueness or ansatz is imported via self-citation in a load-bearing way. The claimed significance levels may be inflated by the stationary-sinusoid assumption, but that does not make the derivation circular. Accordingly, the circularity score is low.
Assumptions & free parameters
free parameters (13)
- A0 (flare amplitude) =
4.12±0.07 counts/s (total); 2.81±0.15 (low); 2.40±0.10 (high)
- t0 (e-folding time) =
63.8±1.7 min (total); 56±4 (low); 51±3 (high)
- C (quiescent flux) =
3.60±0.02 counts/s (total); 3.30±0.03 (low); 1.08±0.01 (high)
- Ae (QPP amplitude, exponential) =
0.748±0.011 counts/s (total full-flare fit)
- Be (QPP time offset, exponential) =
17.9±6.5 min (total full-flare fit)
- τe (QPP damping time, exponential) =
88.3±9.4 min (total full-flare fit)
- Pe (QPP period, exponential) =
76.1±1.0 min (total); 73±2 (low); 82±2 (high)
- φe (QPP phase, exponential) =
3.28±0.12 rad (total); 2.8±0.1 (low); 4.0±0.2 (high)
- Ag (QPP amplitude, Gaussian) =
0.74±0.15 counts/s (total full-flare fit)
- τg (QPP damping time, Gaussian) =
110±44 min (total full-flare fit)
- Pg (QPP period, Gaussian) =
76.1±1.2 min (total); 73±2 (low); 82±2 (high)
- φg (QPP phase, Gaussian) =
3.31±0.10 rad (total); 2.9±0.2 (low); 4.0±0.2 (high)
- Bg (QPP time offset, Gaussian) =
-17±95 min (total full-flare fit)
assumptions (5)
- domain assumption The flare decay is adequately represented by a single exponential (Eq. 1), so the detrended residuals isolate the QPP plus noise.
- standard math The wavelet significance tests use a white-noise null hypothesis, with a red-noise hypothesis as an additional check (Torrence & Compo 1998).
- domain assumption The QPP can be modelled as a stationary exponentially or Gaussian damped sinusoid (Eqs. 2 and 3).
- domain assumption Monte Carlo perturbation of the count rates by Gaussian noise with the formal errors characterizes the parameter uncertainties.
- ad hoc to paper The cross-correlation of the two energy-band residuals is well described by a Gaussian-damped sinusoid for estimating the peak offset.
Cite this review
Pith. "Pith review of Multi-waveband detection of quasi-periodic pulsations in a stellar flare on EK Draconis observed by XMM-Newton." pith.science (2026). https://pith.science/paper/B4PHOURG
@misc{pith2026190806033,
  author       = {Pith},
  title        = {Pith review of: Multi-waveband detection of quasi-periodic pulsations in a stellar flare on EK Draconis observed by XMM-Newton},
  year         = {2026},
  howpublished = {\url{https://pith.science/paper/B4PHOURG}},
  note         = {Machine review of arXiv:1908.06033}
}
read the original abstract
Context. Quasi-periodic pulsations (QPPs) are time variations in the energy emission during a flare that are observed on both the Sun and other stars and thus have the potential to link the physics of solar and stellar flares. Aims. To characterise the QPPs detected in an X-ray flare on the solar analogue, EK Draconis, which was observed by XMM-Newton. Methods. We use wavelet and autocorrelation techniques to identify the QPPs in a detrended version of the flare. We also fit a model to the flare based on an exponential decay combined with a decaying sinusoid. The flare is examined in multiple energy bands. Results. A statistically significant QPP is observed in the X-ray energy band of 0.2-12.0 keV with a periodicity of 76+/-2 min. When this energy band is split, a statistically significant QPP is observed in the low-energy band (0.2-1.0 keV) with a periodicity of 73+/-2 min and in the high-energy band (1.0-12.0 keV) with a periodicity of 82+/-2 min. When fitting a model to the time series the phases of the signals are also found to be significantly different in the two energy bands (with a difference of 1.8+/-0.2 rad) and the high-energy band is found to lead the low-energy band. Furthermore, the first peak in the cross-correlation between the detrended residuals of the low- and high-energy bands is offset from zero by more than 3{\sigma} (4.1+/-1.3 min). Both energy bands produce statistically significant regions in the wavelet spectrum, whose periods are consistent with those listed above. However, the peaks are broad in both the wavelet and global power spectra, with the wavelet showing evidence for a drift in period with time, and the difference in period obtained is not significant. etc...
Figures

Figures from the paper (5 more)



Reference graph
Works this paper leans on
-
[1]
M., Mathioudakis, M., Van Doorsselaere, T., & Kowalski, A
Anfinogentov, S., Nakariakov, V . M., Mathioudakis, M., Van Doorsselaere, T., & Kowalski, A. F. 2013, ApJ, 773, 156 Auchère, F., Froment, C., Bocchialini, K., Buchlin, E., & Solomon, J. 2016, ApJ, 825, 110
work page 2013
-
[2]
Audard, M., Güdel, M., & Guinan, E. F. 1999, ApJ, 513, L53
work page 1999
- [3]
-
[4]
Cho, I.-H., Cho, K.-S., Nakariakov, V . M., Kim, S., & Kumar, P. 2016, ApJ, 830, 110
work page 2016
- [5]
-
[6]
Dorren, J. D. & Guinan, E. F. 1994, ApJ, 428, 805
work page 1994
-
[7]
Doyle, J. G., Shetye, J., Antonova, A. E., et al. 2018, MNRAS, 475, 2842
work page 2018
- [8]
Show all 43 references
-
[9]
W., Riello, M., De Angeli, F., et al
Evans, D. W., Riello, M., De Angeli, F., et al. 2018, A&A, 616, A4
2018
-
[10]
L., et al
Fichtinger, B., Güdel, M., Mutel, R. L., et al. 2017, A&A, 599, A127
2017
-
[11]
1935, The design of experiments
Fisher, R. 1935, The design of experiments. 1935 (Edinburgh: Oliver and Boyd) Gaia Collaboration, Brown, A. G. A., Vallenari, A., et al. 2018, A&A, 616, A1 Gaia Collaboration, Prusti, T., de Bruijne, J. H. J., et al. 2016, A&A, 595, A1
1935
-
[12]
Guedel, M., Schmitt, J. H. M. M., Benz, A. O., & Elias, II, N. M. 1995, A&A, 301, 201
1995
-
[13]
F., Ribas, I., & Harper, G
Guinan, E. F., Ribas, I., & Harper, G. M. 2003, ApJ, 594, 561
2003
-
[14]
D., Aschwanden, M
Holman, G. D., Aschwanden, M. J., Aurass, H., et al. 2011, Space Sci. Rev., 159, 107
2011
-
[15]
W., Ruderman, M., Pascoe, D
Hood, A. W., Ruderman, M., Pascoe, D. J., et al. 2013, A&A, 551, A39
2013
-
[16]
Hudson, H. S. 2015, in Journal of Physics Conference Series, V ol. 632, Journal of Physics Conference Series, 012058
2015
-
[17]
R., Ireland, J., Dennis, B
Inglis, A. R., Ireland, J., Dennis, B. R., Hayes, L., & Gallagher, P. 2016, ApJ, 833, 284
2016
-
[18]
Y ., Pugh, C
Kolotkov, D. Y ., Pugh, C. E., Broomhall, A.-M., & Nakariakov, V . M. 2018, ApJ, 858, L3
2018
-
[19]
G., Melnikov, V
Kupriyanova, E. G., Melnikov, V . F., Nakariakov, V . M., & Shibasaki, K. 2010, Sol. Phys., 267, 329
2010
-
[20]
L., Bushinsky, R., Ayres, T., Fontenla, J., & France, K
Linsky, J. L., Bushinsky, R., Ayres, T., Fontenla, J., & France, K. 2012, ApJ, 745, 25
2012
-
[21]
2012, Nature, 485, 478
Maehara, H., Shibayama, T., Notsu, S., et al. 2012, Nature, 485, 478
2012
-
[22]
2015, Earth, Planets, and Space, 67, 59
Maehara, H., Shibayama, T., Notsu, Y ., et al. 2015, Earth, Planets, and Space, 67, 59
2015
-
[23]
A., Nakariakov, V
McLaughlin, J. A., Nakariakov, V . M., Dominique, M., Jelínek, P., & Takasao, S. 2018, Space Sci. Rev., 214, 45
2018
-
[24]
M., Foullon, C., Verwichte, E., & Young, N
Nakariakov, V . M., Foullon, C., Verwichte, E., & Young, N. P. 2006, A&A, 452, 343
2006
-
[25]
Neupert, W. M. 1968, ApJ, 153, L59
1968
-
[26]
& Behar, E
Nordon, R. & Behar, E. 2008, A&A, 482, 639
2008
-
[27]
J., Anfinogentov, S., Nisticò, G., Goddard, C
Pascoe, D. J., Anfinogentov, S., Nisticò, G., Goddard, C. R., & Nakariakov, V . M. 2017, A&A, 600, A78
2017
-
[28]
J., Goddard, C
Pascoe, D. J., Goddard, C. R., Nisticò, G., Anfinogentov, S., & Nakariakov, V . M. 2016, A&A, 585, L6
2016
-
[29]
J., Hood, A
Pascoe, D. J., Hood, A. W., de Moortel, I., & Wright, A. N. 2012, A&A, 539, A37
2012
-
[30]
E., Armstrong, D
Pugh, C. E., Armstrong, D. J., Nakariakov, V . M., & Broomhall, A.-M. 2016, MNRAS, 459, 3659
2016
-
[31]
E., Nakariakov, V
Pugh, C. E., Nakariakov, V . M., & Broomhall, A.-M. 2015, ApJ, 813, L5 Article number, page 10 of 19 Broomhall et al.: QPPs in a flare on EK Dra
2015
-
[32]
Myagkova, I. N. 2017, A&A, 608, A101
2017
-
[33]
P., Rosen, S., Fyfe, D., & Schröder, A
Pye, J. P., Rosen, S., Fyfe, D., & Schröder, A. C. 2015, A&A, 581, A28
2015
-
[34]
F., Güdel, M., & Audard, M
Ribas, I., Guinan, E. F., Güdel, M., & Audard, M. 2005, ApJ, 622, 680 Rosén, L., Kochukhov, O., Hackman, T., & Lehtinen, J. 2016, A&A, 593, A35
2005
-
[35]
2005, A&A, 432, 671 Simões, P
Scelsi, L., Maggio, A., Peres, G., & Pallavicini, R. 2005, A&A, 432, 671 Simões, P. J. A., Fletcher, L., Hudson, H. S., & Russell, A. J. B. 2013, ApJ, 777, 152
2005
-
[36]
Soderblom, D. R. & Clements, S. D. 1987, AJ, 93, 920 Strüder, L., Briel, U., Dennerl, K., et al. 2001, A&A, 365, L18
1987
-
[37]
2005, ApJ, 622, 653
Telleschi, A., Güdel, M., Briggs, K., et al. 2005, ApJ, 622, 653
2005
-
[38]
& Compo, G
Torrence, C. & Compo, G. P. 1998, A Practical Guide to Wavelet Analysis
1998
-
[39]
Turner, M. J. L., Abbey, A., Arnaud, M., et al. 2001, A&A, 365, L27 Van Doorsselaere, T., De Groof, A., Zender, J., Berghmans, D., & Goossens, M. 2011, ApJ, 740, 90
2001
-
[40]
S., & Antolin, P
Verwichte, E., Van Doorsselaere, T., White, R. S., & Antolin, P. 2013, A&A, 552, A138
2013
-
[41]
A., Gregory, S
Vidotto, A. A., Gregory, S. G., Jardine, M., et al. 2014, MNRAS, 441, 2361
2014
-
[42]
A., Marsden, S
Waite, I. A., Marsden, S. C., Carter, B. D., et al. 2017, MNRAS, 465, 2076
2017
-
[43]
V ., Melnik, V
Zaqarashvili, T. V ., Melnik, V . N., Brazhenko, A. I., et al. 2013, A&A, 555, A55 Article number, page 11 of 19 A&A proofs: manuscript no. ekdra_arxiv Appendix A: Histograms for fits to total-energy band To determine both the quality of the fit to the data and to pro- duce reli...
2013
Reviewed August 14, 2026 · model on record in the stance chip above.
Discussion (0). Continue with ORCID to comment.