Polarization Angle Geodesics in PSRs B1133+16 and B2016+28
Pith reviewed 2026-06-26 09:39 UTC · model grok-4.3
The pith
Pulsar polarization angles follow great circles on the Poincare sphere due to mode transitions.
A machine-rendered reading of the paper's core claim, the machinery that carries it, and where it could break.
Core claim
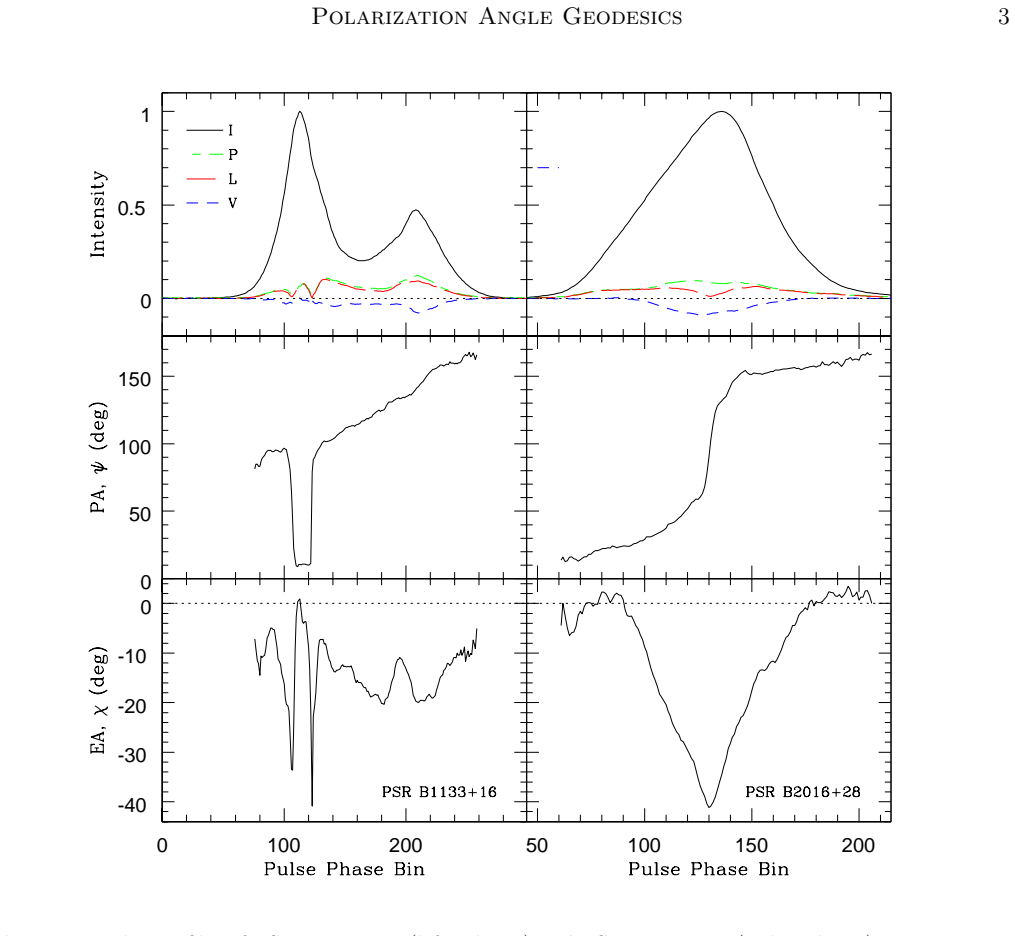
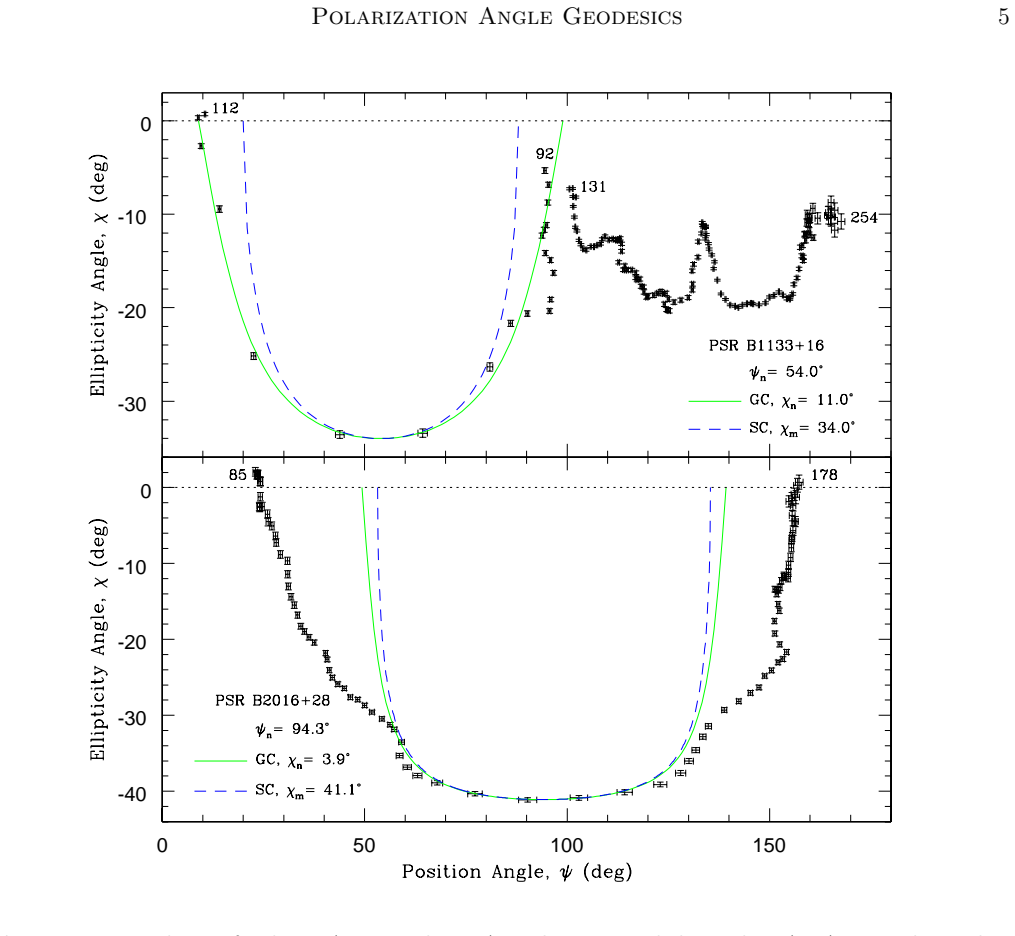
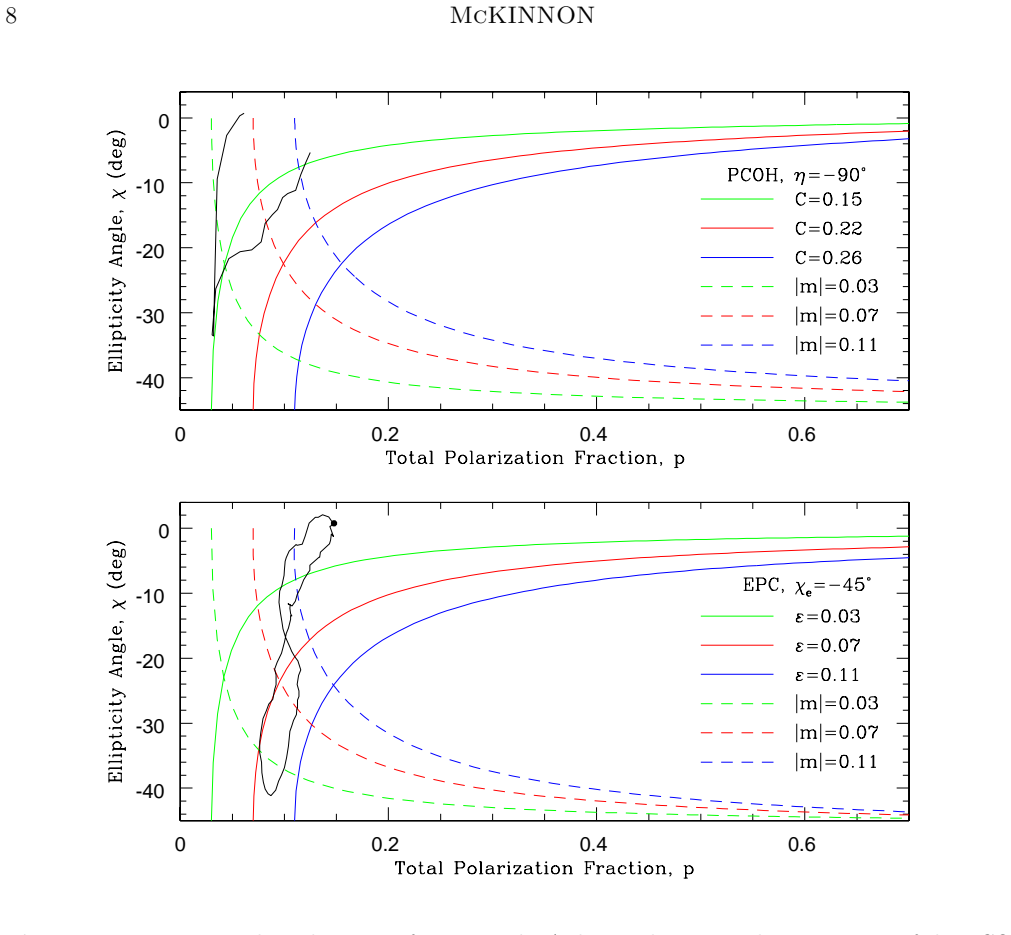
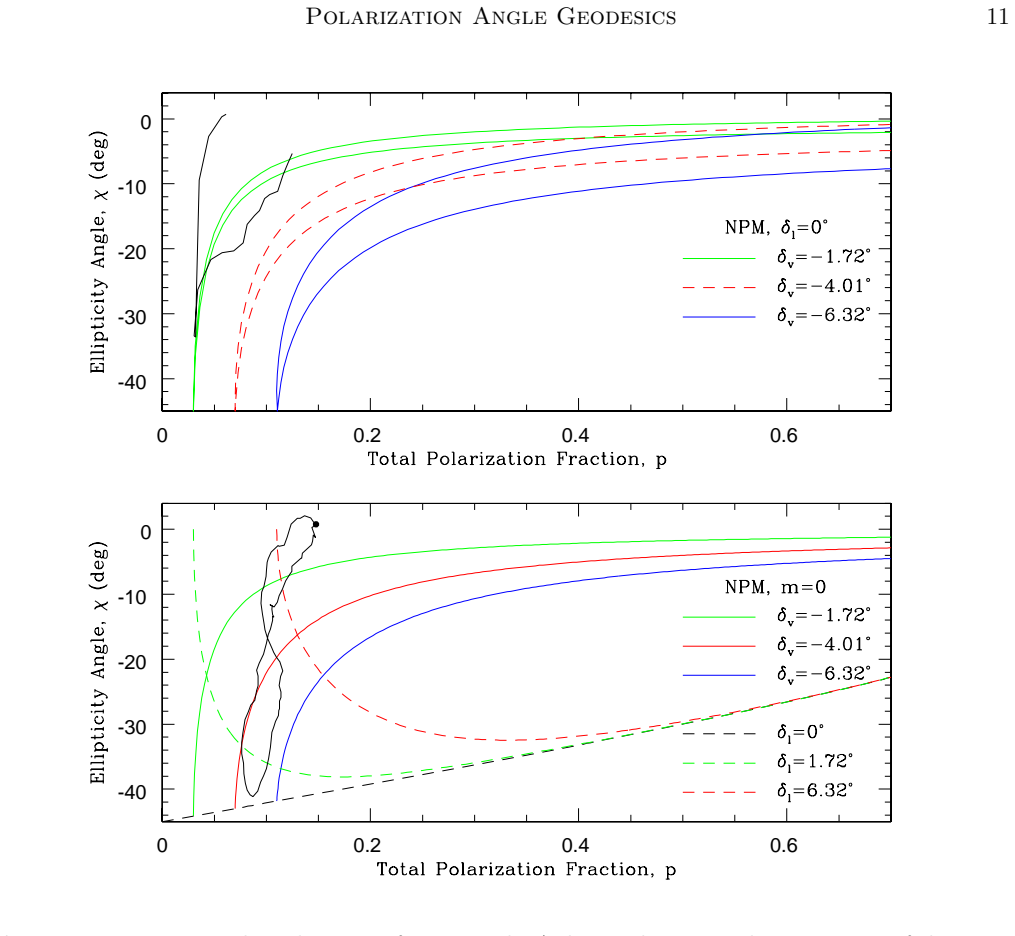
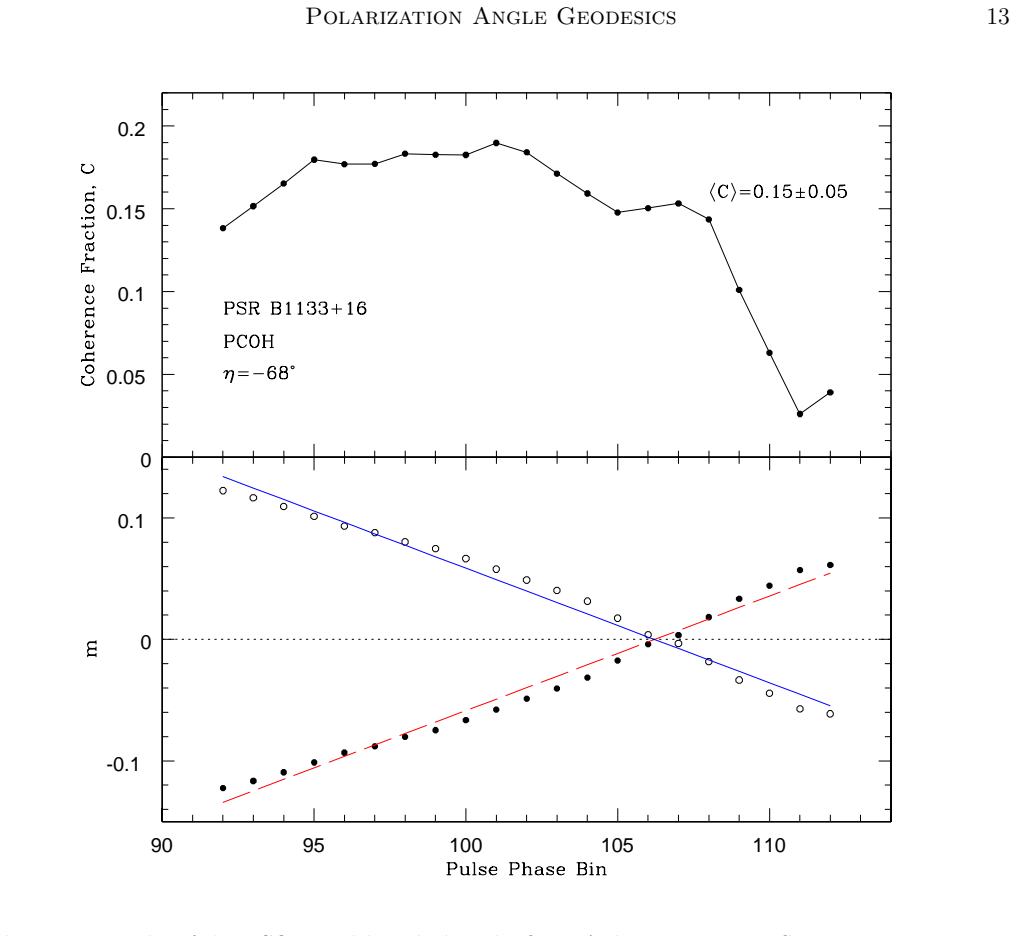
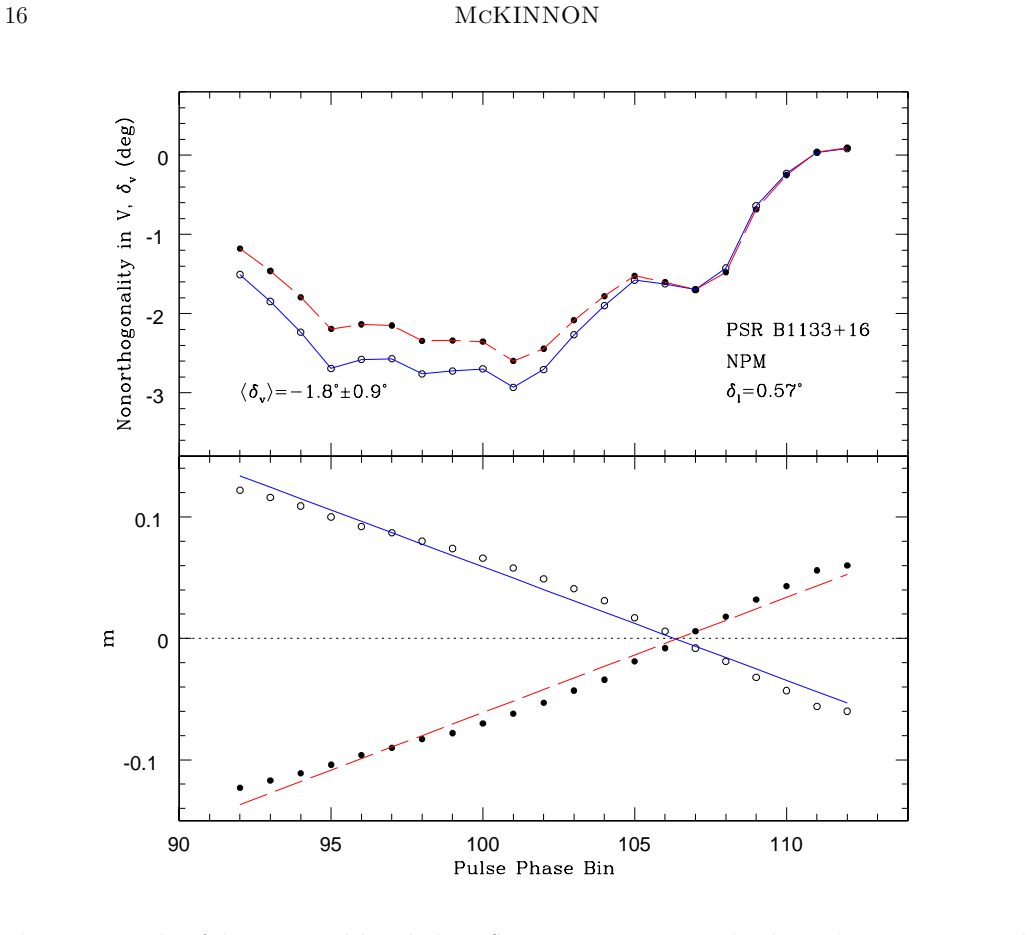
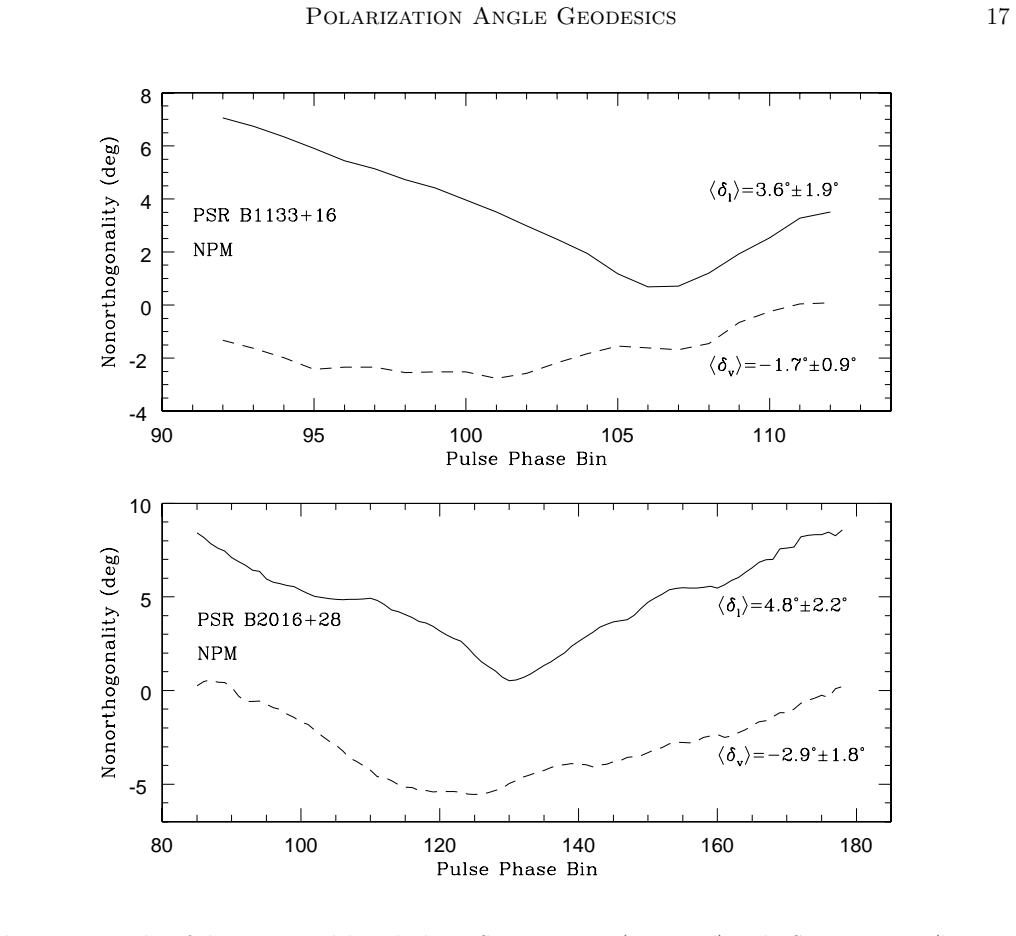
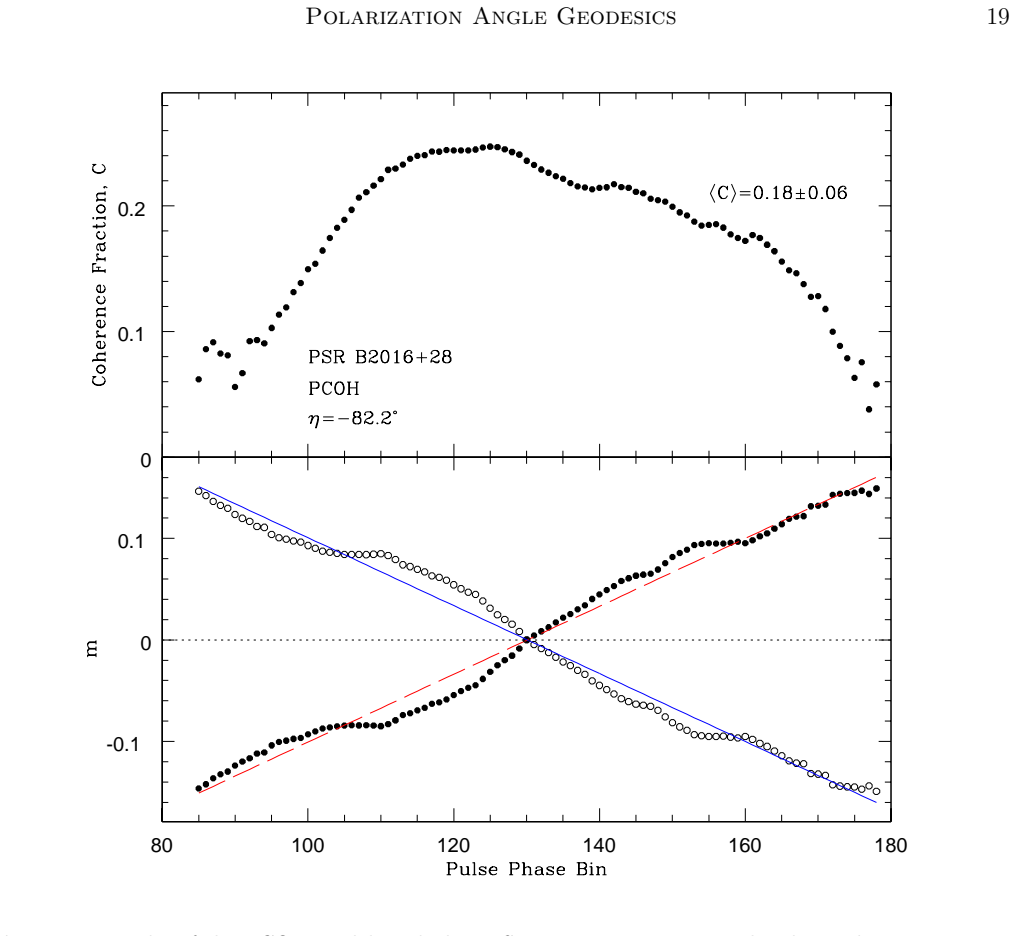
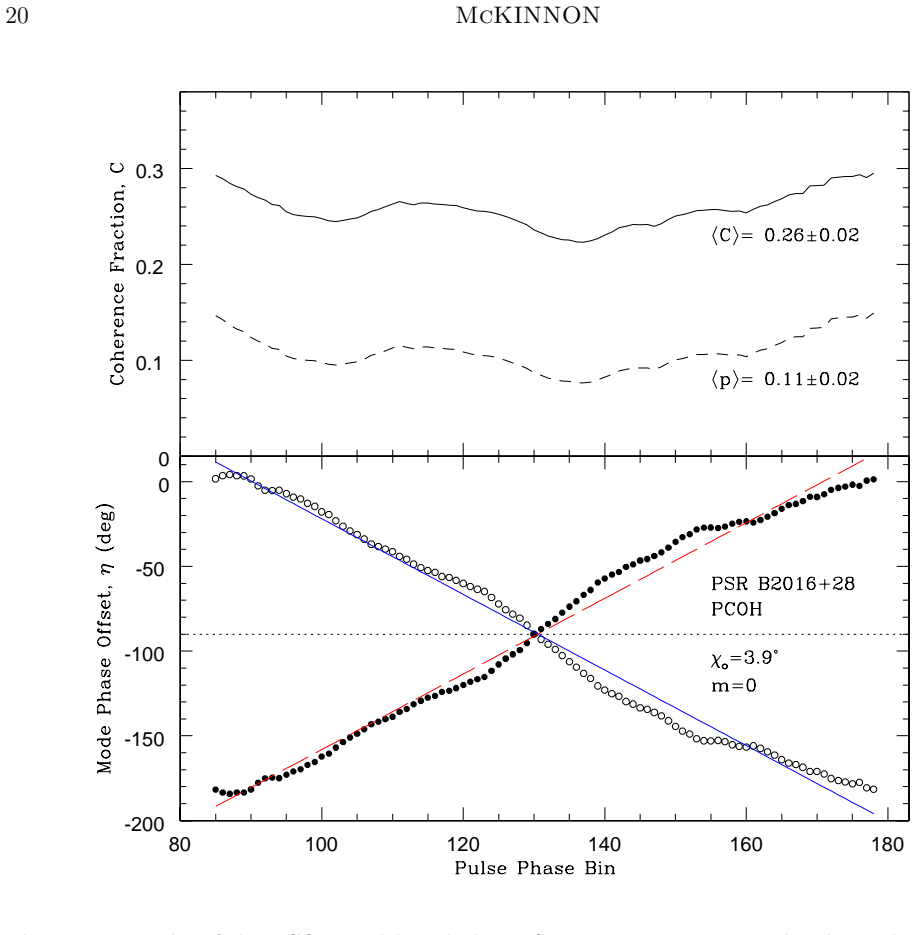
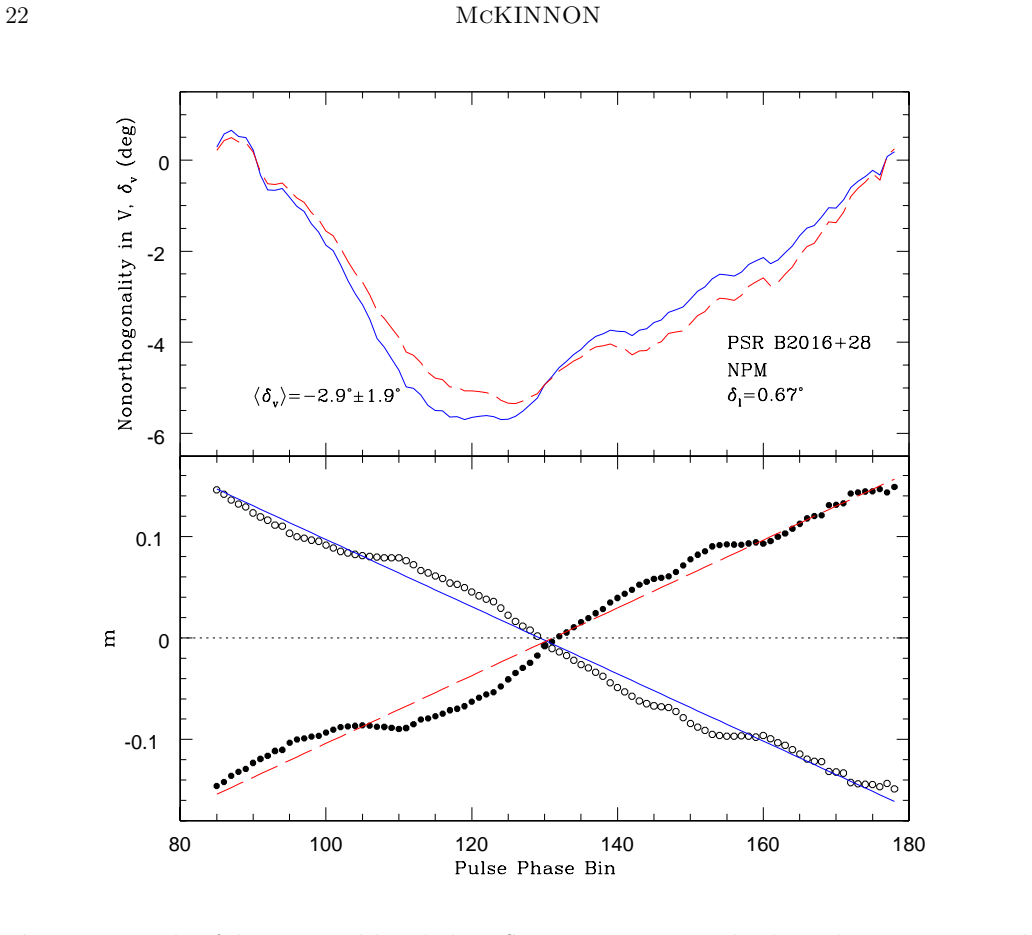
The polarization angles observed in part of PSR B1133+16 follow a great circle on the Poincare sphere. The angles observed across the pulse of PSR B2016+28 follow an arc that resembles a portion of a great circle that has been altered by the pulsar's rotation. The observations are interpreted within the context of three different polarization models. All three models produce similar results for both pulsars and indicate that the observed geodesics are caused by mode transitions. The arc observed in PSR B2016+28 can also be interpreted as a vector rotation, provided the modes are elliptically polarized.
What carries the argument
Transitions in dominance between two orthogonal polarization modes, with changing relative intensity versus pulse longitude, that trace a great circle (or arc) on the Poincare sphere.
If this is right
- Mode transitions produce geodesics away from the equatorial plane of the Poincare sphere.
- Arcs and partial circles may occur more commonly in pulsar polarization profiles than previously recognized.
- The arc in PSR B2016+28 admits an alternative interpretation as a phase-driven vector rotation when the modes are elliptically polarized.
- The same three models give consistent results across both pulsars, supporting mode transitions as the common mechanism.
Where Pith is reading between the lines
- Repeating the analysis on a larger set of pulsars would test how frequently mode-transition arcs appear.
- Wavelength-dependent observations could separate intensity-driven from phase-driven paths more cleanly than longitude-only data allow.
- If the geodesics survive subtraction of known propagation effects, they could serve as a direct probe of mode competition in the emission region.
Load-bearing premise
The observed polarization angles are produced solely by the relative intensities or phases of two orthogonal modes without significant additional effects from propagation, scattering, or instrumental leakage.
What would settle it
High-resolution polarization measurements of the same pulse phases in either pulsar that deviate from the predicted great-circle paths once estimated propagation and scattering contributions are removed.
Figures
read the original abstract
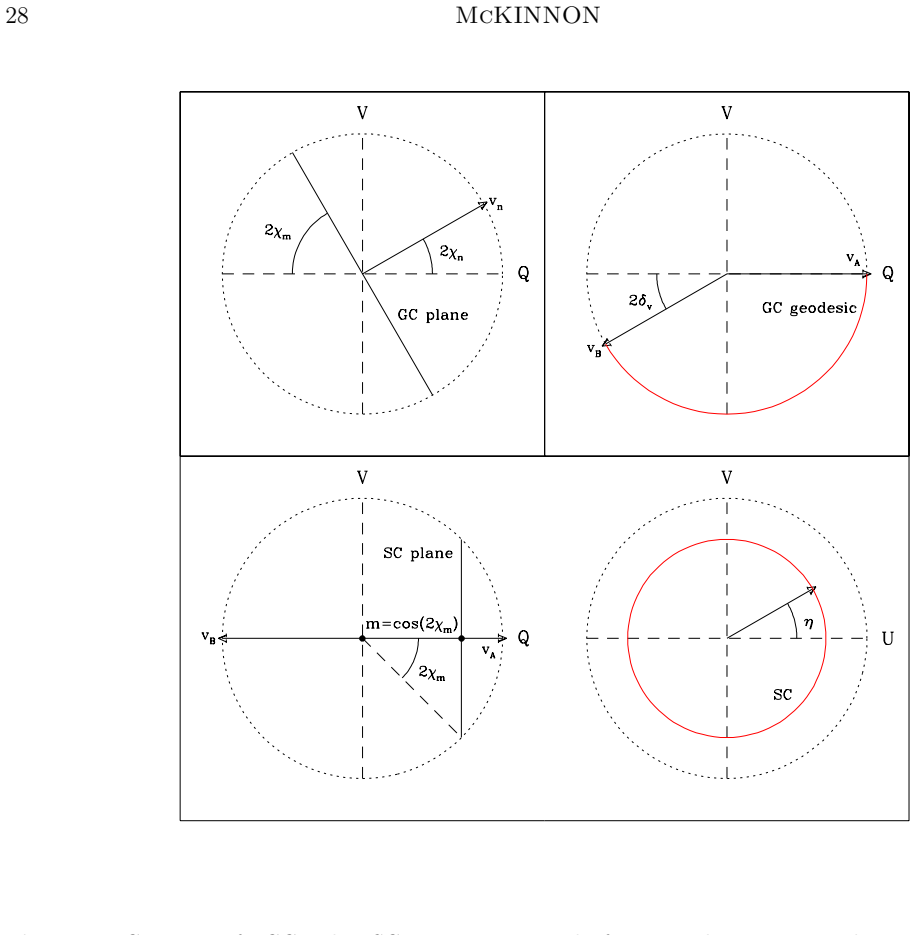
Recent models of pulsar polarization predict that the position and ellipticity angles of the polarization vector can trace portions of a small or great circle on the Poincare sphere. A great circle can arise from a transition in dominance of orthogonal polarization modes, where the relative intensity of the modes changes with pulse longitude. A small circle may be caused by a rotation of the vector, where the phase difference between the modes changes with pulse longitude or wavelength. Observations of PSRs B1133+16 and B2016+28 are reanalyzed to search for these polarization features within their pulse profiles. The polarization angles observed in part of PSR B1133+16 are shown to follow a great circle on the Poincare sphere. The angles observed across the pulse of PSR B2016+28 follow an arc that resembles a portion of a great circle that has been altered by the pulsar's rotation. The observations are interpreted within the context of three different polarization models. All three models produce similar results for both pulsars and indicate that the observed geodesics are caused by mode transitions. The arc observed in PSR B2016+28 can also be interpreted as a vector rotation, provided the modes are elliptically polarized. The observations and accompanying analysis show that mode transitions are not restricted to the equatorial plane of the Poincare sphere and that arcs and partial circles may be more common than previously recognized.
Editorial analysis
A structured set of objections, weighed in public.
Referee Report
Summary. The paper reanalyzes existing radio polarization observations of PSRs B1133+16 and B2016+28. It reports that the polarization angles in a portion of the B1133+16 profile trace a great circle on the Poincaré sphere, while those across the B2016+28 pulse trace an arc resembling a portion of a great circle modified by rotation. These features are interpreted as arising from transitions in dominance between orthogonal polarization modes, with supporting results from three distinct polarization models that all indicate mode transitions rather than pure vector rotation.
Significance. If the geodesic identification is placed on a quantitative footing, the result would indicate that orthogonal-mode transitions are not confined to the equatorial plane of the Poincaré sphere and that partial arcs may be more common than previously appreciated. The consistency across three independent models is a positive feature of the analysis.
major comments (3)
- [Abstract] Abstract: the central claim that the observed angles 'follow a great circle' or 'resemble a portion of a great circle' is presented without any quantitative metric (maximum angular deviation, rms residual, or goodness-of-fit statistic) or comparison of model predictions to the measured angles; visual inspection alone cannot support the mode-transition interpretation.
- [Abstract] Abstract and § on observations: no error bars, data-exclusion criteria, or sensitivity tests are reported for the polarization angles or ellipticities; without these, it is impossible to assess whether residual contributions from propagation, scattering, or leakage could exceed a few degrees and thereby invalidate the geodesic identification.
- [Abstract] Abstract: the statement that 'all three models produce similar results' is not accompanied by any tabulated comparison of predicted versus observed angles, differences between models, or residual maps, leaving the robustness of the mode-transition conclusion unquantified.
minor comments (1)
- Notation for the Poincaré-sphere coordinates (position angle, ellipticity) should be defined explicitly at first use rather than assumed from prior literature.
Simulated Author's Rebuttal
We thank the referee for the constructive comments, which highlight areas where the manuscript can be strengthened with additional quantitative detail. We address each major comment below and will incorporate the suggested improvements in a revised version.
read point-by-point responses
-
Referee: [Abstract] Abstract: the central claim that the observed angles 'follow a great circle' or 'resemble a portion of a great circle' is presented without any quantitative metric (maximum angular deviation, rms residual, or goodness-of-fit statistic) or comparison of model predictions to the measured angles; visual inspection alone cannot support the mode-transition interpretation.
Authors: We agree that explicit quantitative metrics will strengthen the claim. The figures demonstrate close adherence, but in revision we will add RMS residuals, maximum angular deviations from the fitted great circle, and a chi-squared goodness-of-fit comparison between the mode-transition model and a pure vector-rotation model. These will be reported in the abstract and analysis sections. revision: yes
-
Referee: [Abstract] Abstract and § on observations: no error bars, data-exclusion criteria, or sensitivity tests are reported for the polarization angles or ellipticities; without these, it is impossible to assess whether residual contributions from propagation, scattering, or leakage could exceed a few degrees and thereby invalidate the geodesic identification.
Authors: We will revise the observations section to include error bars on all polarization angles and ellipticities, explicitly document the S/N and linear-polarization thresholds used for data inclusion, and add a brief sensitivity test demonstrating that the geodesic identification remains stable under plausible levels of additional scatter from propagation or leakage. revision: yes
-
Referee: [Abstract] Abstract: the statement that 'all three models produce similar results' is not accompanied by any tabulated comparison of predicted versus observed angles, differences between models, or residual maps, leaving the robustness of the mode-transition conclusion unquantified.
Authors: We will add a table in the revised manuscript that lists the best-fit parameters from each of the three models, together with RMS residuals between model predictions and observed angles for both pulsars. This will quantify the similarity across models and support the mode-transition interpretation. revision: yes
Circularity Check
No circularity: reanalysis applies external models to data without self-referential reduction
full rationale
The paper reanalyzes existing polarization observations of two pulsars by mapping position and ellipticity angles onto the Poincare sphere and comparing the resulting paths to predictions from three polarization models. The models are invoked as independent frameworks (great-circle geodesics from orthogonal-mode intensity transitions; small-circle arcs from phase rotation), and the text states that all three yield similar results without any parameter being fitted to the target geodesics themselves. No equation or claim reduces the observed arc to a quantity defined by the same data, no self-citation supplies a uniqueness theorem that forces the interpretation, and no ansatz is smuggled in. The analysis is therefore self-contained against external benchmarks and receives the default non-circularity finding.
Axiom & Free-Parameter Ledger
axioms (1)
- domain assumption Polarization vectors can be represented on the Poincare sphere with position and ellipticity angles tracing geodesics under mode transitions.
Reference graph
Works this paper leans on
-
[1]
Allen, M. C. & Melrose, D. B. 1982, PASA, 4, 365, doi:10.1017/S1323358000021147
-
[2]
Backer, D. C. & Rankin, J. M. 1980, ApJS, 42, 143, doi: 10.1086/190647 Polarization Angle Geodesics 33
-
[3]
Barnard, J. J. & Arons, J. A. 1986, ApJ, 302, 138, doi: 10.1086/163979
-
[4]
Bera, A., James, C., McKinnon, M. M., et al. 2025, ApJ, 982, 119, doi: 10.3847/1538-4357/adba59
-
[5]
2025, ApJ, 983, 43, doi: 10.3847/1538-4357/adbe33
Cao, S., Jiang, J., Dyks, J., et al. 2025, ApJ, 983, 43, doi: 10.3847/1538-4357/adbe33
-
[6]
Cocke, W. J. & Pacholczyk, A. G. 1976, ApJ, 204, L13, doi: 10.1086/182044
-
[7]
Cordes, J. M., Rankin, J., & Backer, D. C. 1978, ApJ, 223, 961, doi: 10.1086/156328
-
[8]
Dobie, D., Zic, A., Oswald, L. S., et al. 2024, MNRAS, 535, 909, doi: 10.1093/mnras/stae2376
-
[9]
2020, MNRAS, 495, L118, doi: 10.1093/mnras/slaa073
Dyks, J. 2020, MNRAS, 495, L118, doi: 10.1093/mnras/slaa073
-
[10]
2021, MNRAS, 501, 2156, doi: 10.1093/mnras/staa3762 (DWI)
Dyks, J., Weltevrede, P., & Ilie, C. 2021, MNRAS, 501, 2156, doi: 10.1093/mnras/staa3762 (DWI)
-
[11]
Edwards, R. T. & Stappers, B. W. 2004, A&A, 421, 681, doi: 10.1051/0004-6361:20040228 (ES04)
-
[13]
Ilie, C. D., Weltevrede, P., Johnston, S. & Chen, T. 2020, MNRAS, 491, 3385, doi: 10.1093/mnras/stz3167
-
[14]
Kennett, M. & Melrose, D. 1998, PASA, 15, 211, doi: 10.1071/AS98211
-
[15]
E., Johnston, S., Lyutikov, M., et al
Lower, M. E., Johnston, S., Lyutikov, M., et al. 2024, NatAs, 8, 606, doi: 10.1038/s41550-024-02225-8
-
[16]
2017 Direct Observation of Two-step Magnetic Reconnection in a Solar Flare.Astrophys
Lyutikov, M. 2022, ApJ, 933, L6, doi: 10.3847/2041- 8213/ac786f
-
[17]
Manchester, R. N., Taylor, J. H., & Huguenin, G. R. 1975, ApJ, 196, 83, doi: 10.1086/153395
-
[18]
McKinnon, M. M. 2003, ApJ, 590, 1026, doi: 10.1086/375129 (M03)
-
[20]
McKinnon, M. M. 2024, ApJ, 973, 35, doi: 10.3847/1538- 4357/ad6443 (M24)
-
[21]
McKinnon, M. M. 2025a, ApJ, 982, 136, doi: 10.3847/1538-4357/adb7e1
-
[22]
McKinnon, M. M. 2025b, ApJ, 991, 155, doi: 10.3847/1538-4357/adfa29
-
[23]
Melrose, D. B. 1979, AuJPh, 32, 61, doi: 10.1071/PH790061
-
[24]
S., Karastergiou, A., & Johnston, S
Oswald, L. S., Karastergiou, A., & Johnston, S. 2023, MNRAS, 525, 840, doi:10.1093/mnras/stad2271 (OKJ)
-
[25]
Pacholczyk, A. G. 1973, MNRAS, 163, 29, doi:10.1093/mnras/163.1.29P
-
[26]
Petrova, S. A. 2001, A&A, 378, 883, doi:10.1051/0004- 6361:20011297
-
[27]
2026, PASA, accepted, doi:10.48550/arXiv.2603.07857
Pritchard, J., Murphy, T., Dobie, D., et al. 2026, PASA, accepted, doi:10.48550/arXiv.2603.07857
-
[28]
& Cooke, D
Radhakrishnan, V. & Cooke, D. J. 1969, ApL, 3, 225
1969
-
[29]
Sazonov, V. N. 1969, Sov. Phys. JETP, 29, 578
1969
-
[30]
Stinebring, D. R., Cordes, J. M., Rankin, J. M., et al. 1984, ApJS, 55, 247, doi: 10.1086/190954 (S84)
discussion (0)
Sign in with ORCID, Apple, or X to comment. Anyone can read and Pith papers without signing in.