REVIEW 3 major objections 4 minor 37 references
Observational mapping of the mass discrepancy in eclipsing binaries. A new self-contained framework for concurrent analysis of photometric and spectroscopic time series
T0 review · 3 major / 4 minor · reviewed 2026-08-06 · deepseek-v4-flash
Pith's one-line read The paper claims that part of the mass discrepancy in eclipsing binaries is an artefact of the traditional iterative analysis, and shows that one self-consistent fit surfaces a second, equally good V453 Cyg solution without the discrepancy.
desk verdict A solid new fitting framework whose mass-discrepancy conclusion is a possibility demonstrated by a second local minimum, not a measured bias. read the letter →
The pith
A machine-rendered reading of the paper's core claim, the machinery that carries it, and where it could break.
The reading
What carries the argument
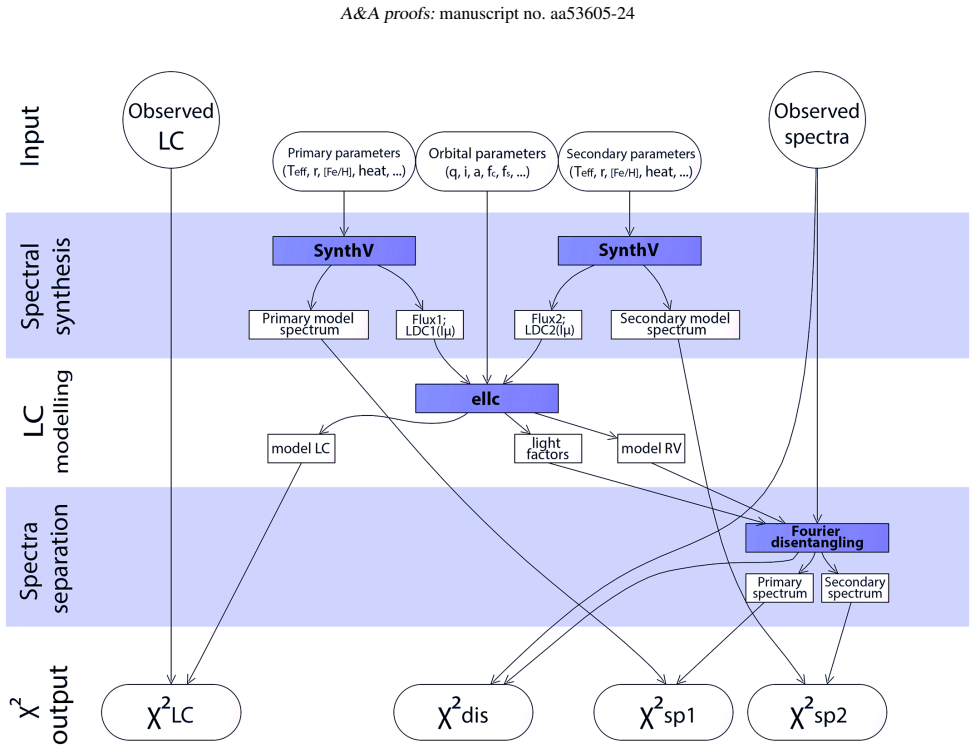
The load-bearing object is the re:pair framework itself: a unified forward model in which LTE spectral synthesis (SynthV) computes each star's spectrum and its specific intensities $I_\mu$; those intensities feed the ellc light-curve model as a passband flux ratio and a limb-darkening prescription; the light curve in turn supplies phase-dependent light factors for Fourier-domain spectral disentangling adapted from fd3; and the four resulting residuals, namely light curve, reconstructed composite spectra, and each component's disentangled spectrum, are minimised simultaneously as four objectives by the NSGA-II genetic algorithm, which maps the whole Pareto front rather than a single point. The identity that carries the argument is that every observable is a function of one shared parameter vector, so a minimum the iterative workflow could never reach can emerge and compete on equal footing. Fit quality is judged by the relative-residual statistic $\chi^2 = \sum_i (F_i-M_i)^2/M_i^2$, which deliberately omits observational noise.
What would settle it
A decisive check would be to re-run the framework on V453 Cyg over a much wider spectral window, for instance 4000–5000 Å including several Balmer and helium lines, and with a goodness-of-fit that propagates the actual noise of the spectra and light curve rather than the residual-only RRSS statistic; if the temperatures of the two minima separate cleanly, or one minimum is rejected at high significance, the degeneracy and with it the methodological-bias conclusion would be resolved one way or the other.
Extended reading notes
Core claim
The central claim is that a single parameter vector, covering the orbit, the two radii, effective temperatures, rotational velocities, and metallicities, can reproduce both the light curve and the phase-resolved composite spectra of a double-lined eclipsing binary, and that forcing this consistency changes what the data appear to say. For V453 Cyg, a B0-type binary whose dynamical and evolutionary masses disagree by roughly 30%, the framework returns two local minima of comparable quality: a hot solution ($T_{\rm eff,1}/T_{\rm eff,2}=28060/26710$ K) that reproduces the published, discrepancy-bearing parameters, and a cool solution ($25990/24500$ K) that keeps the dynamical masses and the observed surface-brightness ratio but places both stars on evolutionary tracks consistent with their masses, removing the discrepancy. The same cool minimum was reported two decades ago by Southworth et al. (2004) and has not been excluded by observations. The paper concludes that methodological biases inherited from the iterative photometry-then-spectroscopy workflow can contribute to the mass discrepancy problem, and that external constraints such as independent distances or evolutionary ages are needed to choose between the degenerate solutions.
Load-bearing premise
The entire conclusion rests on the assumption that the simplified forward model, a single 100-Ångström spectral window containing one hydrogen line, orbit-averaged and non-variable disentangled spectra, and triaxial-ellipsoid light-curve geometry, is accurate enough that both V453 Cyg minima are genuine solutions rather than artefacts of those approximations.
Editorial extensions
If this is right
- For V453 Cyg, a fully data-compatible solution exists in which the dynamical and evolutionary masses agree, so the observed ~30% discrepancy can no longer be read as direct evidence of missing physics in stellar evolution models.
- Applying the framework uniformly to the ~100-system HERMES sample should produce the first consistent observational map of the mass discrepancy across stellar mass and temperature, replacing the scatter of object-per-paper studies.
- External constraints, such as independent distances or consistency of the two components' evolutionary ages, become necessary to choose between the degenerate local minima that the framework exposes.
- The larger uncertainties the framework reports for WW Aur and U Oph relative to the literature quantify systematic freedom that the iterative approach implicitly suppresses rather than avoids.
- The framework is positioned as complementary to, not a replacement for, detailed single-object analyses, targeting intermediate-sized samples where uniform treatment of systematics matters.
Reading between the lines
- If the methodological-bias result generalises beyond V453 Cyg, part of the published scatter in dynamical-versus-evolutionary mass comparisons could trace to differences between analysis recipes of individual research groups; applying one recipe to a large sample would make that directly testable.
- The four-objective architecture could absorb further observables, such as the beta Cep pulsation frequencies detected in TESS data of V453 Cyg's primary, which would act as an independent tie-breaker between the two minima.
- Because the RRSS statistic deliberately ignores observational noise, 'comparable' is defined in residual scale; re-ranking the two minima with a noise-aware likelihood could either harden or dissolve the claimed degeneracy.
Editorial analysis
A structured set of objections, weighed in public.
Referee Report
Summary. The paper introduces re:pair, a new analysis framework that simultaneously models photometric light curves and phase-resolved spectroscopy of eclipsing binaries, combining ellc light-curve synthesis, Fourier spectral disentangling, and LTE spectral synthesis (SynthV) within a multi-objective genetic algorithm (NSGA-II). The framework is validated on five synthetic systems and applied to three well-studied eclipsing binaries (WW Aur, U Oph, V453 Cyg). For the massive binary V453 Cyg, the framework recovers two local minima: one with effective temperatures near 28060/26710 K that preserves the previously reported ~30% mass discrepancy, and another with 25990/24500 K that removes it. The paper concludes that methodological biases in traditional iterative analyses can contribute to the mass discrepancy problem, and that external constraints such as distance or evolutionary tracks may be needed to separate degenerate solutions.
Significance. If the central claim holds, the paper makes two valuable contributions: a reusable, open-source framework for consistent multi-dataset analysis of eclipsing binaries, and a concrete demonstration that even a benchmark system with a well-known mass discrepancy hosts a previously overlooked, data-compatible solution without the discrepancy. The synthetic validation spans diverse parameter regimes, and the WW Aur and U Oph results agree with the literature, lending confidence to the numerical machinery. The paper is explicitly honest about its limitations, including the simplified physical model, the narrow spectral window, and the user-dependent solution selection in multi-objective optimisation. However, the strength of the headline conclusion depends on whether the alternative V453 Cyg minimum is genuinely comparably good under a more realistic spectral model and a statistically meaningful goodness-of-fit measure.
major comments (3)
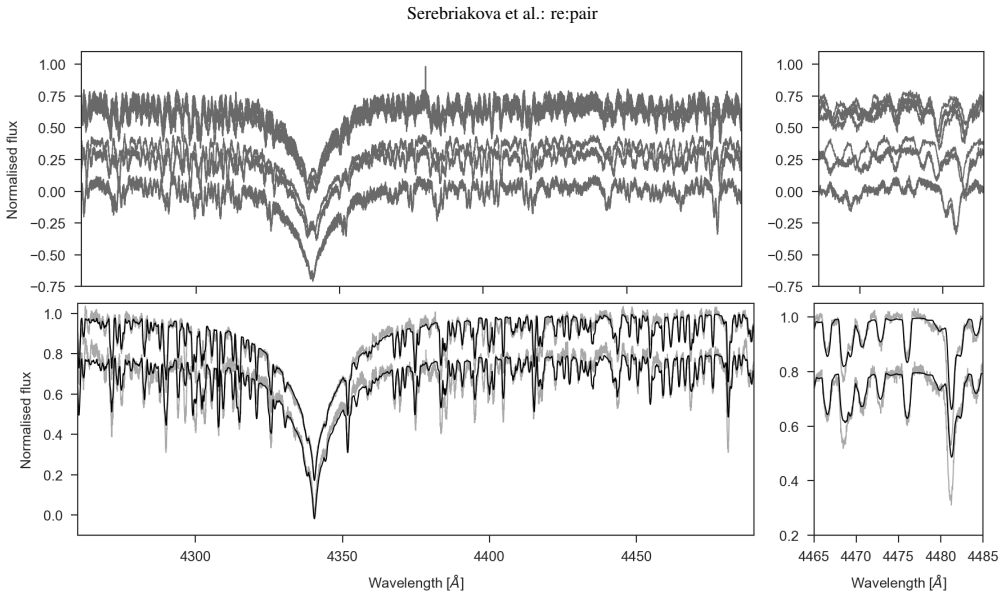
- [Section 4.3, Table 7, Eq. (1), Fig. 16] The central interpretive claim rests on the assertion that the lower-Teff solution for V453 Cyg (Teff1/Teff2 = 25990/24500 K) is comparably good to the higher-Teff solution. The comparison is made with the RRSS statistic of Eq. (1), which deliberately omits observational uncertainties, and with LTE spectral synthesis over a single 100 A window (4250-4500 A) containing only H-gamma and He i 4471 as temperature-sensitive features. For B0 stars, these lines are strongly affected by NLTE, and He ii 4686 (outside the fitted window) is a primary temperature diagnostic. The paper should report the four per-objective RRSS values for both V453 Cyg minima and test whether their relative ranking survives (a) the inclusion of a wider spectral range or a He ii diagnostic, and (b) approximate NLTE corrections. Without such a test, the 'comparably good' status of the no-discrepancy minimum is not secured, and the conclusion that methodological biases, rather than model assumptions, contribute to the mass discrepancy remains a plausible but unsupported interpretation.
- [Section 4.1 and Fig. C.1] The framework leaves the final choice among Pareto-optimal solutions to the user, and for WW Aur the selected solution was explicitly chosen using criteria that include 'a better agreement between the dynamical and evolutionary masses' in addition to spectral quality. The post-processing GUI even colour-codes solutions by mass discrepancy and age difference relative to MIST tracks. This introduces a potential circularity when the paper concludes that methodological biases, rather than evolutionary model assumptions, contribute to the mass discrepancy. The paper should state, for each of the three systems, the exact selection rule used to pick the reported solution, and should demonstrate that the V453 Cyg two-minimum result is not itself an artefact of a selection that favours or disfavours evolutionary consistency.
- [Section 3] The synthetic validation tests in Section 3 generate and fit the mock data with the same simplified forward model (LTE synthesis, ellc triaxial ellipsoids, fixed noise model). This demonstrates that the optimisation pipeline is internally consistent and that the code can recover input parameters, but it does not validate the adequacy of the physical model for real early-type stars. The authors themselves acknowledge in Sections 4.3 and 5 that the physical model 'appeared too simplistic to provide perfect fits'. Because the V453 Cyg degeneracy could arise from the missing physics (notably NLTE and the omission of He ii 4686) rather than from a genuine degeneracy of the full-parameter problem, the paper should either add a targeted robustness test that changes the spectral model for V453 Cyg, or soften the conclusion to state that the data, under the current simplified model, are consistent with a second minimum whose physical reality remains to be established.
minor comments (4)
- [Eq. (1)] The statistic in Eq. (1) is repeatedly called 'chi-squared', but it is not a chi-square statistic because it uses relative residuals without observational uncertainties. Rename it to RRSS (relative residual sum of squares) throughout to avoid misleading statistical connotations.
- [Section 4.3, Table 7, Fig. 15 caption] The effective temperature of the primary in the lower-Teff solution is given as 25590 K in the main text and 25990 K in Table 7 and the Fig. 15 caption; this inconsistency should be corrected.
- [Section 2.2 and Section 5] There are typos 'light cures' (should be 'light curves') in Section 2.2 and 'howevr' (should be 'however') in Section 5.
- [Table 7] The columns 'This work (a)' and 'This work (b)' are not defined in the table itself; add a footnote explaining that (a) and (b) denote the lower- and higher-Teff solutions discussed in Section 4.3.
Circularity Check
No significant circularity: the V453 Cyg dual-minimum result is empirical and not forced by the objective; the paper's own caveats point to model-fidelity risks, not circular steps.
full rationale
I found no load-bearing circular step. The objective function in Eq. (1) and the four chi-squared terms (LC, Dis, Sp1, Sp2) contain only observed data, synthetic spectra, light-curve predictions, and disentangling residuals; neither evolutionary masses nor the mass-discrepancy ratio enter the optimization. The paper explicitly states that MIST tracks are 'plotted here for illustrative purposes only and they were not used in the parameter derivation within our framework' (Sec. 4.1, Fig. 9 caption), so the lower-TeFF V453 Cyg solution is not forced by construction to remove the discrepancy. The alternative V453 Cyg minimum was previously reported by Southworth et al. (2004), providing an external anchor; the authors' self-citations (Tkachenko et al. 2020, 2024) are contextual rather than load-bearing. The paper's own caveats — LTE synthesis over a single 100 A window covering 4250-4500 A, orbit-averaged non-variable spectra, ellc triaxial ellipsoids for detached systems, an RRSS statistic without observational uncertainties, and the admission that 'our underlying physical model appeared too simplistic to provide perfect fits' (Sec. 5) — are model-fidelity and statistical-calibration concerns, not circularity. The only quasi-circular element is the WW Aur solution selection in Sec. 4.1, where the authors discarded solutions on 'the presence of the mass discrepancy' and preferred 'a better agreement between the dynamical and evolutionary masses'; but WW Aur is a test case for the methodology, not the basis of the paper's central claim, and no equation-level reduction forces the V453 Cyg dual-minimum result. The central derivation is therefore self-contained with respect to the mass-discrepancy claim.
Assumptions & free parameters
free parameters (3)
- Stellar and orbital parameters per system (Teff1, Teff2, r1, r2, q, i, a, fc, fs, T0) =
Tabulated in Tables 3, 5, and 7
- Reflection and gravity-darkening coefficients for V453 Cyg =
Not tabulated
- Metallicity [Fe/H] for WW Aur =
0.5
assumptions (6)
- domain assumption LTE spectral synthesis with SynthV on the LLModels grid is adequate for the B/A/F components in the covered parameter range.
- domain assumption The orbit-averaged disentangled spectrum of each component is representable by a synthetic spectrum of a normal, non-variable single star.
- domain assumption ellc's triaxial-ellipsoid approximation is accurate for these detached systems.
- ad hoc to paper The RRSS statistic without per-point uncertainties (Eq. 1) is a fair way to compare four heterogeneous objective functions.
- ad hoc to paper User selection among Pareto-optimal solutions based on criteria such as agreement of dynamical and evolutionary masses is a legitimate part of the parameter derivation.
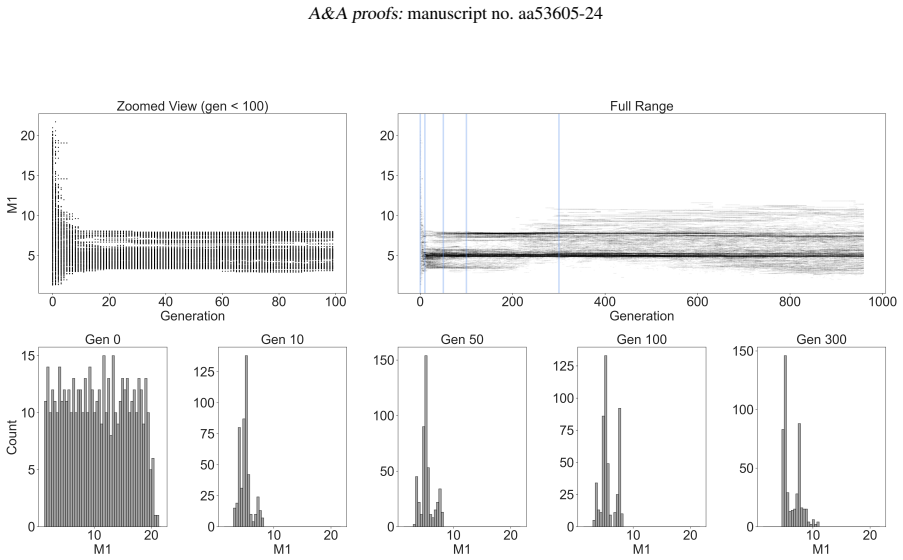
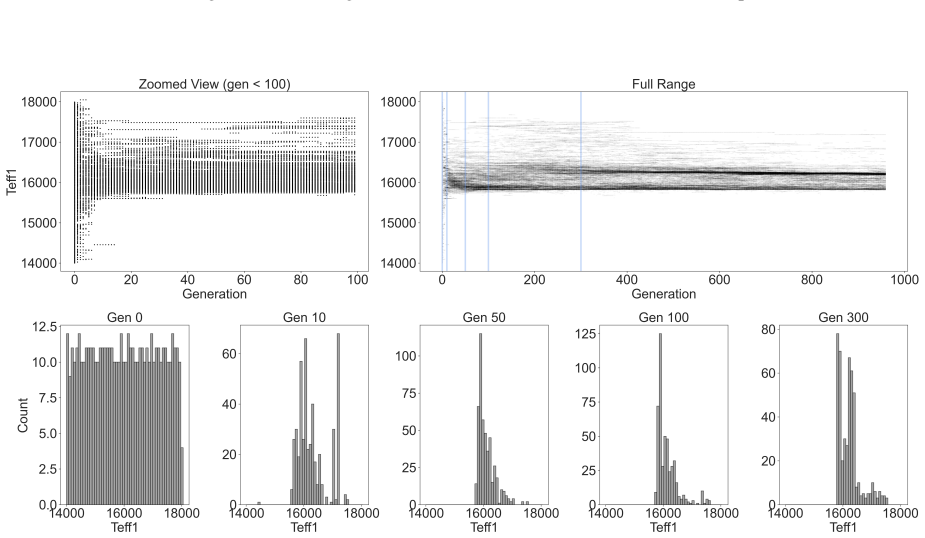
- ad hoc to paper Uncertainties can be approximated by the spread of the last GA generations (confidence ellipses).
Cite this review
Pith. "Pith review of Observational mapping of the mass discrepancy in eclipsing binaries. A new self-contained framework for concurrent analysis of photometric and spectroscopic time series." pith.science (2026). https://pith.science/paper/BDQO2I3L
@misc{pith2026250710096,
  author       = {Pith},
  title        = {Pith review of: Observational mapping of the mass discrepancy in eclipsing binaries. A new self-contained framework for concurrent analysis of photometric and spectroscopic time series},
  year         = {2026},
  howpublished = {\url{https://pith.science/paper/BDQO2I3L}},
  note         = {Machine review of arXiv:2507.10096}
}
read the original abstract
The mass discrepancy problem, observed in high-mass stars within eclipsing binaries, highlights systematic differences between dynamical and evolutionary mass estimates, challenging the accuracy of stellar evolution models. We aim to determine whether analysis methods directly contribute to this discrepancy and to assess how methodological improvements might reduce or clarify it. To address this, we developed a new self-contained framework that simultaneously models the photometric and spectroscopic data, minimising biases introduced by traditional iterative approaches and enabling consistent parameter optimisation. We present this framework alongside validation tests on synthetic data and demonstrate its application to three well-studied observed binaries, including one system known for its pronounced mass discrepancy. The framework recovers multiple viable solutions from distinct local minima, including one that reduces the mass discrepancy. These results illustrate how methodological biases, rather than evolutionary model assumptions, can contribute to the mass discrepancy problem. We further highlight that external constraints, such as independent distance estimates or evolutionary models, may be necessary to distinguish between degenerate solutions. Expanding this analysis to a larger sample will provide a more complete understanding, with forthcoming results in the next paper in this series.
Figures


Figures from the paper (12 more)






Reference graph
Works this paper leans on
- [1]
-
[2]
Catanzaro, G., Frasca, A., Alonso-Santiago, J., & Colombo, C. 2024, A&A, 685, A133
work page 2024
- [3]
- [4]
- [5]
-
[6]
& Torres, G
Claret, A. & Torres, G. 2019, ApJ, 876, 134
2019
-
[7]
2002, Evolutionary Computa- tion, IEEE Transactions on, 6, 182
Deb, K., Pratap, A., Agarwal, S., & Meyarivan, T. 2002, Evolutionary Computa- tion, IEEE Transactions on, 6, 182
work page 2002
-
[8]
2012, Journal of Machine Learning Research, Machine Learning Open Source Soft- ware, 13, 2171
Fortin, F.-A., De Rainville, F.-M., Gardner, M., Parizeau, M., & Gagné, C. 2012, Journal of Machine Learning Research, Machine Learning Open Source Soft- ware, 13, 2171
work page 2012
Show all 37 references
-
[9]
F., Ribas, I., Fitzpatrick, E
Guinan, E. F., Ribas, I., Fitzpatrick, E. L., et al. 2000, ApJ, 544, 409
2000
-
[10]
1995, A&AS, 114, 393
Hadrava, P. 1995, A&AS, 114, 393
1995
-
[11]
2007, Highlights of Astronomy, 14, 201
Herrero, A. 2007, Highlights of Astronomy, 14, 201
2007
-
[12]
Herrero, A., Puls, J., & Villamariz, M. R. 2000, A&A, 354, 193
2000
-
[13]
E., Hill, G., & Fisher, W
Holmgren, D. E., Hill, G., & Fisher, W. 1991, A&A, 248, 129
1991
-
[14]
Ilijic, S., Hensberge, H., Pavlovski, K., & Freyhammer, L. M. 2004, ASP Con- ference Series, 318, 111 Iliji´c, S. 2017, Astrophysics Source Code Library, ascl:1705.012
2004
-
[15]
2019, A&A, 628, A25
Johnston, C., Pavlovski, K., & Tkachenko, A. 2019, A&A, 628, A25
2019
-
[16]
2005, A&A, 433, 671
Kochukhov, O., Khan, S., & Shulyak, D. 2005, A&A, 433, 671
2005
-
[17]
Kurucz, R. L. 1979, ApJS, 40, 1 Lightkurve Collaboration, Cardoso, J. V . d. M., Hedges, C., et al. 2018, Lightkurve: Kepler and TESS time series analysis in Python, Astrophysics Source Code Library, record ascl:1812.013
1979
-
[18]
2018, A&A, 613, A12
Markova, N., Puls, J., & Langer, N. 2018, A&A, 613, A12
2018
-
[19]
Maxted, P. F. L. 2016, A&A, 591, A111
2016
-
[20]
2018, MNRAS, 481, 3129
Pavlovski, K., Southworth, J., & Tamajo, E. 2018, MNRAS, 481, 3129
2018
-
[21]
2009, MNRAS, 400, 791 Prša, A., Conroy, K
Pavlovski, K., Tamajo, E., Koubský, P., et al. 2009, MNRAS, 400, 791 Prša, A., Conroy, K. E., Horvat, M., et al. 2016, ApJS, 227, 29 Prša, A. & Zwitter, T. 2005, ApJ, 628, 426
2009
-
[22]
2011, A&A, 526, A69
Raskin, G., van Winckel, H., Hensberge, H., et al. 2011, A&A, 526, A69
2011
-
[23]
Simon, K. P. & Sturm, E. 1994, A&A, 281, 286
1994
-
[24]
M., Tkachenko, A., & Pavlovski, K
Southworth, J., Bowman, D. M., Tkachenko, A., & Pavlovski, K. 2020, MNRAS, 497, L19
2020
-
[25]
Southworth, J., Maxted, P. F. L., & Smalley, B. 2004, MNRAS, 351, 1277
2004
-
[26]
Southworth, J., Smalley, B., Maxted, P. F. L., Claret, A., & Etzel, P. B. 2005, MNRAS, 363, 529
2005
-
[27]
& Deb, K
Srinivas, N. & Deb, K. 1994, Evolutionary Computation, 2, 221
1994
-
[28]
2019, MNRAS, 485, 1067
Takeda, Y ., Han, I., Kang, D.-I., Lee, B.-C., & Kim, K.-M. 2019, MNRAS, 485, 1067
2019
-
[29]
2015, A&A, 581, A129
Tkachenko, A. 2015, A&A, 581, A129
2015
-
[30]
2014, MNRAS, 438, 3093
Tkachenko, A., Degroote, P., Aerts, C., et al. 2014, MNRAS, 438, 3093
2014
-
[31]
2020, A&A, 637, A60
Tkachenko, A., Pavlovski, K., Johnston, C., et al. 2020, A&A, 637, A60
2020
-
[32]
2024, A&A, 683, A252
Tkachenko, A., Pavlovski, K., Serebriakova, N., et al. 2024, A&A, 683, A252
2024
-
[33]
2010, A&A Rev., 18, 67
Torres, G., Andersen, J., & Giménez, A. 2010, A&A Rev., 18, 67
2010
-
[34]
1996, ASP Conference Series, 108, 198
Tsymbal, V . 1996, ASP Conference Series, 108, 198
1996
-
[35]
Vaz, L. P. R., Andersen, J., & Claret, A. 2007, A&A, 469, 285
2007
-
[36]
Wilson, R. E. & Devinney, E. J. 1971, ApJ, 166, 605
1971
-
[37]
Wilson, R. E. & Van Hamme, W. 2009, ApJ, 699, 118 Article number, page 19 of 22 A&A proofs: manuscript no. aa53605-24 Appendix A: Uncertainties from confidence ellipses Fig. A.1: Confidence ellipses on top of density levels for the last generations of a test dataset. Each subp...
2009
Reviewed August 6, 2026 · model on record in the stance chip above.
Discussion (0). Continue with ORCID to comment.