REVIEW 3 major objections 4 minor 133 references
IllustrisTNG Insights: Factors Affecting the Presence of Bars in Disk Galaxies
T0 review · 3 major / 4 minor · reviewed 2026-08-11 · deepseek-v4-flash
Pith's one-line read Mergers suppress or destroy bars in massive disk galaxies, while extended, dynamically hot disks prevent bars in lighter ones.
desk verdict A careful statistical study of TNG bars with a plausible mass-dependent nature/nurture story, but the low-mass Toomre-Q claim is more correlational than the text admits. read the letter →
The pith
A machine-rendered reading of the paper's core claim, the machinery that carries it, and where it could break.
The reading
What carries the argument
The argument is carried by a diagnostic toolkit rather than a single identity. Bars are identified by isophotal ellipse fitting (ellipticity $\epsilon$ peak, position-angle constancy, outer drop, with bar size $R_{85}$) and cross-checked by Fourier $A_2$ profiles; galaxies are followed through time with subhalo merger trees; and the difference between barred and unbarred populations is assessed by Kolmogorov-Smirnov tests on parameters that include ex-situ stellar fraction, kinematically derived stellar-halo fraction, effective radius, and rotation. The physical probe of disk responsiveness is the two-component Toomre parameter $Q_{\rm 2comp}$ from the Romeo-Wiegert approximation, which combines stellar and gaseous velocity dispersions and surface densities; the paper uses its radial profile at $z=1$, $z=0.5$, $z=0.2$, and $z=0$ to show that unbarred low-mass disks are dynamically hotter than their barred counterparts.
What would settle it
Use a higher-resolution simulation (or a successor TNG run with smaller softening, plus an inner-cutoff-free bar finder) and measure bar fraction and strength at $z=1$ for the same $z=0$-selected barred and unbarred populations; if the progenitors already differ in bar properties at $z=1$, the similar-at-$z=1$ claim fails. Separately, if a substantial population of massive unbarred galaxies with merger histories as quiet as those of barred galaxies turns up in independent simulations or in observed close-pair and tidal-debris counts, the claim that mergers dominate bar destruction above $\log(M_*/M_\odot)>10.8$ would be falsified.
Extended reading notes
Core claim
Using ellipse fitting and Fourier $A_2$ measurements on TNG100 and TNG50 disk galaxies, the paper finds that bar presence evolves after $z\sim1$ and is governed by different physics on either side of $\log(M_*/M_\odot)\approx10.8$. In massive systems, unbarred galaxies have experienced far more major mergers since $z\sim1$ and carry larger stellar halos and ex-situ mass fractions; about 60% of the local unbarred population once hosted a bar that was destroyed. In lower-mass systems, mergers are minor, and unbarred galaxies are instead the extended, less compact disks with higher two-component Toomre-Q values, where bar instability is suppressed even when rotation is high; barred galaxies follow a denser, earlier-assembling compact pathway. Short bars form at about the same epoch as normal bars but either contract or barely grow, and the simulations overproduce them, indicating that the central regions of TNG galaxies are insufficiently affected by mergers and gas inflows.
Load-bearing premise
The central assumption is that bar detection at $z=1$ and in TNG50, including the ad hoc 1.4 kpc inner cutoff motivated by an unexplained central ellipticity enhancement, does not systematically misclassify bars, and that the merger trees correctly recover the $z=0$ galaxies' progenitors.
Editorial extensions
If this is right
- At the massive end, the $z=0$ bar fraction becomes a probe of recent merger history: disks with quiet merger histories stay barred, so a deficit of bars implies a violent assembly.
- Since all $z=0$ disk populations look alike at $z=1$, the early formation stage does not preordain bar presence in this mass range; the discriminating physics happens between $z=1$ and $z=0$.
- Low-mass unbarred galaxies need not have lost a bar; many are simply disks too extended and dynamically hot to go unstable, so environment and halo spin, not just mergers, set the unbarred population.
- Short bars are a distinct population closer to unbarred galaxies in properties; measurements of the bar fraction in simulations should either exclude them or classify them separately to match observed S4G fractions.
- The overproduction of short bars and the TNG50/TNG100 differences in central density point to resolution and subgrid effects in galaxy centers as limiting the fidelity of simulated bar sizes.
Reading between the lines
- If bar survival in TNG tracks merger rate, the measured high-mass bar fraction could be turned around as an observational constraint on merger rates, by comparing TNG's bar fractions against merger-rate measurements from close pairs or tidal features.
- The claim that about 60% of unbarred galaxies once hosted a bar implies that unbarred samples at $z=0$ are a mix of destroyed-bar and never-barred objects; future observational work could try to split them using kinematic or metallicity relics of a past bar.
- The resolution-dependent difference in short-bar abundance suggests a testable numerical prediction: a higher-resolution rerun of TNG50 or zoom-in simulations with smaller softening should produce longer bars and a bar fraction closer to S4G.
- The correlation between compactness and bar presence links bar formation to angular-momentum-driven mass-size relations, suggesting bar fraction could be predicted from halo spin and assembly time rather than from local disk conditions alone.
Editorial analysis
A structured set of objections, weighed in public.
Referee Report
Summary. This paper uses ellipse fitting and Fourier decomposition on TNG100 and TNG50 disk galaxies to compare barred, short-bar, and unbarred galaxies at z=0, tracing their evolution back to z=1. The central claims are that all z=0 disk galaxy progenitors show similar bar fractions and strengths at z=1; that for log(M*/M_sun)>10.8, mergers suppress or destroy bars; and that for log(M*/M_sun)<10.8, a larger two-component Toomre-Q parameter associated with a less compact nature prevents bar formation. The analysis also addresses the properties and evolution of short bars, which are found to resemble unbarred galaxies more than barred ones. The methodology combines KS tests of galaxy parameters, evolutionary tracks of individual galaxies, and comparisons between TNG100 and TNG50.
Significance. If correct, the paper offers a mass-dependent physical explanation for which disk galaxies end up barred, with mergers dominating in massive systems and internal disk responsiveness dominating in lower-mass systems. The authors are careful in several respects: they cross-check ellipse-fitting and Fourier bar measurements, they make the bar evolution catalog publicly available, they validate TNG100 results with TNG50, and they openly flag the TNG50 central ellipticity problem and the discrepancy with observed galaxy sizes. I do not see a definitional circularity: the bar properties and the galaxy parameters are measured independently. The main risks are the causal interpretation of the Toomre-Q comparison at z=1, when a large fraction of the final barred galaxies already have bars, and the reliance on an ad hoc TNG50 bar-size correction for the low-mass branch of the argument.
major comments (3)
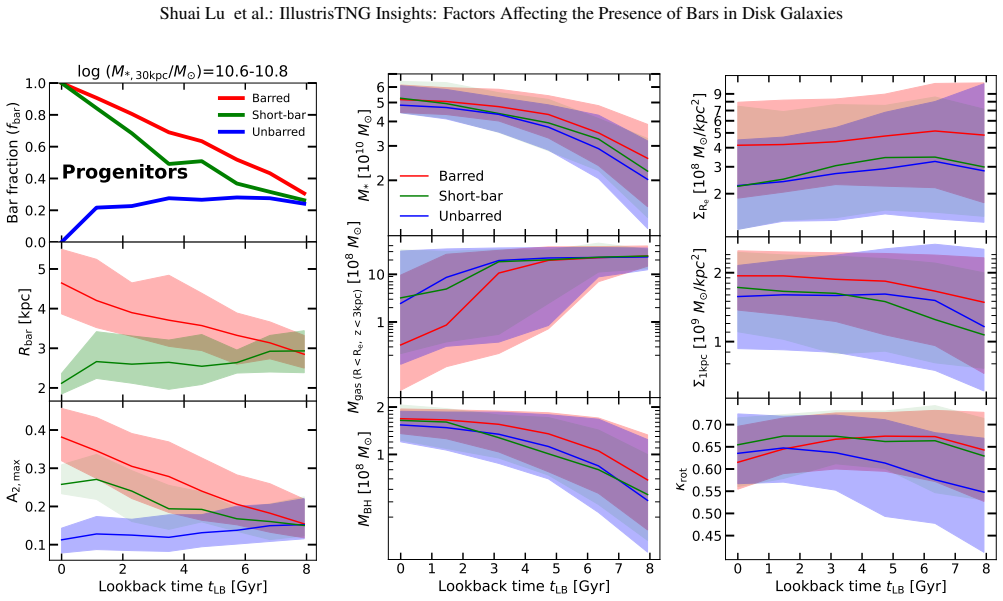
- [§6, Eq. (3), Fig. 11] The claim that a larger Toomre-Q at z=1 'generates' unbarred low-mass galaxies is not established by the present analysis. At z=1 the bar fraction is already about 0.5 for all final samples (Figs. 8 and 10), so the Q2comp profiles in Fig. 11 are measured after a sizable fraction of the final barred galaxies have already formed bars. Bars modify the stellar velocity dispersion and surface density, so Q2comp at z=1 is not a pristine initial condition; the lower Q2comp of the final barred sample may be a selection effect or a consequence of early bar formation rather than a pre-existing lack of responsiveness. The paper should measure Q2comp before bar formation, for example at z=2 or for galaxies that have no bar at z=1, or should explicitly show that the offset survives when all galaxies with bars at z=1 are removed. This is load-bearing for the low-mass branch of the central claim.
- [§2.2.2, Figs. 1-2] The TNG50 bar measurements rely on an ad hoc 1.4 kpc inner cutoff for long bars, while short bars are measured using all radii, and the underlying central ellipticity enhancement in TNG50 is left unexplained. Because TNG50 is the only simulation used for the log(M*/M_sun)<10.6 mass range and for the left-hand panels of Fig. 11, a systematic misclassification of short bars or spurious detections caused by central ellipticity could bias the low-mass conclusions. The authors should quantify the sensitivity of their bar fractions and size measurements in TNG50 to this cutoff, for example by using Fourier-based bar sizes as an alternative, and should investigate the physical origin of the central ellipticity enhancement rather than treating it only as a fitting artifact.
- [§4.2, §5.2, Figs. 8 and 10] The premise that all z=0 disk galaxy progenitors have 'similar bar features' at z=1 (abstract and Section 8, item 1) is asserted from overlapping medians without statistical quantification. No KS test, bootstrap confidence interval, or other uncertainty estimate is given for fbar, A2max, or Rbar at tLB=8 Gyr, and the sample is defined by z=0 populations traced through merger trees, whose completeness is not reported. Since the subsequent nature/nurture interpretation assumes equal initial bar conditions, the authors should provide a quantitative comparison of the z=1 bar properties and report the progenitor identification completeness. This is needed to make the 'similar at z=1' claim falsifiable.
minor comments (4)
- [§7.2] There is a typo in 'Other subgrid physical processes may alse influence the size of bars'; 'alse' should be 'also'.
- [Acknowledgements] 'Enterpreneurship' should be 'Entrepreneurship' in the acknowledgement of the XMU Training Program.
- [§8] The sentence 'Additionally, we also study the evolution of both the Toomre-Q' is incomplete; it should read 'both the stellar and gaseous Toomre-Q parameters' or similar.
- [Fig. 4 caption and §3.2] The text in §3.2 refers to p-values while the caption says the bracketed number gives the log p-value; please clarify consistently so readers do not misinterpret the reported significance levels.
Circularity Check
No constructional circularity: bar classification, merger indicators, and Toomre-Q are measured independently, and the central claims rest on empirical comparisons rather than on self-referential definitions or fits.
full rationale
Walking the derivation chain, the paper's central results do not reduce to their inputs by definition. The z=0 samples are defined by bar presence, so the endpoints of the bar-fraction tracks in Figs. 8 and 10 are fixed by construction, but the substantive result is the common bar fraction (~0.5) at z=1, which is measured, not imposed. The mass-dependent conclusion (mergers suppress bars above log M*/M_sun = 10.8; higher Toomre-Q stabilizes lower-mass disks) is built from independent measurements: fhalo and fex situ are kinematic/ex-situ mass fractions, major-merger histories come from SUBLINK trees, and Q2comp is computed with the Romeo-Wiegert (2011) formula from stellar/gas surface densities and velocity dispersions. None of these quantities is fitted to the bar/unbarred labels. The K-S tests and evolutionary tracks are descriptive comparisons. There are numerous self-citations to prior work by the same group (Zhao et al. 2020; Du et al. 2019, 2020, 2021, 2022, 2024; Ma et al. 2024), and these supply the disk catalog, kinematic decomposition, and the 'compact evolutionary pathway' interpretive framework; however, the bar-vs-unbarred comparisons and Q profiles are computed here from TNG data and are externally checkable, so the self-citations are supporting rather than load-bearing reductions. The strongest inferential caveat is Section 6: Q2comp is evaluated at z=1 after a substantial fraction of galaxies already host bars, so the causal direction 'high Q generates unbarred galaxies' is not proven by this snapshot; bar heating could in principle alter Q. But that is a physical endogeneity/identification concern, not a definitional equivalence, and the direction of the reported offset (barred galaxies have lower Q) is opposite to a simple bar-heating artifact. The manuscript itself flags unresolved issues (TNG50 central ellipticity enhancement, overproduction of short bars, simulation-observation size discrepancy), none of which constitutes circular reasoning. I therefore find no constructional circularity.
Assumptions & free parameters
free parameters (4)
- Mass boundary for nature/nurture split =
log(M*/M_sun)=10.8
- TNG50 inner fitting cutoff =
1.4 kpc
- Bar detection thresholds =
epsilon_max > 0.25, A2_max > 0.2, PA variation < 10 deg
- Bar duration thresholds for 'had a bar' =
8 snapshots (main), 4-12 for limits
assumptions (6)
- domain assumption IllustrisTNG subgrid physics (feedback, gas cooling, star formation) is realistic enough to reproduce the internal dynamics relevant to bar formation and destruction.
- domain assumption The SUBFIND/SUBLINK merger trees correctly identify progenitor-descendant links and major mergers.
- domain assumption The kinematic decomposition from Du et al. (2019, 2020) correctly separates stellar halo, bulge, and disk components, so fhalo is a valid proxy for merger influence.
- domain assumption The galaxy selection criterion kappa_rot >= 0.5 within 30 kpc selects a disk population that is comparable to observed disk galaxies.
- standard math The two-component Toomre-Q formula of Romeo & Wiegert (2011) is a valid stability indicator for the simulated disks.
- ad hoc to paper The mass split at log(M*/M_sun)=10.8 is a legitimate, physically meaningful boundary rather than an artifact of the sample.
Cite this review
Pith. "Pith review of IllustrisTNG Insights: Factors Affecting the Presence of Bars in Disk Galaxies." pith.science (2026). https://pith.science/paper/BF3GOGC5
@misc{pith2026241202255,
  author       = {Pith},
  title        = {Pith review of: IllustrisTNG Insights: Factors Affecting the Presence of Bars in Disk Galaxies},
  year         = {2026},
  howpublished = {\url{https://pith.science/paper/BF3GOGC5}},
  note         = {Machine review of arXiv:2412.02255}
}
abstract
Bars are important in the secular evolution of galaxies. This study is aimed at exploring the reasons why some galaxies have bars at redshift $z=0$ while others do not. We use ellipse fitting to measure the properties and evolution of bars in the IllustrisTNG cosmological simulation. By using the K-S two-sample test and tracing their evolutionary changes, we analyze the parameter differences between barred and unbarred galaxies. The properties of galaxies with short bars are also studied. When tracing all disk galaxies at $z=0$ back to $z=1$, all of them show similar bar features at $z=1$. The fraction of bars increases in barred and short-bar galaxies but decreases in unbarred galaxies during $z=1-0$. In the case of disk galaxies with stellar mass log$(M_*/M_\odot)> 10.8$, nurture (mainly mergers) plays the most important role in suppressing or destroying bars. Bars are more likely to endure in galaxies that experience fewer mergers, which can be quantified by smaller stellar halos and ex-situ mass fractions. Approximately 60\% of the unbarred galaxies in the local Universe once had a bar. In contrast, the lack of responsiveness to bar instabilities (a larger Toomre-Q parameter) due to a less compact nature plays an important role in generating unbarred disk galaxies with stellar mass log$(M_*/M_\odot)<10.8$. Moreover, short bars generally form at a similar time to normal bars, during which they either grow mildly or contract significantly. The fact that IllustrisTNG simulations produce too many galaxies with short bars indicates that the dynamical properties of the central regions in IllustrisTNG galaxies are less affected by external factors, such as mergers and gas inflows.
Figures


Figures from the paper (10 more)




Reference graph
Works this paper leans on
-
[1]
G., Navarro, J
Abadi, M. G., Navarro, J. F., Steinmetz, M., & Eke, V . R. 2003, ApJ, 597, 21
2003
-
[2]
G., Navarro, J
Algorry, D. G., Navarro, J. F., Abadi, M. G., et al. 2017, MNRAS, 469, 1054
2017
-
[3]
R., Gough-Kelly, S., Debattista, V
Anderson, S. R., Gough-Kelly, S., Debattista, V . P., et al. 2024, MNRAS, 527, 2919
2024
-
[4]
1992, MNRAS, 259, 345
Athanassoula, E. 1992, MNRAS, 259, 345
1992
-
[5]
2002, ApJ, 569, L83
Athanassoula, E. 2002, ApJ, 569, L83
2002
-
[6]
2003, MNRAS, 341, 1179
Athanassoula, E. 2003, MNRAS, 341, 1179
2003
-
[7]
2005, Annals of the New York Academy of Sciences, 1045, 168
Athanassoula, E. 2005, Annals of the New York Academy of Sciences, 1045, 168
2005
-
[8]
2016, 418, 391
Athanassoula, E. 2016, 418, 391
2016
Show all 133 references
-
[9]
C., & Dehnen, W
Athanassoula, E., Lambert, J. C., & Dehnen, W. 2005, MNRAS, 363, 496
2005
-
[10]
Athanassoula, E., Machado, R. E. G., & Rodionov, S. A. 2013, MNRAS, 429, 1949
2013
-
[11]
& Misiriotis, A
Athanassoula, E. & Misiriotis, A. 2002, MNRAS, 330, 35
2002
-
[12]
& Sellwood, J
Athanassoula, E. & Sellwood, J. A. 1986, MNRAS, 221, 213
1986
-
[13]
Bauer, J. S. & Widrow, L. M. 2019, MNRAS, 486, 523
2019
-
[14]
H., & Fricke, K
Berentzen, I., Athanassoula, E., Heller, C. H., & Fricke, K. J. 2004, MNRAS, 347, 220
2004
-
[15]
Berentzen, I., Shlosman, I., Martinez-Valpuesta, I., & Heller, C. H. 2007, ApJ, 666, 189
2007
-
[16]
Berrier, J. C. & Sellwood, J. A. 2016, ApJ, 831, 65
2016
-
[17]
1996, in Barred Galaxies and Circumnuclear Activity, ed
Bosma, A. 1996, in Barred Galaxies and Circumnuclear Activity, ed. A. Sandqvist & P. O. Lindblad (Berlin, Heidelberg: Springer), 67–74
1996
-
[18]
& Combes, F
Bournaud, F. & Combes, F. 2002, A&A, 392, 83
2002
-
[19]
2005, MNRAS: Letters, 364, L18
Bournaud, F., Combes, F., & Semelin, B. 2005, MNRAS: Letters, 364, L18
2005
-
[20]
2023, astropy/photutils: 1.8.0
Bradley, L., Sip˝ocz, B., Robitaille, T., et al. 2023, astropy/photutils: 1.8.0
2023
-
[21]
L., et al
Cheung, E., Athanassoula, E., Masters, K. L., et al. 2013, ApJ, 779, 162
2013
-
[22]
2008, Pattern Speed Evolution and Bar Reformation Article number, page 16 of 19 Shuai Lu et al.: IllustrisTNG Insights: Factors A ffecting the Presence of Bars in Disk Galaxies
Combes, F. 2008, Pattern Speed Evolution and Bar Reformation Article number, page 16 of 19 Shuai Lu et al.: IllustrisTNG Insights: Factors A ffecting the Presence of Bars in Disk Galaxies
2008
-
[23]
Conselice, C. J. 2014, ARA&A, 52, 291
2014
-
[24]
R., Bershady, M
Courteau, S., Andersen, D. R., Bershady, M. A., MacArthur, L. A., & Rix, H.-W. 2003, ApJ, 594, 208
2003
-
[25]
Cuomo, V ., Aguerri, J. a. L., Corsini, E. M., & Debattista, V . P. 2020, A&A, 641, A111
2020
-
[26]
S., & White, S
Davis, M., Efstathiou, G., Frenk, C. S., & White, S. D. M. 1985, ApJ, 292, 371 de Lorenzo-Cáceres, A., Sánchez-Blázquez, P., Méndez-Abreu, J., et al. 2019, MNRAS, 484, 5296
1985
-
[27]
P., Carollo, C
Debattista, V . P., Carollo, C. M., Mayer, L., & Moore, B. 2004, ApJ, 604, L93
2004
-
[28]
Debattista, V . P. & Sellwood, J. A. 1998, ApJ, 493, L5
1998
-
[29]
Debattista, V . P. & Sellwood, J. A. 2000, ApJ, 543, 704
2000
-
[30]
2023, MNRAS, 525, 1520 Díaz-García, S., Salo, H., Laurikainen, E., & Herrera-Endoqui, M
Deng, Q., Zu, Y ., Alam, S., & Yoon, Y . 2023, MNRAS, 525, 1520 Díaz-García, S., Salo, H., Laurikainen, E., & Herrera-Endoqui, M. 2016, A&A, 587, A160
2023
-
[31]
Diemer, B., Stevens, A. R. H., Forbes, J. C., et al. 2018, ApJS, 238, 33
2018
-
[32]
Diemer, B., Stevens, A. R. H., Lagos, C. d. P., et al. 2019, MNRAS, 487, 1529
2019
-
[33]
2009, MNRAS, 399, 497 Doménech-Moral, M., Martínez-Serrano, F
Dolag, K., Borgani, S., Murante, G., & Springel, V . 2009, MNRAS, 399, 497 Doménech-Moral, M., Martínez-Serrano, F. J., Domínguez-Tenreiro, R., &
2009
-
[34]
2012, MNRAS, 421, 2510
Serna, A. 2012, MNRAS, 421, 2510
2012
-
[35]
E., Martig, M., James, P
Donohoe-Keyes, C. E., Martig, M., James, P. A., & Kraljic, K. 2019, MNRAS, 489, 4992
2019
-
[36]
P., Shen, J., Ho, L
Du, M., Debattista, V . P., Shen, J., Ho, L. C., & Erwin, P. 2017, ApJL, 844, L15
2017
-
[37]
C., Debattista, V
Du, M., Ho, L. C., Debattista, V . P., et al. 2021, ApJ, 919, 135
2021
-
[38]
C., Debattista, V
Du, M., Ho, L. C., Debattista, V . P., et al. 2020, ApJ, 895, 139
2020
-
[39]
C., Yu, H.-R., & Debattista, V
Du, M., Ho, L. C., Yu, H.-R., & Debattista, V . P. 2022, ApJL, 937, L18
2022
-
[40]
C., Zhao, D., et al
Du, M., Ho, L. C., Zhao, D., et al. 2019, ApJ, 884, 129
2019
-
[41]
2024, A&A, 686, A168
Du, M., Ma, H.-C., Zhong, W.-Y ., et al. 2024, A&A, 686, A168
2024
-
[42]
Du, M., Shen, J., & Debattista, V . P. 2015, ApJ, 804, 139
2015
-
[43]
2021, A&A, 651, A109
Dubois, Y ., Beckmann, R., Bournaud, F., et al. 2021, A&A, 651, A109
2021
-
[44]
1965, Trudy Astrofizicheskogo Instituta Alma-Ata, 5, 87
Einasto, J. 1965, Trudy Astrofizicheskogo Instituta Alma-Ata, 5, 87
1965
-
[45]
2005, MNRAS, 364, 283
Erwin, P. 2005, MNRAS, 364, 283
2005
-
[46]
2018, MNRAS, 474, 5372
Erwin, P. 2018, MNRAS, 474, 5372
2018
-
[47]
2019, MNRAS, 489, 3553
Erwin, P. 2019, MNRAS, 489, 3553
2019
-
[48]
& Debattista, V
Erwin, P. & Debattista, V . P. 2016, ApJL, 825, L30
2016
-
[49]
B., Frogel, J
Eskridge, P. B., Frogel, J. A., Pogge, R. W., et al. 2000, AJ, 119, 536
2000
-
[50]
Fall, S. M. & Efstathiou, G. 1980, MNRAS, 193, 189
1980
-
[51]
J., Faber, S
Fang, J. J., Faber, S. M., Koo, D. C., & Dekel, A. 2013, ApJ, 776, 63
2013
-
[52]
2024, http://arxiv.org/abs/ 2406.09453
Fragkoudi, F., Grand, R., Pakmor, R., et al. 2024, http://arxiv.org/abs/ 2406.09453
2024 arXiv
-
[53]
2022, ApJ, 940, 61
Frankel, N., Pillepich, A., Rix, H.-W., et al. 2022, ApJ, 940, 61
2022
-
[54]
2015, A&A, 580, A116
Gavazzi, G., Consolandi, G., Dotti, M., et al. 2015, A&A, 580, A116
2015
-
[55]
2018, MNRAS, 474, 3976
Genel, S., Nelson, D., Pillepich, A., et al. 2018, MNRAS, 474, 3976
2018
-
[56]
2014, MNRAS, 445, 175
Genel, S., V ogelsberger, M., Springel, V ., et al. 2014, MNRAS, 445, 175
2014
-
[57]
George, K., Subramanian, S., & Paul, K. T. 2019, A&A, 628, A24
2019
-
[58]
1990, A&A, 230, 37
Gerin, M., Combes, F., & Athanassoula, E. 1990, A&A, 230, 37
1990
-
[59]
2021, MNRAS, 502, 3085 Gonçalves, G
Ghosh, S., Saha, K., Di Matteo, P., & Combes, F. 2021, MNRAS, 502, 3085 Gonçalves, G. F. & Machado, R. E. G. 2024, RNAAS, 8, 217
2021
-
[60]
C., Debattista, V
Guo, M., Du, M., Ho, L. C., Debattista, V . P., & Zhao, D. 2020, ApJ, 888, 65
2020
-
[61]
Hopkins, P. F. & Quataert, E. 2010, MNRAS, 407, 1529
2010
-
[62]
L., Nichol, R
Hoyle, B., Masters, Karen. L., Nichol, R. C., et al. 2011, MNRAS, 415, 3627
2011
-
[63]
2019, MNRAS, 489, 1859
Huertas-Company, M., Rodriguez-Gomez, V ., Nelson, D., et al. 2019, MNRAS, 489, 1859
2019
-
[64]
Jedrzejewski, R. I. 1987, MNRAS, 226, 747
1987
-
[65]
D., Lehnert, M
Khoperskov, S., Haywood, M., Matteo, P. D., Lehnert, M. D., & Combes, F. 2018, A&A, 609, A60
2018
-
[66]
S., Chung, H., et al
Kim, E., Hwang, H. S., Chung, H., et al. 2017, ApJ, 845, 93
2017
-
[67]
2013, Secular Evolution in Disk Galaxies, 1
Kormendy, J. 2013, Secular Evolution in Disk Galaxies, 1
2013
-
[68]
& Kennicutt, R
Kormendy, J. & Kennicutt, R. C. 2004, ARA&A, 42, 603
2004
-
[69]
H., Ann, H
Lee, Y . H., Ann, H. B., & Park, M.-G. 2019, ApJ, 872, 97
2019
-
[70]
P., et al
Li, Z., Du, M., Debattista, V . P., et al. 2023, ApJ, 958, 77
2023
-
[71]
2015, ApJ, 806, 150
Li, Z., Shen, J., & Kim, W.-T. 2015, ApJ, 806, 150
2015
-
[72]
C., & Barth, A
Li, Z.-Y ., Ho, L. C., & Barth, A. J. 2017, ApJ, 845, 87
2017
-
[73]
2020, MNRAS, 499, 1406 Łokas, E
Lin, L., Li, C., Du, C., et al. 2020, MNRAS, 499, 1406 Łokas, E. L., Ebrová, I., del Pino, A., et al. 2016, ApJ, 826, 227
2020
-
[74]
C., Sheng, M.-J., & Liao, S
Ma, H.-C., Du, M., Ho, L. C., Sheng, M.-J., & Liao, S. 2024, A&A, 689, A293
2024
-
[75]
2018, MNRAS, 480, 5113
Marinacci, F., V ogelsberger, M., Pakmor, R., et al. 2018, MNRAS, 480, 5113
2018
-
[76]
2006, ApJ, 637, 214
Martinez-Valpuesta, I., Shlosman, I., & Heller, C. 2006, ApJ, 637, 214
2006
-
[77]
Mathewson, D. S. & Ford, V . L. 1996, The Astrophysical Journal Supplement Series, 107, 97 Menéndez-Delmestre, K., Sheth, K., Schinnerer, E., Jarrett, T. H., & Scoville, N. Z. 2007, ApJ, 657, 790
1996
-
[78]
& Sellwood, J
Merritt, D. & Sellwood, J. A. 1994, ApJ, 425, 551
1994
-
[79]
& Noguchi, M
Miwa, T. & Noguchi, M. 1998, ApJ, 499, 149
1998
-
[80]
J., Mao, S., & White, S
Mo, H. J., Mao, S., & White, S. D. M. 1998, MNRAS, 295, 319
1998
-
[81]
P., Pillepich, A., Springel, V ., et al
Naiman, J. P., Pillepich, A., Springel, V ., et al. 2018, MNRAS, 477, 1206
2018
-
[82]
2018, MNRAS, 477, 450
Nelson, D., Kauffmann, G., Pillepich, A., et al. 2018, MNRAS, 477, 450
2018
-
[83]
2015, Astronomy and Computing, 13, 12
Nelson, D., Pillepich, A., Genel, S., et al. 2015, Astronomy and Computing, 13, 12
2015
-
[84]
2019, Computational Astrophysics and Cosmology, 6, 2
Nelson, D., Springel, V ., Pillepich, A., et al. 2019, Computational Astrophysics and Cosmology, 6, 2
2019
-
[85]
N., Yang, G., et al
Ni, Q., Brandt, W. N., Yang, G., et al. 2021, MNRAS, 500, 4989
2021
-
[86]
N., et al
Ni, Q., Yang, G., Brandt, W. N., et al. 2019, MNRAS, 490, 1135
2019
-
[87]
V ., Moster, B., et al
Obreja, A., Macciò, A. V ., Moster, B., et al. 2018, MNRAS, 477, 4915
2018
-
[88]
S., Dutton, A
Obreja, A., Stinson, G. S., Dutton, A. A., et al. 2016, MNRAS, 459, 467
2016
-
[89]
2011, MNRAS, 418, 1392
Pakmor, R., Bauer, A., & Springel, V . 2011, MNRAS, 418, 1392
2011
-
[90]
2016, MNRAS, 455, 1134
Pakmor, R., Springel, V ., Bauer, A., et al. 2016, MNRAS, 455, 1134
2016
-
[91]
& Łokas, E
Peschken, N. & Łokas, E. L. 2019, MNRAS, 483, 2721
2019
-
[92]
& Norman, C
Pfenniger, D. & Norman, C. 1990, ApJ, 363, 391
1990
-
[93]
2018, MNRAS, 475, 648
Pillepich, A., Nelson, D., Hernquist, L., et al. 2018, MNRAS, 475, 648
2018
-
[94]
2019, MNRAS, 490, 3196
Pillepich, A., Nelson, D., Springel, V ., et al. 2019, MNRAS, 490, 3196
2019
-
[95]
Polyachenko, V . L. & Polyachenko, E. V . 2003, Astronomy Letters, 29, 447
2003
-
[96]
A., James, R
Raha, N., Sellwood, J. A., James, R. A., & Kahn, F. D. 1991, Nature, 352, 411
1991
-
[97]
S., et al
Reddish, J., Kraljic, K., Petersen, M. S., et al. 2022, MNRAS, 512, 160
2022
-
[98]
W., Huntley, J
Roberts, Jr., W. W., Huntley, J. M., & van Albada, G. D. 1979, ApJ, 233, 67
1979
-
[99]
2015, MNRAS, 449, 49
Rodriguez-Gomez, V ., Genel, S., V ogelsberger, M., et al. 2015, MNRAS, 449, 49
2015
-
[100]
V ., et al
Rodriguez-Gomez, V ., Pillepich, A., Sales, L. V ., et al. 2016, MNRAS, 458, 2371
2016
-
[101]
F., Lotz, J
Rodriguez-Gomez, V ., Snyder, G. F., Lotz, J. M., et al. 2019, MNRAS, 483, 4140
2019
-
[102]
Romeo, A. B. & Wiegert, J. 2011, MNRAS, 416, 1191
2011
-
[103]
2022, MNRAS, 512, 5339
Rosas-Guevara, Y ., Bonoli, S., Dotti, M., et al. 2022, MNRAS, 512, 5339
2022
-
[104]
2019, MNRAS, stz3180
Rosas-Guevara, Y ., Bonoli, S., Dotti, M., et al. 2019, MNRAS, stz3180
2019
-
[105]
2024, Galaxy Formation Physics behind Bar Formation: View from Cosmological Hydrodynamic Simulations
Rosas-Guevara, Y ., Bonoli, S., Puchwein, E., Dotti, M., & Contreras, S. 2024, Galaxy Formation Physics behind Bar Formation: View from Cosmological Hydrodynamic Simulations
2024
-
[106]
2021, MNRAS, 508, 926
Roshan, M., Ghafourian, N., Kashfi, T., et al. 2021, MNRAS, 508, 926
2021
-
[107]
& Elmegreen, B
Saha, K. & Elmegreen, B. 2018, ApJ, 858, 24
2018
-
[108]
& Naab, T
Saha, K. & Naab, T. 2013, MNRAS, 434, 1287
2013
-
[109]
V ., Navarro, J
Sales, L. V ., Navarro, J. F., Schaye, J., et al. 2010, MNRAS, 409, 1541
2010
-
[110]
2015, ApJS, 219, 4 Sánchez-Janssen, R
Salo, H., Laurikainen, E., Laine, J., et al. 2015, ApJS, 219, 4 Sánchez-Janssen, R. & Gadotti, D. A. 2013, MNRAS, 432, L56
2015
-
[111]
A., Bower, R
Schaye, J., Crain, R. A., Bower, R. G., et al. 2015, MNRAS, 446, 521
2015
-
[112]
Sellwood, J. A. 2012, ApJ, 751, 44
2012
-
[113]
Sellwood, J. A. 2014, Rev. Mod. Phys., 86, 1
2014
-
[114]
Sellwood, J. A. & Moore, E. M. 1999, ApJ, 510, 125
1999
-
[115]
Sellwood, J. A. & Wilkinson, A. 1993, Rep. Prog. Phys., 56, 173
1993
-
[116]
2024, A&A, 692, A159
Semczuk, M., Dehnen, W., Schönrich, R., & Athanassoula, E. 2024, A&A, 692, A159
2024
-
[117]
Sersic, J. L. 1968, Atlas de Galaxias Australes
1968
-
[118]
& Sellwood, J
Shen, J. & Sellwood, J. A. 2004, ApJ, 604, 614
2004
-
[119]
M., Elmegreen, B
Sheth, K., Elmegreen, D. M., Elmegreen, B. G., et al. 2008, ApJ, 675, 1141
2008
-
[120]
Shlosman, I., Frank, J., & Begelman, M. C. 1989, Nature, 338, 45
1989
-
[121]
2015, MNRAS, 452, 575
Sijacki, D., V ogelsberger, M., Genel, S., et al. 2015, MNRAS, 452, 575
2015
-
[122]
2017, MNRAS, 465, 3729
Spinoso, D., Bonoli, S., Dotti, M., et al. 2017, MNRAS, 465, 3729
2017
-
[123]
2010, MNRAS, 401, 791
Springel, V . 2010, MNRAS, 401, 791
2010
-
[124]
2018, MNRAS, 475, 676
Springel, V ., Pakmor, R., Pillepich, A., et al. 2018, MNRAS, 475, 676
2018
-
[125]
Springel, V ., White, S. D. M., Tormen, G., & Kau ffmann, G. 2001, MNRAS, 328, 726
2001
-
[126]
1964, ApJ, 139, 1217 van den Bergh, S
Toomre, A. 1964, ApJ, 139, 1217 van den Bergh, S. 2011, AJ, 141, 188 V ogelsberger, M., Genel, S., Sijacki, D., et al. 2013, MNRAS, 436, 3031 V ogelsberger, M., Genel, S., Springel, V ., et al. 2014a, Nature, 509, 177 V ogelsberger, M., Genel, S., Springel, V ., et al. 2014b, ...
1964
-
[127]
& Silk, J
Wang, B. & Silk, J. 1994, ApJ, 427, 759
1994
-
[128]
2015, A&A, 575, A7
Wozniak, H. 2015, A&A, 575, A7
2015
-
[129]
2021, MNRAS, 504, 3111
Wu, Y .-T., Trejo, A., Espada, D., & Miyamoto, Y . 2021, MNRAS, 504, 3111
2021
-
[130]
2019, MNRAS, 489, 842
Xu, D., Zhu, L., Grand, R., et al. 2019, MNRAS, 489, 842
2019
-
[131]
C., Debattista, V
Zhao, D., Du, M., Ho, L. C., Debattista, V . P., & Shi, J. 2020, ApJ, 904, 170
2020
-
[132]
2020, ApJ, 895, 92
Zhou, Z.-B., Zhu, W., Wang, Y ., & Feng, L.-L. 2020, ApJ, 895, 92
2020
-
[133]
2018, MNRAS, 473, 3000 Article number, page 17 of 19 A&A proofs: manuscript no
Zhu, L., van den Bosch, R., van de Ven, G., et al. 2018, MNRAS, 473, 3000 Article number, page 17 of 19 A&A proofs: manuscript no. aa_template Appendix A: Measurement of Disk Scale Length The disk scale length is derived from the decomposition of the galaxy’s stellar surface d...
1968
Reviewed August 11, 2026 · model on record in the stance chip above.
Discussion (0). Continue with ORCID to comment.