REVIEW 4 major objections 7 minor 14 references
High-resolution APEX/LAsMA $^{12}$CO and $^{13}$CO (3-2) observation of the G333 giant molecular cloud complex : III. Decomposition of molecular clouds into multi-scale hub-filament structures
T0 review · 4 major / 7 minor · reviewed 2026-08-15 · deepseek-v4-flash
Pith's one-line read This paper claims that molecular clouds are network structures assembled from gravitationally coupled, multi-scale hub-filament systems, in which hubs act as local gravitational centers and the primary sites of star formation.
desk verdict A useful new catalog of hub-filament systems in G333/G331, but the headline density-contrast result is partly built into the classification and the inflow interpretation needs a directional test. read the letter →
The pith
A machine-rendered reading of the paper's core claim, the machinery that carries it, and where it could break.
The reading
What carries the argument
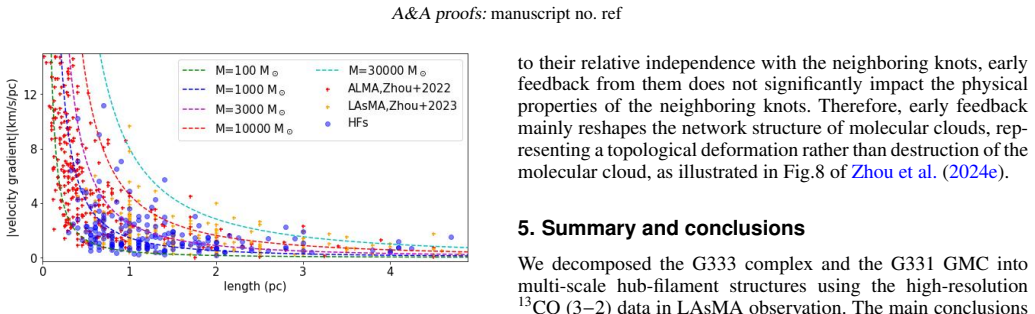
The central object is the hub-filament system (HFS): a dense hub where three or more filaments converge, operationally identified as a leaf in a dendrogram decomposition of the integrated-intensity map plus the surrounding 2.5-times-extended region. The key quantitative quantity is the density contrast, C = N_hub / N_annulus, the ratio of the mean column density in the hub to that in an elliptical ring just outside it; values around 1.5 separate HFs from non-HFs. The kinematic machinery is the fitted velocity gradient along each filament, compared with free-fall models for central masses of 100–10000 solar masses and interpreted as gas flowing toward the hub. Together this morphological and kinematic apparatus converts a catalogue of dense structures into an evolutionary and dynamical story.
What would settle it
Compute synthetic 13CO(3−2) maps of a cloud containing rotating or outflowing filaments with no true inflow and run the same peak-finding, density-contrast, and velocity-gradient pipeline; if hub-filament classifications and free-fall-like gradient scalings still emerge, the inflow interpretation is falsified. Observationally, a proper-motion survey of dense cores in a few dozen filaments would show directly whether the gas moves toward the hub at the free-fall speeds implied by the fitted masses.
Extended reading notes
Core claim
The paper decomposes the G333 complex and the G331 giant molecular cloud into multi-scale hub-filament systems (HFs), structures in which a dense hub collects gas along converging filaments. Applying a dendrogram-based peak identification, a filament-finding algorithm, and velocity-gradient fitting, the authors classify 148 of 438 leaf structures as HFs and 243 as non-HFs. Compared with non-HFs, HFs have significantly higher density contrast, larger masses, lower virial ratios, and higher rates of association with submillimetre clumps and radio continuum sources, as well as higher 8 µm peak intensities and clump luminosity-to-mass ratios. The velocity gradients measured along the filaments follow the free-fall scaling expected for central masses of roughly 100 to 10000 solar masses, matching the leaf mass distribution, and are interpreted as gas inflow toward the hubs. The paper concludes that molecular clouds are network structures formed by the gravitational coupling of multi-scale hub-filament systems: the hubs are the nodes, the local gravitational centers, and the main star-forming sites, and clumps in molecular clouds are equivalent to hubs. This network picture is offered as a natural explanation for why early feedback from protoclusters does not significantly change the kinematic properties of surrounding dense gas.
Load-bearing premise
The load-bearing premise is that the fitted velocity gradient along each filament traces gas actually flowing toward the hub; if rotation, outflow, or line-of-sight projection produces those gradients instead, the kinematic evidence for classifying the structures as hub-filament systems falls away.
Editorial extensions
If this is right
- Molecular clouds should be treated as networks of hubs connected by filaments, so the natural unit of cloud-scale star formation is the hub-filament system rather than the cloud as a monolithic object.
- Clumps in molecular clouds are equivalent to hubs, meaning clump catalogs can be reinterpreted as catalogs of network nodes that undergo gravitational focusing.
- Early feedback from forming stars mainly reshapes the topology of the network rather than destroying the cloud, leaving the kinematics of embedded dense gas largely governed by gravity.
- Density contrast C can serve as a single diagnostic of how far gravitational collapse has progressed and how strong the gravitational center is, complementing or even superseding density itself as an evolutionary indicator.
- Non-hub structures are likely earlier evolutionary states that will develop hubs and filaments, implying that the observed mix of HFs and non-HFs in a cloud maps onto a temporal sequence.
Reading between the lines
- Extending the paper's logic, if hub-filament systems are genuinely scale-free building blocks, then the same decomposition applied to other giant molecular clouds should yield hub masses and filament lengths with scale-free distributions; testing that prediction would tell whether G333 is typical.
- The network model implies that star formation efficiency in a cloud may depend more on the number and gravitational strength of its hubs than on total cloud mass, a distinction that could be tested by comparing clouds of equal mass but different hub populations.
- If non-HFs evolve into HFs through gravitational focusing, then density contrast should increase monotonically with structural age; using chemical clocks such as N2H+ abundance or CO depletion as age tracers could test this proposed sequence directly.
- The claim that early feedback is only a topological deformation predicts that hubs separated by more than one filament length should show statistically independent velocity dispersions; a pairwise correlation analysis of hub kinematics could falsify or support this independence.
Signed reviews
Editorial analysis
A structured set of objections, weighed in public.
Referee Report
Summary. The paper uses APEX/LAsMA 13CO(3-2) and 12CO(3-2) maps of the G333 complex and G331 GMC to identify intensity peaks with astrodendro, classify them into hub-filament systems (HFs) and non-HFs using a density contrast C (Eq. 1) plus filament morphology, and derive masses, virial ratios, velocity gradients, and associations with ATLASGAL clumps and CORNISH-South radio sources. It reports 148 HFs, finds that HFs have larger masses, lower virial ratios, higher density contrast, and more frequent clump/radio associations than non-HFs, and interprets these trends as evidence for an evolutionary sequence from non-HFs to HFs. The paper concludes that molecular clouds are network structures built from gravitationally coupled multi-scale hub-filament systems, with hubs as the nodes and clumps equivalent to hubs.
Significance. If the central interpretation holds, this is one of the largest systematic decompositions of a GMC into hub-filament systems and strengthens the observational basis of the hub-filament paradigm at cloud-clump scales. The main strengths are the homogeneous LAsMA data, the explicit multi-wavelength cross-matching to ATLASGAL and CORNISH-South, the inclusion of independent discriminants such as virial ratio and luminosity-to-mass ratio, and the connection to prior kinematic studies of G333. However, the significance is currently limited by two load-bearing caveats: the density-contrast comparison is in part a selection effect, and the kinematic evidence for inflow has not been shown to be directional. The independent property differences and clump/radio associations are valuable regardless, but the broad network claim in Sec. 4.3 needs stronger kinematic support.
major comments (4)
- [Sec. 3.4.2, Figs. 5 and 6] The evidence for inflow rests on fitting velocity gradients along filaments and comparing their magnitudes with free-fall predictions. A linear gradient along a filament can also be produced by rotation, shear, an outflow, or line-of-sight projection of a larger-scale velocity field. The paper does not report the sign of dv/dl relative to the hub position, does not check whether the filament velocity converges to the hub's systemic velocity at the hub end, and does not state how many of the 148 HFs pass a directional test. Please add such a test (e.g., gradient vectors pointing toward the hub, velocity reversal across the hub, or position-velocity diagrams along the spine) and report the passing fraction. This is needed to support the 'gravitational coupling' language in Sec. 4.3 and Summary point 7.
- [Sec. 3.3, Eq. (1), Figs. 4(a) and 7] Because C is a primary criterion in the HF/non-HF classification, and because structures near C≈1.5 that were 'challenging to classify' were excluded without a reported count, the statement that HFs have higher density contrast is at least partly a selection effect rather than an independent empirical finding. This matters for Sec. 4.2, where C is interpreted as measuring the extent of gravitational collapse and the strength of the gravitational center. Please validate that interpretation independently: for example, within the HF sample alone, correlate C with L/M or with radio association, or re-derive the classification without using C and check whether the property differences persist. The independent discriminants (mass, virial ratio, clump/radio associations) should be the primary support for the evolutionary sequence.
- [Sec. 3.2, type2 structures] The reduction of type2 structures to their dominant velocity component is an ad hoc assumption that can remove genuine multi-component inflow, which is precisely the kind of kinematic signature expected in hub-filament systems according to the arguments listed in Sec. 3.2. Please justify this choice with position-velocity diagrams for representative type2 structures, or show that the velocity-gradient and mass estimates are robust when secondary components are retained.
- [Sec. 4.3 and Summary point 7] The claim that 'clumps in molecular clouds are equivalent to the hubs' equates 13CO intensity leaves with ATLASGAL dust clumps without a quantitative match of sizes, masses, or velocities, and the universal network statement is extrapolated from two complexes. Please soften or support these statements: report the fraction of hubs that coincide with ATLASGAL clumps by both position and size, and add an explicit caveat that the network hypothesis is based on the G333/G331 data and needs testing in other clouds.
minor comments (7)
- [Sec. 4.2] The text 'As shown in Fig.3.5(e)' should read 'Fig.4(e)'.
- [Sec. 3.4.2] There is a typo in 'the same analysis presentend in Zhou et al. (2022)'; it should read 'presented'.
- [References] Zhou et al. 2024b and 2024c are listed with the same A&A volume, article number, and DOI; one of these entries needs to be corrected or disambiguated.
- [Figs. 4 and 9] The text describes distribution differences as 'significant' but does not report p-values or confidence intervals; please add a two-sample test (e.g., Kolmogorov-Smirnov or Mann-Whitney) for each comparison.
- [Sec. 3.1] The choice of min_value = 15 K km/s is said to be the best for recovering high-intensity peaks, but no quantitative criterion or sensitivity test is given; please show how the number of leaves and HFs changes with this parameter.
- [Sec. 3.4.1] The factor-of-two regridding is arbitrary; please show that the identified filaments and fitted gradients are stable under a different pixel scale.
- [Sec. 3.1] The distance ambiguity for peak1 is dismissed as not significantly affecting the statistics; please quantify the effect on masses and sizes of structures associated with peak1.
Circularity Check
Density-contrast comparison is partly a selection effect; the hub-filament network claim retains independent mass, virial, and clump/radio support.
-
self definitional
[Sec. 3.3 (Eq. 1) and Sec. 3.5 / Fig. 4(a)]
"In hub-filament systems (HFs), hubs exhibit substantially higher densities compared to filaments, which means a significant density contrast between the hub and the surrounding diffuse gas. We define the density contrast C as the ratio of the average column density in the hub region, Nhub, to the average column density within an elliptical ring surrounding the hub ... Generally, C≈ 1.5 can serve as the boundary between the two categories. ... As expected, in Fig. 4(a), HFs display significantly higher density contrast."
The HF/non-HF classification in Sec. 3.3 explicitly uses the density contrast C, with C≈1.5 as the boundary. The Sec. 3.5 statement that HFs 'display significantly higher density contrast' (Fig. 4a) is therefore partly guaranteed by the selection rule: the sample was separated on the very quantity that is then reported as a discovered difference. The circularity is partial rather than total because HFs are additionally required to have filaments converging on the high-density center, and because mass, virial ratio, ATLASGAL clump associations, and radio-source associations provide independent discriminants.
-
self definitional
[Sec. 4.2 and Summary item 6]
"According to the possible evolutionary sequence from non-HFs to HFs, currently, non-HFs lack a distinct gravitational focusing process that would result in significant density contrast. Thus, their density distribution is relatively uniform. Therefore, density contrast C effectively measures the extent of gravitational collapse and the strength of the gravitational center of the structure, which definitively shape the hub-filament morphology."
This interpretive step completes the circle: 'non-HFs lack a gravitational focusing process' is inferred from their low C and relatively uniform density distribution, but low C and the absence of a distinct high-density center are precisely the criteria used to define non-HFs. The claim that C 'measures the extent of gravitational collapse' is then attached to the same selection variable. The evolutionary sequence is not wholly circular because it also draws on independent clump/radio associations and L/M ratios, but the specific physical meaning assigned to C is largely a restatement of the classification criterion rather than an independently tested quantity.
full rationale
The paper's decomposition is mostly self-contained and observationally grounded: intensity peaks come from a dendrogram of the 13CO moment-0 map, filaments come from filfinder, masses and virial ratios come from LTE column densities, and the clump/radio associations come from external ATLASGAL and CORNISH catalogs. None of those steps is fitted to the network conclusion. The genuine circularity is concentrated in the density contrast C: C≈1.5 is one of the criteria used to define HFs versus non-HFs, so the demonstration that HFs have higher C (Fig. 4a) is partly a selection echo, and the later inference that C measures gravitational collapse imports meaning from that same classification. The circularity is partial because HFs also require convergent filaments and because the independent discriminants (mass, virial ratio, clump/radio association, L/M) support an evolutionary sequence from non-HFs to HFs. I do not count the many self-citations to Zhou et al. (2022, 2023, 2024d) as load-bearing circularity: the present paper reports its own velocity-gradient fits, and the cited prior studies are published, externally checkable observational analyses rather than unverified uniqueness or ansatz assertions. The free-fall comparison of velocity-gradient magnitudes is likewise not circular by construction, since the leaf masses are measured independently; the unresolved question of whether the gradients trace inflow rather than rotation or projection is a correctness/robustness risk, not a by-construction reduction. Overall, one central quantitative comparison reduces partly by construction, meriting a score of 6, but the network claim retains enough independent content that it is not fully forced.
Assumptions & free parameters
free parameters (5)
- Dendrogram min_value threshold =
15 K km/s
- Hub-filament extension factor =
2.5
- Density contrast boundary C =
1.5
- Non-HF subgroup threshold C =
1.2
- Regridding factor =
2
assumptions (6)
- domain assumption The dendrogram intensity peaks are potential hubs.
- domain assumption LTE analysis of 12CO and 13CO gives valid column densities and temperatures.
- domain assumption Velocity gradients along filaments trace gas inflow toward the hub.
- domain assumption Population differences with clump/radio associations represent an evolutionary sequence.
- domain assumption A single distance of 3.6 kpc applies to all structures.
- ad hoc to paper Overlapping velocity components can be separated by taking the dominant component only.
Cite this review
Pith. "Pith review of High-resolution APEX/LAsMA $^{12}$CO and $^{13}$CO (3-2) observation of the G333 giant molecular cloud complex : III. Decomposition of molecular clouds into multi-scale hub-filament structures." pith.science (2026). https://pith.science/paper/BHWQIY2T
@misc{pith2026250616664,
  author       = {Pith},
  title        = {Pith review of: High-resolution APEX/LAsMA $^12$CO and $^13$CO (3-2) observation of the G333 giant molecular cloud complex : III. Decomposition of molecular clouds into multi-scale hub-filament structures},
  year         = {2026},
  howpublished = {\url{https://pith.science/paper/BHWQIY2T}},
  note         = {Machine review of arXiv:2506.16664}
}
abstract
We decomposed the G333 complex and the G331 giant molecular cloud into multi-scale hub-filament systems (HFs) using the high-resolution $^{13}$CO (3$-$2) data from LAsMA observations. We employed the filfinder algorithm to identify and characterize filaments within HFs. Compared with non-HFs, HFs have significantly higher density contrast, larger masses and lower virial ratios. Velocity gradient measurements around intensity peaks provide evidence of gas inflow within these structures. There may be an evolutionary sequence from non-HFs to HFs. Currently, non-HFs lack a distinct gravitational focusing process that would result in significant density contrast. The density contrast can effectively measure the extent of gravitational collapse and the strength of the gravitational center of the structure that definitively shape the hub-filament morphology. Combined with the kinematic evidence in our previous studies, we suggest that molecular clouds are network structures formed by the gravitational coupling of multi-scale hub-filament structures. The knots in the networks are the hubs, they are the local gravitational centers and the main star-forming sites. Actually, clumps in molecular clouds are equivalent to the hubs. The network structure of molecular clouds can naturally explain that feedback from protoclusters does not significantly change the kinematic properties of the surrounding embedded dense gas structures, as concluded in our previous studies.
Figures


Figures from the paper (7 more)




Reference graph
Works this paper leans on
-
[1]
Bains, I., Wong, T., Cunningham, M., et al. 2006, MNRAS, 367, 1609, doi:
work page 2006
-
[3]
1051/0004-6361/202452706 Dewangan, L. K., Ojha, D. K., Sharma, S., et al. 2020, ApJ, 903, 13, doi:
work page 2020
-
[4]
3847/1538-4357/abb827 Elia, D., Molinari, S., Schisano, E., et al. 2017, MNRAS, 471, 100, doi:
work page 2017
-
[5]
1093/mnras/stx1357 Elia, D., Merello, M., Molinari, S., et al. 2021, MNRAS, 504, 2742, doi:
work page 2021
-
[6]
1093/mnras/stab1038 Güsten, R., Nyman, L. Å., Schilke, P., et al. 2006, A&A, 454, L13, doi:
work page 2006
-
[7]
1051/0004-6361:20065420 Hacar, A., Alves, J., Forbrich, J., et al. 2016, A&A, 589, A80, doi: 10.1051/ 0004-6361/201527805 Hacar, A., Alves, J., Tafalla, M., & Goicoechea, J. R. 2017, A&A, 602, L2, doi: 10.1051/0004-6361/201730732 Hacar, A., Clark, S. E., Heitsch, F., et al. 2023, in Astronomical Society of the Pacific Conference Series, V ol. 534, Protost...
-
[8]
2019, MNRAS, 485, 1775, doi:10.1093/mnras/ stz466 Koch, E
1093/mnras/stad005 Issac, N., Tej, A., Liu, T., et al. 2019, MNRAS, 485, 1775, doi:10.1093/mnras/ stz466 Koch, E. W., & Rosolowsky, E. W. 2015, MNRAS, 452, 3435, doi: 10.1093/ mnras/stv1521 Article number, page 9 of 10 A&A proofs: manuscript no. ref non-HFs HFs Fig
doi:10.1093/mnras/ 2019
-
[9]
The first row shows the physical properties of non-HFs without and with associated ATLASGAL clumps. For left to right, the physical parameters are the column density contrast defined in Sec.3.5, e ffective radius, mass and virial ratio, respectively. The second row shows the physical properties of HFs without and with associated radio sources. Kumar, M. S...
Show all 14 references
-
[10]
A., Churchwell, E., Babler, B
1111/j.1365-2966.2006.10055.x Benjamin, R. A., Churchwell, E., Babler, B. L., et al. 2003, PASP, 115, 953, doi: 10.1086/376696 Coletta, A., Molinari, S., Schisano, E., et al. 2025, A&A, 696, A151, doi:
2006
-
[11]
2022, MNRAS, 511, 4480, doi: 10.1093/ mnras/stac378 —
1088/0004-6256/149/4/138 Liu, H.-L., Tej, A., Liu, T., et al. 2022, MNRAS, 511, 4480, doi: 10.1093/ mnras/stac378 —. 2023, MNRAS, 522, 3719, doi: 10.1093/mnras/stad047 Liu, T., Zhang, Q., Kim, K.-T., et al. 2016a, ApJ, 824, 31, doi: 10.3847/ 0004-637X/824/1/31 Liu, T., Kim, K....
2022 arXiv
-
[12]
2018, ARA&A, 56, 41, doi: 10.1146/ annurev-astro-091916-055235 Myers, P
1051/0004-6361:20078661 Motte, F., Bontemps, S., & Louvet, F. 2018, ARA&A, 56, 41, doi: 10.1146/ annurev-astro-091916-055235 Myers, P. C. 2009, ApJ, 700, 1609, doi: 10.1088/0004-637X/700/2/1609 Nguyen, H., Nguyen Lu’o’ng, Q., Martin, P. G., et al. 2015, ApJ, 812, 7, doi:10. 10...
2018 doi
-
[13]
2012, A&A, 540, L11, doi: 10.1051/0004-6361/201118566 Schuller, F., Menten, K
1088/0004-637X/791/1/27 Schneider, N., Csengeri, T., Hennemann, M., et al. 2012, A&A, 540, L11, doi: 10.1051/0004-6361/201118566 Schuller, F., Menten, K. M., Contreras, Y ., et al. 2009, A&A, 504, 415, doi:10. 1051/0004-6361/200811568 Stephens, I. W., Jackson, J. M., Whitaker,...
2012 doi
-
[14]
2024, PASA, 41, e076, doi:10.1017/pasa.2024.47 Zhou, J
1088/0004-637X/804/2/141 Zhou, J.-W., & Davis, T. 2024, PASA, 41, e076, doi:10.1017/pasa.2024.47 Zhou, J. W., Dib, S., & Davis, T. A. 2024a, MNRAS, 534, 683, doi: 10.1093/ mnras/stae2101 Zhou, J. W., Dib, S., Juvela, M., et al. 2024b, A&A, 686, A146, doi: 10.1051/ 0004-6361/20...
2024 doi
-
[15]
W., Wyrowski, F., Neupane, S., et al
1093/mnras/stac1735 Zhou, J. W., Wyrowski, F., Neupane, S., et al. 2023, A&A, 676, A69, doi:
2023
Reviewed August 15, 2026 · model on record in the stance chip above.
Discussion (0). Continue with ORCID to comment.