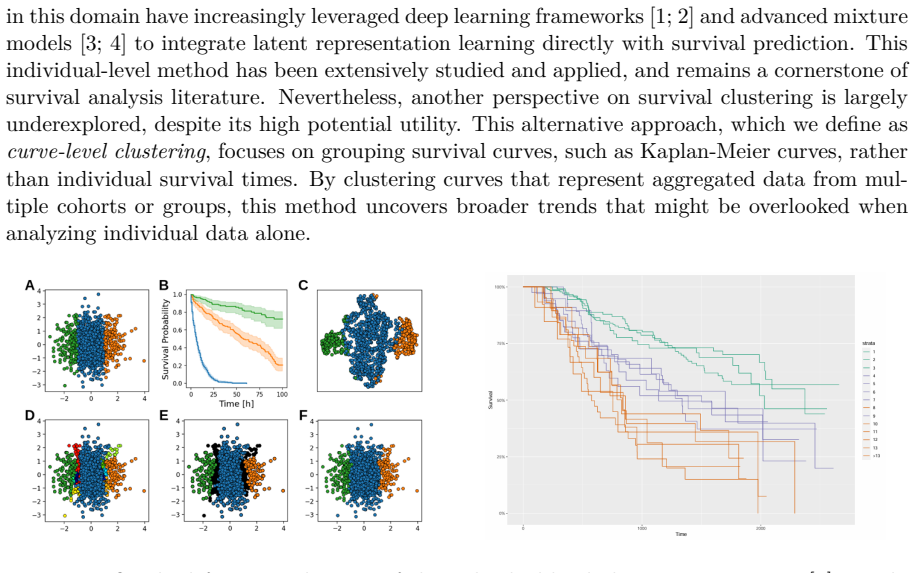
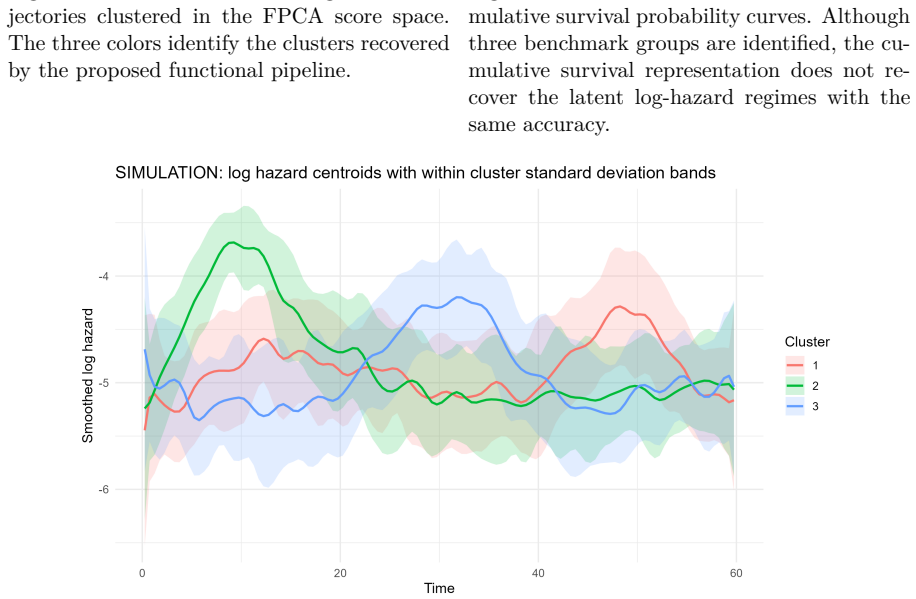
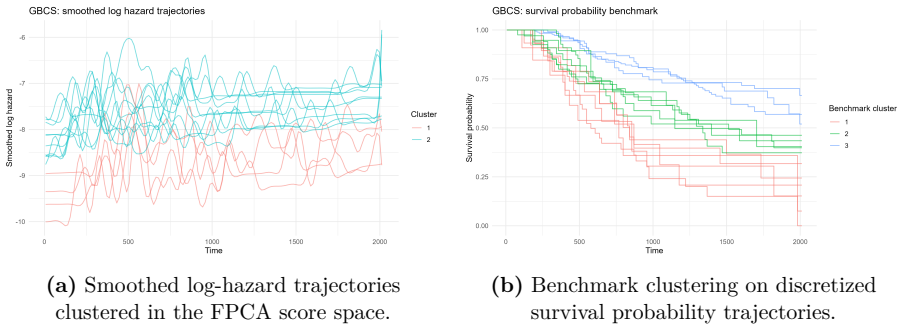
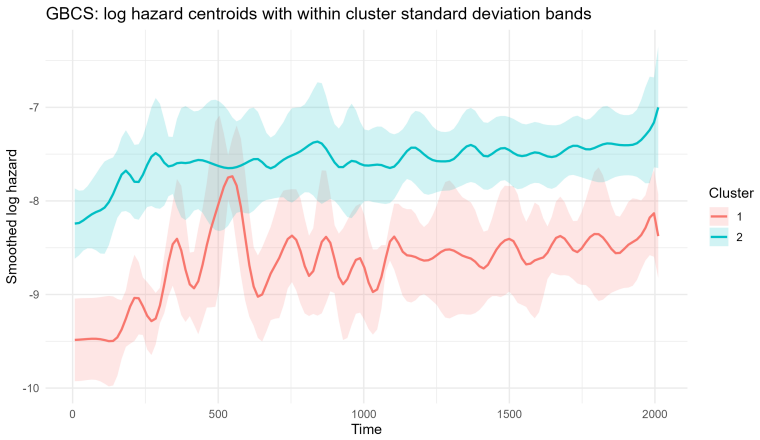
Functional Clustering of Survival Data via Smoothed Log-Hazard Trajectories: A Risk-Dynamics Perspective
Pith reviewed 2026-06-28 16:26 UTC · model grok-4.3
The pith
Clustering survival data on smoothed log-hazard trajectories identifies groups by distinct temporal risk patterns.
A machine-rendered reading of the paper's core claim, the machinery that carries it, and where it could break.
Core claim
By representing survival data as smoothed log-hazard trajectories and clustering the FPCA scores obtained from them, the method supplies an interpretable grouping based on how risk evolves temporally for each subject, with explicit comparisons showing competitive cohesion and robustness relative to cumulative-survival benchmarks.
What carries the argument
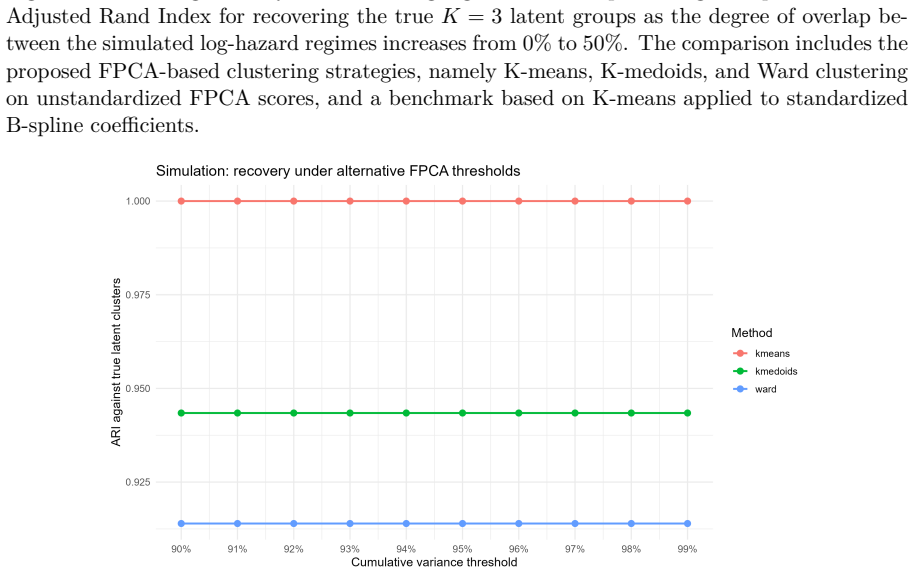
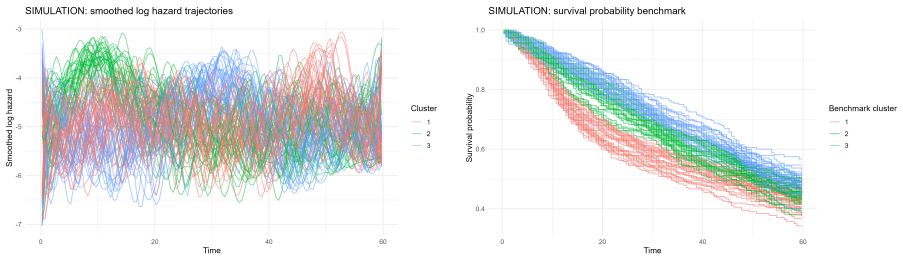
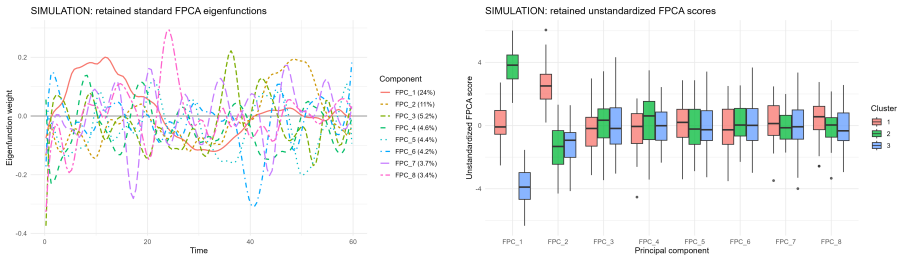
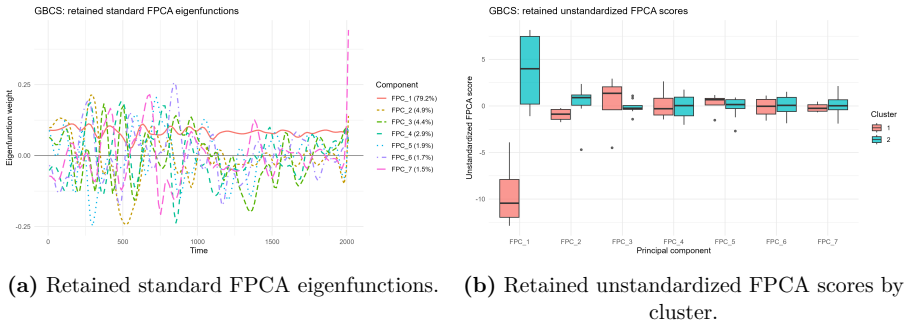
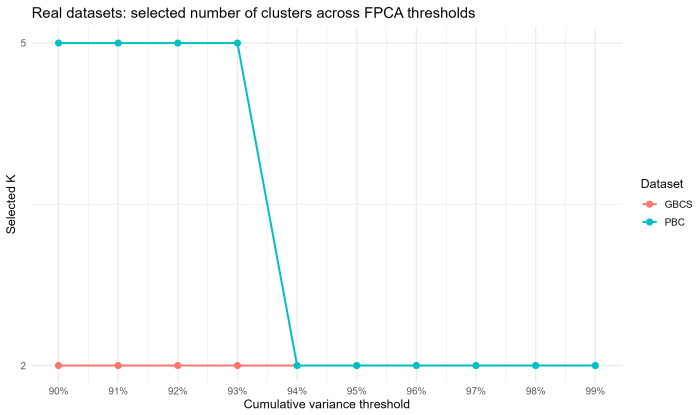
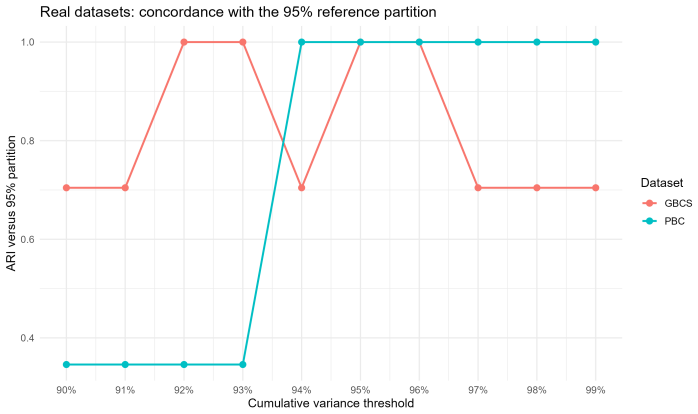
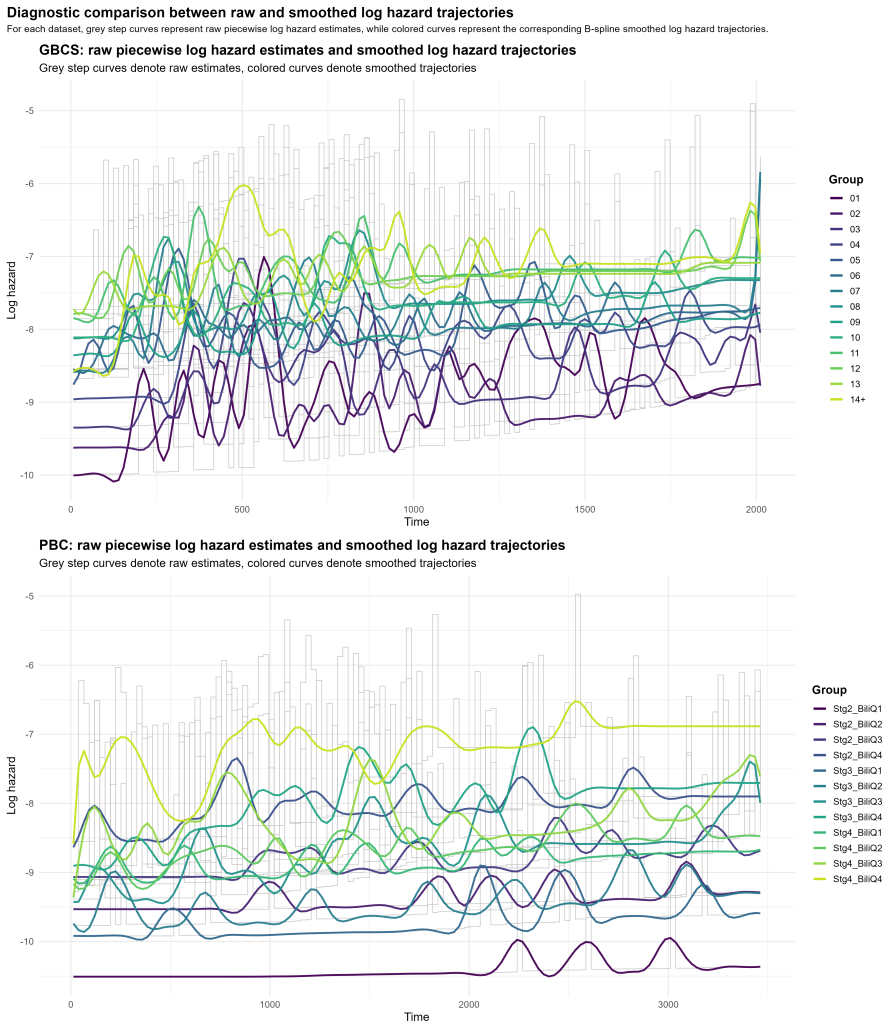
B-spline smoothed log-hazard trajectories reduced by functional principal component analysis, with clustering performed on the resulting FPCA scores after 95 percent variance selection.
If this is right
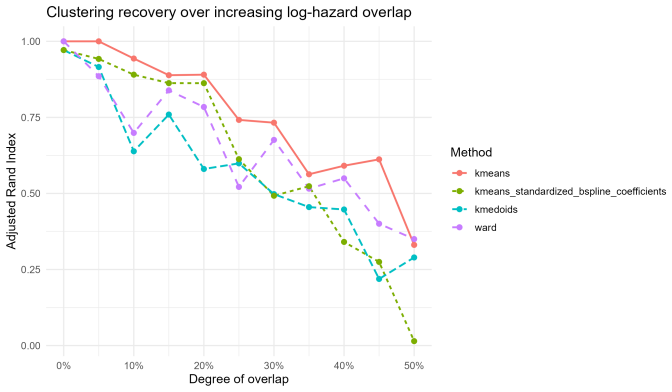
- The framework distinguishes patient groups whose hazard functions cross or overlap in simulations.
- It supplies built-in diagnostics for robustness against outliers and cohort imbalance.
- Clusters on real clinical data reflect interpretable differences in when risk rises or falls.
- Performance remains competitive in internal cohesion metrics against cumulative-survival alternatives.
Where Pith is reading between the lines
- The clusters could support timing-specific interventions, such as intensified monitoring during periods when a group's hazard trajectory peaks.
- Extending the smoothing step to include time-varying covariates might allow direct incorporation of treatment effects into the functional objects.
- Direct comparison of hazard-based versus survival-based partitions on the same data could quantify how much additional stratification the temporal dynamics provide.
Load-bearing premise
B-spline smoothing of the log-hazard trajectories captures the relevant temporal risk patterns well enough that the derived FPCA scores remain meaningful for clustering even with right-censoring present.
What would settle it
A simulation study in which true hazard trajectories contain sharp local features that the chosen B-spline basis fails to recover, producing clusters with markedly lower recovery accuracy than the cumulative-survival benchmark methods.
Figures
read the original abstract
This paper investigates clustering in survival data by shifting the analytical focus from cumulative survival probabilities to instantaneous risk, as characterized by the hazard function. We model smoothed log-hazard trajectories as functional objects that capture the temporal evolution of risk and propose a clustering framework based on Functional Principal Component Analysis applied to B-spline smoothed log-hazard trajectories. The number of retained functional principal components is selected before clustering using a 95% cumulative explained-variance rule, and clustering is then performed on the unstandardized FPCA scores. The proposed methodology is evaluated through simulation studies covering progressively complex scenarios, including overlapping and crossing hazard functions, cohort imbalance, heterogeneous risk profiles, and outlier contamination. The framework is further illustrated on two real-world clinical datasets, the German Breast Cancer Study and the Primary Biliary Cirrhosis dataset. Results show that the proposed log-hazard-based functional clustering framework provides an interpretable representation of relative temporal risk dynamics, with competitive internal cohesion and explicit robustness diagnostics when compared with cumulative-survival-based benchmarks.
Editorial analysis
A structured set of objections, weighed in public.
Referee Report
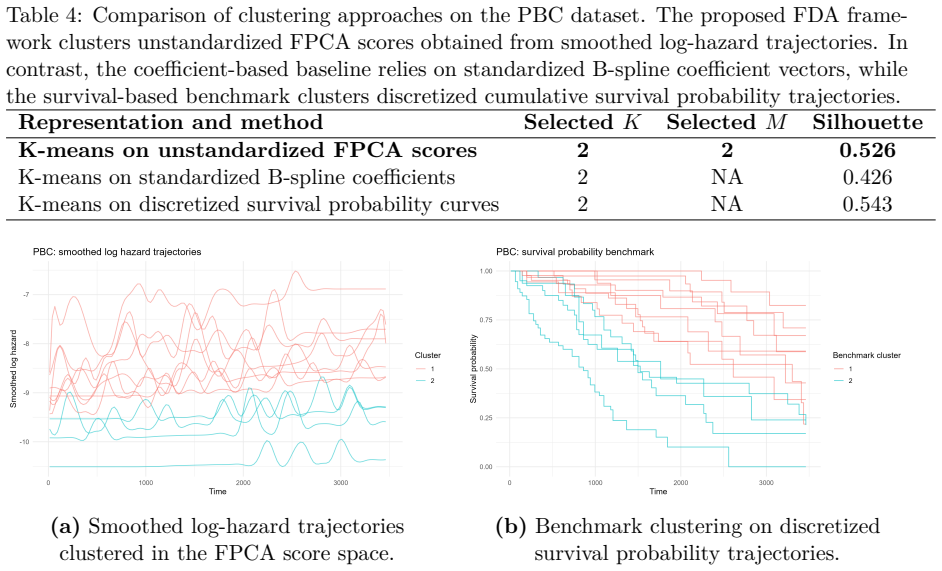
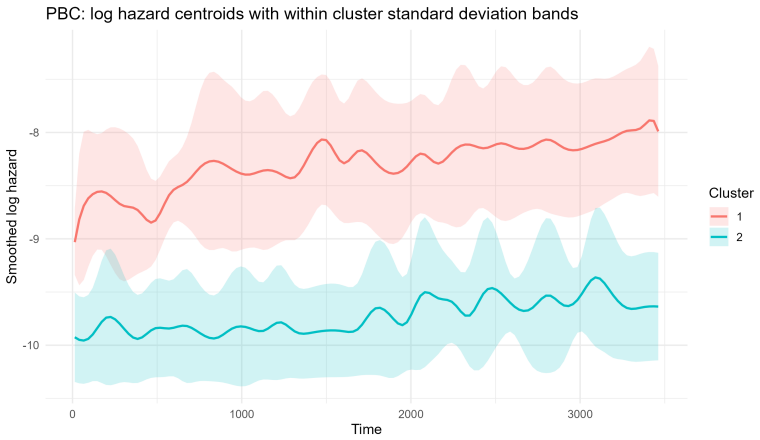
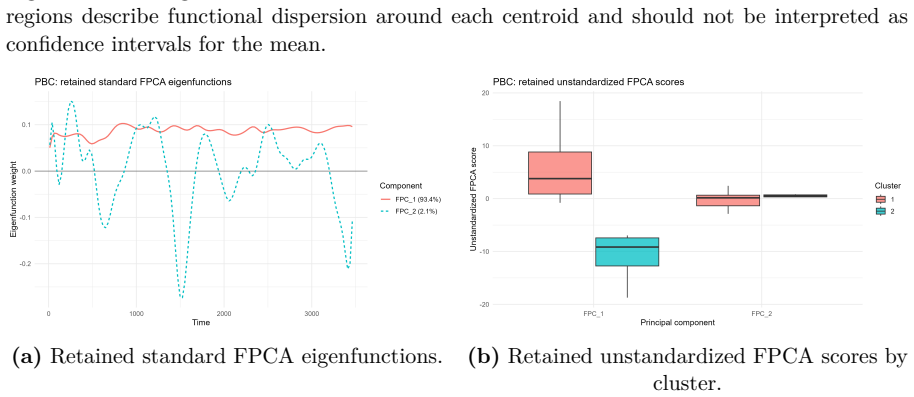
Summary. The manuscript proposes clustering survival data by modeling B-spline smoothed log-hazard trajectories as functional objects, applying FPCA with a 95% cumulative explained-variance threshold to select components, and performing clustering on the resulting unstandardized scores. The approach is evaluated in simulation studies that include overlapping and crossing hazards, cohort imbalance, heterogeneous profiles, and outlier contamination, and is illustrated on the German Breast Cancer Study and Primary Biliary Cirrhosis datasets, with claims of interpretable relative temporal risk dynamics and competitive internal cohesion versus cumulative-survival benchmarks.
Significance. If supported by quantitative evidence, the shift to log-hazard trajectories could provide a useful complementary perspective in survival analysis for identifying subgroups defined by dynamic risk patterns rather than cumulative survival. The simulation design covering progressively complex censoring and hazard scenarios, together with real-data applications and benchmark comparisons, would strengthen the contribution if the reported cohesion metrics and robustness diagnostics are clearly quantified.
major comments (2)
- [Abstract / Results] Abstract and Results sections: the claims of 'competitive internal cohesion' and 'explicit robustness diagnostics' are stated without any accompanying numerical values (e.g., silhouette widths, adjusted Rand indices, or mean squared errors), tables, or figures showing performance metrics, standard errors, or direct comparisons; this prevents evaluation of the central competitiveness assertion.
- [Methodology] Methodology (B-spline + FPCA pipeline): the paper relies on the assumption that B-spline smoothing of log-hazards followed by unstandardized FPCA scores remains stable and informative under right-censoring and crossing hazards, yet no sensitivity analysis or diagnostic for the impact of censoring on the retained components is described; this is load-bearing for the claim that the scores suffice for meaningful clustering.
minor comments (2)
- [Methodology] The 95% cumulative explained-variance rule for PC retention is presented without discussion of its sensitivity or comparison to alternative criteria such as cross-validation or scree plots.
- [Methodology] Notation for the functional objects and the precise definition of the log-hazard estimator should be clarified with an explicit equation early in the methods to aid reproducibility.
Simulated Author's Rebuttal
We thank the referee for the constructive comments, which help clarify the presentation of our results and strengthen the methodological justification. We address each major comment below.
read point-by-point responses
-
Referee: [Abstract / Results] Abstract and Results sections: the claims of 'competitive internal cohesion' and 'explicit robustness diagnostics' are stated without any accompanying numerical values (e.g., silhouette widths, adjusted Rand indices, or mean squared errors), tables, or figures showing performance metrics, standard errors, or direct comparisons; this prevents evaluation of the central competitiveness assertion.
Authors: We agree that the abstract and the summary of results do not include explicit numerical values or tables to support the claims of competitive internal cohesion and robustness. Although the simulation and real-data sections contain quantitative comparisons, these are not presented in summarized tabular form. In the revised manuscript we will add a table reporting mean silhouette widths (with standard errors), adjusted Rand indices where applicable, and direct benchmark comparisons against the cumulative-survival approach. revision: yes
-
Referee: [Methodology] Methodology (B-spline + FPCA pipeline): the paper relies on the assumption that B-spline smoothing of log-hazards followed by unstandardized FPCA scores remains stable and informative under right-censoring and crossing hazards, yet no sensitivity analysis or diagnostic for the impact of censoring on the retained components is described; this is load-bearing for the claim that the scores suffice for meaningful clustering.
Authors: The simulation design already includes right-censoring at multiple rates and crossing-hazard scenarios, and the clustering performance remains stable across these conditions. However, we acknowledge that a dedicated sensitivity analysis examining how censoring affects the number of retained FPCA components (under the 95% variance threshold) is not provided. We will add such diagnostics, including plots of cumulative explained variance as a function of censoring proportion, to the revised methodology section. revision: yes
Circularity Check
No significant circularity
full rationale
The paper introduces a methodological proposal for functional clustering of survival data via B-spline smoothed log-hazard trajectories followed by FPCA, with the number of components chosen by a 95% variance rule and clustering on unstandardized scores. Evaluation occurs on independent simulation scenarios (overlapping hazards, censoring, imbalance) and external clinical datasets (German Breast Cancer, PBC). No equations, fitted parameters, or self-citations are shown to reduce the claimed performance or interpretability to quantities defined by the authors' own inputs; the derivation chain remains self-contained against external benchmarks.
Axiom & Free-Parameter Ledger
free parameters (1)
- 95% cumulative explained-variance threshold
axioms (1)
- domain assumption Hazard functions can be estimated from right-censored survival data
Reference graph
Works this paper leans on
-
[1]
Chandra Mouli, Leonardo Teixeira, Jennifer Neville, and Bruno Ribeiro
S. Chandra Mouli, Leonardo Teixeira, Jennifer Neville, and Bruno Ribeiro. Deep lifetime clustering.arXiv preprint arXiv:1910.00547, 2019. URLhttps://arxiv.org/abs/1910. 00547
arXiv 1910
-
[2]
Massi, Thomas Weikert, Alexander Sauter, Verena Gotta, Timothy Müller, Flavio Vasella, Marian C
Laura Manduchi, Ričards Marcinkevičs, Michela C. Massi, Thomas Weikert, Alexander Sauter, Verena Gotta, Timothy Müller, Flavio Vasella, Marian C. Neidert, Marc Pfister, Bram Stieltjes, and Julia E. Vogt. A deep variational approach to clustering survival data. arXiv preprint arXiv:2106.05763, 2021. URLhttps://arxiv.org/abs/2106.05763
arXiv 2021
-
[3]
Gabriel Buginga and Edmundo de Souza e Silva. Clustering survival data using a mixture of non-parametric experts.arXiv preprint arXiv:2405.15934, 2024. URLhttps://arxiv. org/abs/2405.15934
arXiv 2024
-
[4]
Paidamoyo Chapfuwa, Chunyuan Li, Nikhil Mehta, Lawrence Carin, and Ricardo Henao. Survival cluster analysis. InProceedings of the ACM Conference on Health, Inference, and Learning, pages 60–68. ACM, 2020. doi: 10.1145/3368555.3384457
-
[5]
Survival hierarchical agglomerative clus- tering: Asemi-supervisedclusteringmethodincorporatingsurvivaldata
Alexander Lacki and Antonio Martinez-Millana. Survival hierarchical agglomerative clus- tering: Asemi-supervisedclusteringmethodincorporatingsurvivaldata. InJoseM.Juarez, Mar Marcos, Gregor Stiglic, and Allan Tucker, editors,Artificial Intelligence in Medicine, pages 3–12, Cham, 2023. Springer Nature Switzerland. ISBN 978-3-031-34344-5
2023
-
[6]
Villanueva, Marta Sestelo, Luis Meira-Machado, and Javier Roca-Pardiñas
Nora M. Villanueva, Marta Sestelo, Luis Meira-Machado, and Javier Roca-Pardiñas. clustcurv: An r package for determining groups in multiple curves.The R Journal, 13(1):164–183, 2021. doi: 10.32614/RJ-2021-032. URLhttps://doi.org/10.32614/ RJ-2021-032
-
[7]
Anna-Erica Léger and Stefano Mazzuco. What can we learn from the functional clustering of mortality data? an application to the human mortality database.Demographic Research, 45:803–834, 2021. doi: 10.4054/DemRes.2021.45.28. URLhttps://doi.org/10.4054/ DemRes.2021.45.28
-
[8]
Villanueva, Marta Sestelo, and Luis Meira-Machado
Nora M. Villanueva, Marta Sestelo, and Luis Meira-Machado. Efficient and scalable clustering of survival curves.arXiv preprint arXiv:2512.16481, 2025. URLhttps: //arxiv.org/abs/2512.16481
arXiv 2025
-
[9]
James O. Ramsay and Bernard W. Silverman.Functional Data Analysis. Springer, New York, NY, 2nd edition, 2005. ISBN 9780387400808. doi: 10.1007/b98888
-
[10]
Jan Gertheiss, David Rügamer, Bernard X. W. Liew, and Sonja Greven. Functional data analysis: Anintroductionandrecentdevelopments.arXiv preprint arXiv:2312.05523, 2023. URLhttps://arxiv.org/abs/2312.05523. 29
arXiv 2023
-
[11]
FabrizioMaturoandRosannaVerde. Poolingrandomforestandfunctionaldataanalysisfor biomedical signals supervised classification: Theory and application to electrocardiogram data.Statistics in Medicine, 41(12):2247–2275, 2022. doi: 10.1002/sim.9353. URLhttps: //doi.org/10.1002/sim.9353
-
[12]
Random survival forest for censored functional data.Statistics in Medicine, 44(5):e10344, 2025
Giuseppe Loffredo, Elvira Romano, and Fabrizio Maturo. Random survival forest for censored functional data.Statistics in Medicine, 44(5):e10344, 2025. doi: 10.1002/sim. 10344. URLhttps://doi.org/10.1002/sim.10344
work page doi:10.1002/sim 2025
-
[13]
Über lineare methoden in der wahrscheinlichkeitsrechnung.Annales Academiae Scientiarum Fennicae
Kari Karhunen. Über lineare methoden in der wahrscheinlichkeitsrechnung.Annales Academiae Scientiarum Fennicae. Series A. I. Mathematica-Physica, 37:1–79, 1947
1947
-
[14]
Julien Jacques and Cristian Preda. Functional data clustering: A survey.Advances in Data Analysis and Classification, 8(3):231–255, 2014. doi: 10.1007/s11634-013-0158-y. URLhttps://doi.org/10.1007/s11634-013-0158-y
-
[15]
Journal of Computational and Applied Mathematics , author =
Peter J. Rousseeuw. Silhouettes: A graphical aid to the interpretation and validation of cluster analysis.Journal of Computational and Applied Mathematics, 20:53–65, 1987. doi: 10.1016/0377-0427(87)90125-7
-
[16]
Terry M. Therneau and Patricia M. Grambsch.Modeling Survival Data: Extending the Cox Model. Springer, New York, NY, 2000. doi: 10.1007/978-1-4757-3294-8. 30
discussion (0)
Sign in with ORCID, Apple, or X to comment. Anyone can read and Pith papers without signing in.