REVIEW 2 major objections 2 minor 1 cited by
The Curious Case of Dark Faculae on M Dwarf Stars
T0 review · 2 major / 2 minor · reviewed 2026-06-26 · grok-4.3
Pith's one-line read M dwarf faculae appear dark because their magnetic flux tubes are shallower and have weaker vertical temperature gradients than on the Sun.
desk verdict Simulations suggest shallower flux tubes explain dark faculae on M dwarfs, but the support stays qualitative with no numbers or direct data checks. read the letter →
The pith
A machine-rendered reading of the paper's core claim, the machinery that carries it, and where it could break.
The reading
What carries the argument
shallower magnetic flux tubes combined with reduced vertical temperature gradients at M dwarf surfaces
What would settle it
Resolved spectroscopy or imaging of an M dwarf that measures the actual vertical extent of a facular magnetic field concentration or the temperature gradient inside it.
Extended reading notes
Core claim
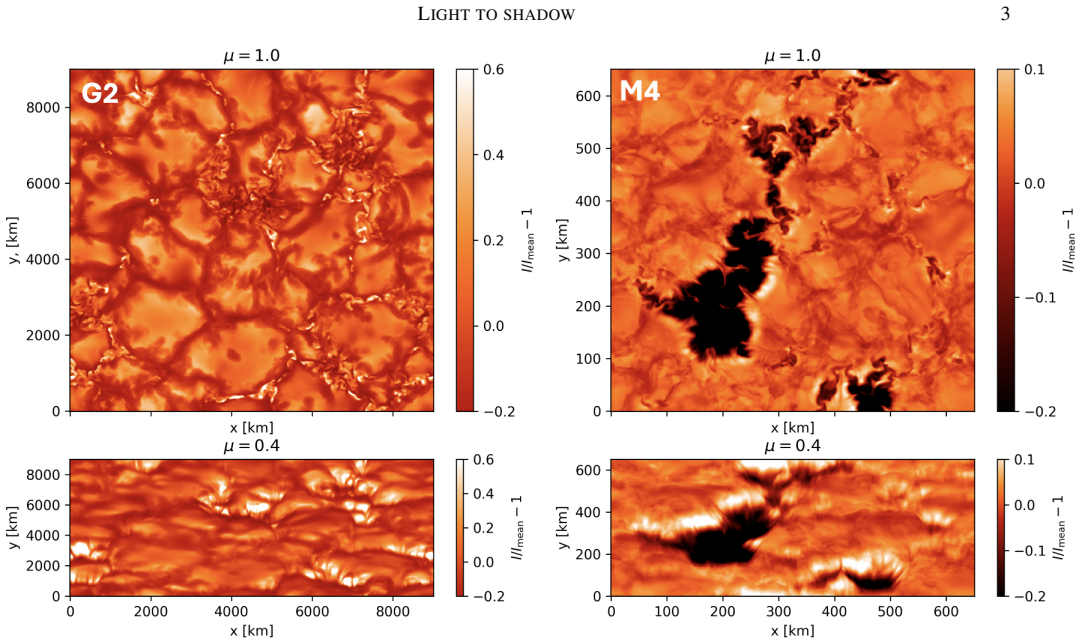
The central claim is that faculae transition from bright to dark across the G to M spectral sequence because magnetic flux tubes are shallower on M dwarfs and the vertical temperature gradients near the surface are reduced relative to the Sun. The simulations demonstrate that these geometric and thermal differences cause the facular regions to appear darker than the surrounding quiet photosphere at visible wavelengths, reversing the conventional brightening seen on hotter stars.
Load-bearing premise
The 3D radiative MHD simulations accurately capture the geometry of magnetic flux tubes and the temperature structure without major unaccounted biases.
Editorial extensions
If this is right
- The contribution of faculae to stellar disk-integrated brightness becomes negative on M dwarfs rather than positive.
- Wavelength-dependent corrections for stellar contamination in exoplanet transit observations must include darkening from faculae on M-dwarf hosts.
- The contrast sign between spots and faculae reverses at a specific point in the stellar temperature sequence.
- Models of stellar variability for late-type stars require separate treatment of facular contrast based on spectral type.
Reading between the lines
- Similar darkening could appear in even cooler objects such as L dwarfs if the same structural trends continue.
- Direct measurements of facular magnetic field depth on an M dwarf would provide an independent test of the proposed mechanism.
- The result suggests that assumptions about facular brightening in stellar atmosphere codes need re-examination for stars cooler than about 4000 K.
Editorial analysis
A structured set of objections, weighed in public.
Referee Report
Summary. The paper uses 3D MURaM radiative MHD simulations of faculae on M dwarfs (combined with MPS-ATLAS radiative transfer) to provide a qualitative explanation for the observed transition from bright faculae on G/K dwarfs to dark faculae on M dwarfs. The attribution is to shallower magnetic flux tubes and reduced vertical temperature gradients at M-dwarf surfaces relative to the Sun, with implications for stellar contamination in exoplanet transmission spectra.
Significance. If the attribution holds, the result would be significant for modeling stellar activity signals in JWST-era exoplanet observations, where M-dwarf hosts are common. The adoption of 3D RMHD simulations is a methodological strength that allows direct inspection of flux-tube geometry and thermal structure, going beyond 1D models.
major comments (2)
- [Abstract] Abstract and results section: The central claim is presented purely as a qualitative interpretation of simulation outputs with no reported quantitative metrics (e.g., wavelength-dependent intensity contrasts, Wilson depression depths, or vertical temperature gradient values with uncertainties). This is load-bearing because the attribution to 'shallower flux tubes and reduced vertical temperature gradients' cannot be assessed for robustness or compared to observations without such numbers.
- [Methods] Methods (MURaM and MPS-ATLAS description): The paper does not address or quantify potential systematic biases in the codes for Teff ~ 3000–3500 K regimes, such as treatment of wavelength-dependent opacities, convective overshoot, or line formation that could alter the reported flux-tube geometry and temperature structure. This directly affects whether the shallower tubes are a physical result or a modeling artifact.
minor comments (2)
- [Abstract] The abstract states the explanation is 'qualitative' but does not clarify what specific simulation diagnostics (e.g., maps of temperature or magnetic field at tau=1) were used to identify the shallower tubes.
- No direct comparison is shown between the simulated facular contrasts and existing observational constraints on M-dwarf faculae (e.g., from Kepler or TESS).
Simulated Author's Rebuttal
We thank the referee for their constructive comments and positive assessment of the work's significance. We address each major comment below, indicating where revisions will be made to strengthen the manuscript.
read point-by-point responses
-
Referee: [Abstract] Abstract and results section: The central claim is presented purely as a qualitative interpretation of simulation outputs with no reported quantitative metrics (e.g., wavelength-dependent intensity contrasts, Wilson depression depths, or vertical temperature gradient values with uncertainties). This is load-bearing because the attribution to 'shallower flux tubes and reduced vertical temperature gradients' cannot be assessed for robustness or compared to observations without such numbers.
Authors: We agree that quantitative metrics would strengthen the attribution and enable direct comparison with observations. Although the manuscript is framed as providing a qualitative explanation, we will revise the results section (and update the abstract accordingly) to report specific values extracted from the MURaM snapshots and MPS-ATLAS calculations. These will include Wilson depression depths, vertical temperature gradients at selected optical depths, and sample wavelength-dependent intensity contrasts, each accompanied by notes on their derivation and any associated uncertainties. This addition will support the interpretation without changing the overall qualitative focus. revision: yes
-
Referee: [Methods] Methods (MURaM and MPS-ATLAS description): The paper does not address or quantify potential systematic biases in the codes for Teff ~ 3000–3500 K regimes, such as treatment of wavelength-dependent opacities, convective overshoot, or line formation that could alter the reported flux-tube geometry and temperature structure. This directly affects whether the shallower tubes are a physical result or a modeling artifact.
Authors: The referee correctly identifies a gap in the current Methods description. We will add a new paragraph discussing the relevant aspects of MURaM and MPS-ATLAS for the Teff ~3000–3500 K range, including opacity handling, convective overshoot, and line formation. We will reference existing validation studies for these codes in cool-star regimes and note that the shallower flux-tube geometry is a consistent outcome across our simulation set. However, a full, quantitative assessment of all possible systematic biases would require an extensive additional parameter study that lies outside the scope of this paper; the revision will therefore be limited to an explicit discussion of these issues and their potential impact. revision: partial
Circularity Check
No circularity; qualitative explanation is direct output of MURaM/MPS-ATLAS simulations
full rationale
The paper runs 3D radiative MHD simulations with MURaM to generate facular models on M-dwarf parameters, then computes spectra with MPS-ATLAS. The attribution of the dark-to-bright transition to shallower flux tubes and weaker vertical temperature gradients is stated as a qualitative finding extracted from those simulation outputs. No equations, fitted parameters, or self-citation chains are presented that would make this attribution equivalent to the model inputs by construction. The derivation chain is therefore self-contained against external simulation benchmarks.
Assumptions & free parameters
assumptions (1)
- domain assumption MURaM and MPS-ATLAS codes produce physically realistic representations of stellar surface magnetic features when applied to M-dwarf parameters.
Cite this review
Pith. "Pith review of The Curious Case of Dark Faculae on M Dwarf Stars." pith.science (2026). https://pith.science/paper/BLEJR73C
@misc{pith2026260619854,
  author       = {Pith},
  title        = {Pith review of: The Curious Case of Dark Faculae on M Dwarf Stars},
  year         = {2026},
  howpublished = {\url{https://pith.science/paper/BLEJR73C}},
  note         = {Machine review of arXiv:2606.19854}
}
read the original abstract
The study of exoplanet atmospheres has brought a renewed interest in stellar astrophysics. Specifically, stellar magnetic activity from the host star contaminates exoplanet atmosphere transmission spectra, as evidenced by observations from the James Webb Space Telescope. The stellar surface magnetic features in the form of dark spots caused by large concentrations of surface magnetic fields and more diffuse and extended faculae caused by small-scale magnetic field concentrations change the apparent size of the star in a wavelength-dependent way. This spot and faculae contribution to the change in transit depth contaminates the planetary signal. Here we study the transition from bright faculae on G- and K-dwarfs to dark faculae on M-dwarfs. This dark appearance of faculae is in significant contrast to the conventional picture that faculae are brighter than the quiet star region as they are on the Sun. We use the 3D radiative magnetohydrodynamics code MURaM to simulate faculae, and calculate the faculae spectra with the MPS-ATLAS radiative transfer code. We present a qualitative explanation for the transition from dark to bright faculae attributing it to shallower flux tubes and reduced vertical temperature gradients at the surfaces of M dwarfs relative to the Sun.
Figures


Figures from the paper (2 more)


Forward citations
Cited by 1 Pith paper
-
Something new under the Sun: A magnetically driven CH/CN anti-correlation
The solar magnetic cycle produces a CH/CN anti-correlation in the integrated solar spectrum, which the authors scale up to argue that surface magnetism could mimic globular cluster multi-population signatures.
Reference graph
Works this paper leans on
-
[1]
S., Solanki, S
Anusha, L. S., Solanki, S. K., Hirzberger, J., & Feller, A. 2017, A&A, 598, A47
2017
-
[2]
2019, in The Sun as a Guide to Stellar Physics, ed
Basri, G. 2019, in The Sun as a Guide to Stellar Physics, ed. O. Engvold, J.-C. Vial, & A. Skumanich, 363–386
2019
-
[3]
H., & Reiners, A
Beeck, B., Schüssler, M., Cameron, R. H., & Reiners, A. 2015, A&A, 581, A42
2015
-
[4]
Berdyugina, S. V. 2005, Living Reviews in Solar Physics, 2, 8
2005
-
[5]
2024, A&A, 681, A32
Bhatia, T., Cameron, R., Peter, H., & Solanki, S. 2024, A&A, 681, A32
2024
-
[6]
S., Cameron, R
Bhatia, T. S., Cameron, R. H., Solanki, S. K., et al. 2022, A&A, 663, A166
2022
-
[7]
S., Cameron, R
Bhatia, T. S., Cameron, R. H., Solanki, S. K., et al. 2025, Astronomy & Astrophysics, submitted
2025
-
[8]
J., & Loughhead, R
Bray, R. J., & Loughhead, R. E. 1964, Sunspots (London: Chapman and Hall)
1964
Show all 47 references
-
[9]
F., Nordlund, Å., & Scharmer, G
Carlsson, M., Stein, R. F., Nordlund, Å., & Scharmer, G. B. 2004, ApJL, 610, L137 De Pontieu, B., Carlsson, M., Stein, R., et al. 2006, ApJ, 646, 1405
2004
-
[10]
1990, Science, 247, 556
Foukal, P., & Lean, J. 1990, Science, 247, 556
1990
-
[11]
H., & Zwaan, C
Gokhale, M. H., & Zwaan, C. 1972, Solar Physics, 26, 52
1972
-
[12]
S., Santos, Â
Karoff, C., Metcalfe, T. S., Santos, Â. R. G., et al. 2018, ApJ, 852, 46
2018
-
[13]
E., Shapiro, A
Keers, R. E., Shapiro, A. I., Kostogryz, N. M., et al. 2024, ApJL, 977, L7
2024
-
[14]
U., Schüssler, M., Vögler, A., & Zakharov, V
Keller, C. U., Schüssler, M., Vögler, A., & Zakharov, V. 2004, ApJL, 607, L59
2004
-
[15]
I., Witzke, V., et al
Kostogryz, N., Shapiro, A. I., Witzke, V., et al. 2023, Research Notes of the American Astronomical Society, 7, 39
2023
-
[16]
M., Shapiro, A
Kostogryz, N. M., Shapiro, A. I., Witzke, V., et al. 2024, arXiv e-prints, arXiv:2403.00118
2024
-
[17]
A., Solanki, S
Krivova, N. A., Solanki, S. K., Hofer, B., et al. 2021, A&A, 650, A70 Kuridze,D.,Wöger,F.,Uitenbroek,H.,etal.2025,ApJL,985,L23
2021
-
[18]
W., Scharmer, G
Lites, B. W., Scharmer, G. B., Berger, T. E., & Title, A. M. 2004, SoPh, 221, 65 Löptien, B., Lagg, A., van Noort, M., & Solanki, S. K. 2018, A&A, 619, A42
2004
-
[19]
1978, Stellar atmospheres
Mihalas, D. 1978, Stellar atmospheres
1978
-
[20]
M., Beeck, B., Unruh, Y
Norris, C. M., Beeck, B., Unruh, Y. C., et al. 2017, A&A, 605, A45
2017
-
[21]
M., Unruh, Y
Norris, C. M., Unruh, Y. C., Witzke, V., et al. 2023, MNRAS, 524, 1139
2023
-
[22]
Parker, E. N. 1978, ApJ, 221, 368
1978
-
[23]
E., DeForest, C
Parnell, C. E., DeForest, C. E., Hagenaar, H. J., et al. 2009, ApJ, 698, 75
2009
-
[24]
V., Apai, D., & Giampapa, M
Rackham, B. V., Apai, D., & Giampapa, M. S. 2018, ApJ, 853, 122
2018
-
[25]
V., Espinoza, N., Berdyugina, S
Rackham, B. V., Espinoza, N., Berdyugina, S. V., et al. 2023, RAS Techniques and Instruments, 2, 148
2023
-
[26]
P., Kurucz, R
Rajaguru, S. P., Kurucz, R. L., & Hasan, S. S. 2002, ApJL, 565, L101
2002
-
[27]
2011, Living Reviews in Solar Physics, 8, 3
Rempel, M., & Schlichenmaier, R. 2011, Living Reviews in Solar Physics, 8, 3
2011
-
[28]
G., Steiner, O., Berdyugina, S
Salhab, R. G., Steiner, O., Berdyugina, S. V., et al. 2018, A&A, 614, A78
2018
-
[29]
Seager, S., & Shapiro, A. I. 2024, The Astrophysical Journal, 970, 155
2024
-
[30]
I., Solanki, S
Shapiro, A. I., Solanki, S. K., Krivova, N. A., et al. 2014, A&A, 569, A38
2014
-
[31]
Schmutz, W. K. 2015, A&A, 581, A116
2015
-
[32]
N., Anusha, L
Smitha, H. N., Anusha, L. S., Solanki, S. K., & Riethmüller, T. L. 2017, ApJS, 229, 17
2017
-
[33]
N., Shapiro, A
Smitha, H. N., Shapiro, A. I., Witzke, V., et al. 2024, arXiv e-prints, arXiv:2411.14056
2024
-
[34]
Solanki, S. K. 1993, SSRv, 63, 1
1993
-
[35]
K., Krivova, N
Solanki, S. K., Krivova, N. A., & Haigh, J. D. 2013, ARA&A, 51, 311
2013
-
[36]
Spruit, H. C. 1976, SoPh, 50, 269
1976
-
[37]
C., & Zweibel, E
Spruit, H. C., & Zweibel, E. G. 1979, SoPh, 62, 15
1979
-
[38]
Stenflo, J. O. 1973, SoPh, 32, 41
1973
-
[39]
M., & Parnell, C
Thornton, L. M., & Parnell, C. E. 2011, SoPh, 269, 13 Vögler, A., Shelyag, S., Schüssler, M., et al. 2005, A&A, 429, 335
2011
-
[40]
R., et al
Wang, H., Spirock, T., Goode, P. R., et al. 1998, ApJ, 495, 957
1998
-
[41]
B., Shapiro, A
Witzke, V., Duehnen, H. B., Shapiro, A. I., et al. 2023, A&A, 669, A157
2023
-
[42]
I., Krivova, N
Witzke, V., Reinhold, T., Shapiro, A. I., Krivova, N. A., & Solanki, S. K. 2020, A&A, 634, L9
2020
-
[43]
I., Kostogryz, N
Witzke, V., Shapiro, A. I., Kostogryz, N. M., et al. 2022, ApJL, 941, L35
2022
-
[44]
2018, A&A, 619, A146
Schmutz, W. 2018, A&A, 619, A146
2018
-
[45]
I., Cernetic, M., et al
Witzke, V., Shapiro, A. I., Cernetic, M., et al. 2021, A&A, 653, A65 LIGHT TO SHADOW13
2021
-
[46]
I., Kostogryz, N
Witzke, V., Shapiro, A. I., Kostogryz, N. M., et al. 2024, A&A, 681, A81
2024
-
[47]
L., Solanki, S
Yeo, K. L., Solanki, S. K., & Krivova, N. A. 2013, A&A, 550, A95
2013
Reviewed June 26, 2026 · model on record in the stance chip above.
Discussion (0). Sign in to comment.