REVIEW 3 major objections 4 minor 2 cited by
The Drivers of Cosmic Dust Temperature Evolution
T0 review · 3 major / 4 minor · reviewed 2026-08-02 · deepseek-v4-flash
Pith's one-line read This paper argues that the rise in galaxy dust temperature with redshift is driven mainly by star formation surface density and dust-to-gas ratio, and provides a relation to estimate the latter from SED-fitting products.
desk verdict A solid SAM+RT dust temperature pipeline, but the unweighted mass sampling and the in-sample DTG fit should be probed before quoting Eq. 4 or Eq. 6. read the letter →
The pith
A machine-rendered reading of the paper's core claim, the machinery that carries it, and where it could break.
The reading
What carries the argument
The argument runs through a chain of tools: a semi-analytic galaxy formation model with explicit dust production and destruction supplies physical properties; a radiative transfer post-processing step renders each simulated galaxy as a full 0.1–10^4 μm SED using a fixed two-phase ISM geometry (an exponential disk plus spherical molecular clouds, with young stars escaping clouds on a 3 Myr timescale); mock photometry is then fitted with a single-temperature modified blackbody, exactly as in observational papers; finally, a game-theoretic feature-importance analysis over a machine-learning regressor attributes T_dust variations to the candidate drivers. The two-phase geometry is the load-beari
What would settle it
Take a sample of z≈4–6 galaxies with well-sampled far-infrared SEDs, derive T_dust and Σ_SFR exactly as the paper does, and measure DTG independently from CO or [CII] gas masses. If Eq. (6) systematically misses the measured DTG by more than its 0.2 dex scatter, or if galaxies with identical Σ_SFR and DTG but different morphologies have systematically different T_dust, then the claimed drivers are products of the assumed ISM geometry rather than general physics.
Extended reading notes
Core claim
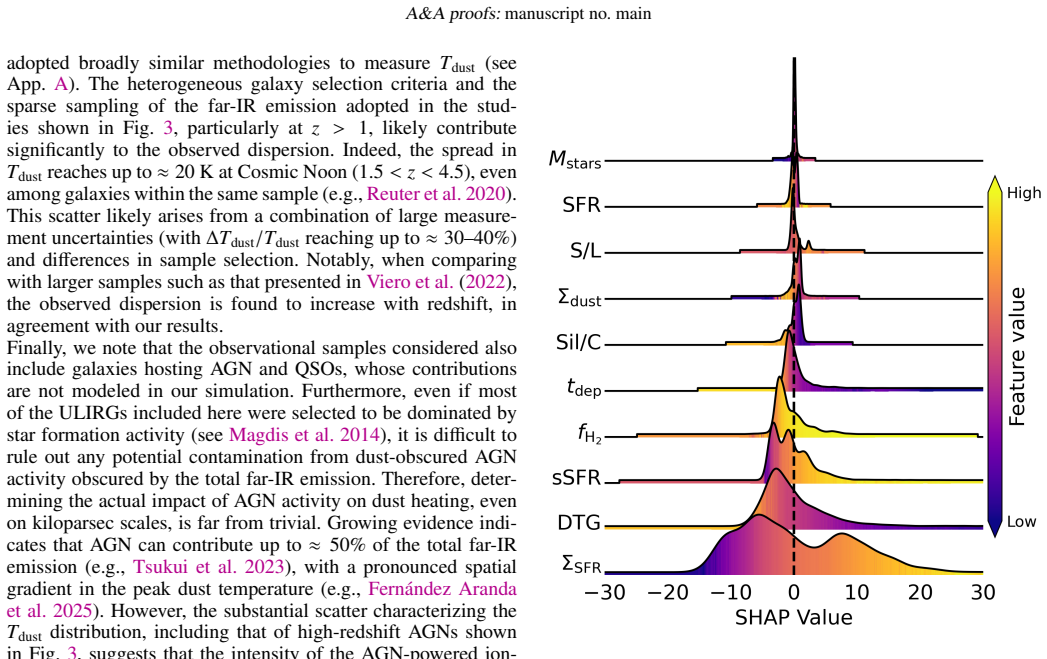
The paper's central claim is that the effective dust temperature of star-forming galaxies is set, at any redshift, by two galaxy-scale quantities: the star formation rate surface density, which controls the intensity of the interstellar radiation field, and the dust-to-gas ratio, which controls how optically thick the warm molecular clouds are. It predicts a linear rise T_dust = (6.95 ± 0.68) z + (25.2 ± 1.6) K for its simulated population and shows, with a Shapley importance analysis, that Σ_SFR and DTG dominate over stellar mass, depletion time, molecular fraction, and grain properties. The paper also derives a calibrated estimator, log DTG = −4.129 log(T_dust/K) + 0.456 log(Σ_SFR) − 1.295
Load-bearing premise
The load-bearing premise is that real galaxies can be represented by a smooth exponential disk with embedded spherical molecular clouds, and that all young stars remain trapped in those clouds for 3 million years; if high-redshift galaxies are clumpy or irregular instead, the predicted temperature trend and the dust-to-gas estimator could be artifacts.
Editorial extensions
If this is right
- The observed T_dust–redshift trend can be interpreted as the convolution of two evolving galaxy properties, compactness of star formation and dust abundance, rather than as an independent law.
- Dust-to-gas ratio becomes recoverable from far-infrared SED fitting products with about 0.2 dex scatter, which is competitive with uncertainties in gas-mass conversion factors.
- Grain size and chemical composition variations do not move T_dust, simplifying the interpretation of high-redshift SEDs.
- The intrinsic scatter in T_dust should grow with redshift, because the T_dust–Σ_SFR and T_dust–DTG relations steepen at high z.
- The inferred redshift trend is robust to the common choice of fixed emissivity index: setting β=1.6 shifts median temperatures by at most about 4 K.
Reading between the lines
- If the two-driver picture is correct, any sample selected by far-infrared brightness or star formation rate will systematically overestimate the mean T_dust at high z; correcting for selection requires binning or weighting by Σ_SFR and DTG.
- Equation (6) can be inverted: where independent gas-mass measurements exist, the same relation becomes a size or compactness estimator for high-redshift galaxies, since Σ_SFR = SFR/(πR²).
- Applying the same analysis to fully 3D hydrodynamical simulations with clumpy or merging ISM geometries would test whether the 7 K-per-unit-redshift slope survives outside the assumed symmetric-disk geometry.
Editorial analysis
A structured set of objections, weighed in public.
Referee Report
Summary. The paper uses the L-Galaxies SAM with explicit dust evolution, post-processed with GRASIL radiative transfer, to predict dust temperatures of simulated galaxies across 0<z<7.5. Mock photometry is binned into Herschel/ALMA bands and fit with single-temperature MBBs using EOS-Dustfit, mirroring observational methodology. The authors report a linear rise of median T_dust with redshift (Eq. 4), identify Σ_SFR and DTG as the main SHAP drivers, and provide a calibration relation (Eq. 6) to estimate DTG from Σ_SFR, T_dust, and redshift. They also compare with a broad compilation of observational T_dust measurements.
Significance. If the results hold, the paper provides a physically interpretable explanation of the observed T_dust–z trend in terms of SFR compactness and dust abundance, and offers a practical estimator of DTG from SED-derived quantities. The methodological design is a strength: mock photometry with realistic band coverage, MCMC-based MBB fitting, explicit tests of source-size and β_dust assumptions, and a quantitative feature-importance analysis. The comparison with many observational samples, including AGN systems, is thorough. However, the central quantitative claims are conditioned on two model ingredients that are not fully stress-tested: the uniform stellar-mass subsampling (which affects the reported medians and Eq. 4) and the assumed two-phase ISM geometry (which shapes every mock SED). A correction of the first and a sensitivity analysis of the second are needed before the predictions can be taken at face value.
major comments (3)
- [Section 2 and Section 3.1, Eq. (4)] The median T_dust per redshift bin is computed from a subsample that 'uniformly samples the full stellar-mass range' (Sect. 2). For the steep stellar-mass function of a SAM, equal-mass sampling over-represents high-mass galaxies relative to their abundance. Unless inverse sampling weights are applied, the 'median of the simulated galaxy population' (Sect. 3.1) is actually the median of a mass-selected subsample. Because high-mass galaxies tend to have higher SFR and Σ_SFR, this biases T_dust high; the bias likely grows with redshift as the sample shrinks (≈250 galaxies at z=7.57). This directly affects the slope and intercept of Eq. (4) and also propagates into the calibration of Eq. (6). Please either apply mass-function weights to the per-bin medians, or demonstrate that the unweighted median agrees with the weighted population median within the quoted uncertainties.
- [Section 3.3, Eq. (6)] The DTG estimator is fitted to the same simulated T_dust, Σ_SFR, and DTG values that it claims to relate (R²≈0.78, residual scatter ≈0.2 dex). As a calibration of the simulation this is legitimate, but the paper presents Eq. (6) as a tool for observational studies where DTG is not directly measurable. No out-of-sample or holdout test is provided; the quoted R² and scatter are in-sample fitting metrics and do not establish predictive accuracy for real galaxies, which have different selection functions and measurement errors. Please add a cross-validation split, a test on an independent simulation, or an explicit statement that the relation is a model-calibrated fit whose observational applicability is yet to be validated.
- [Sections 2.1 and 4] The two-phase ISM geometry (diffuse exponential disk plus spherical molecular clouds, with all stars born in clouds and escaping after t_esc=3 Myr) is the principal determinant of the mock SEDs and therefore of every fitted T_dust. The paper acknowledges this as a 'significant caveat' (Sect. 4), but the sensitivity tests presented are limited to source-size variations (Sect. 2.3) and fixed β_dust (Sect. 3.4). Given that the central claim—that Σ_SFR and DTG drive the T_dust–z trend—is mediated by this geometry, I ask for explicit sensitivity tests varying t_esc, cloud optical depth (or the M_MC/R_MC^2 ratio), or an alternative geometry prescription, or a clear quantitative argument for why such variations are expected to be subdominant. Without this, the driver identification is conditional on an untested model ingredient.
minor comments (4)
- [Table 3] The broken power-law coefficients (a, b, x_crit, q) are listed without uncertainties. Please include them, especially since Eq. (4) reports uncertainties.
- [Section 2.3, Eq. (3)] The symbol T_dust appears on both sides of Eq. (3). Please use a distinct notation for the intrinsic dust temperature on the right-hand side (e.g., T_dust^int) to avoid ambiguity in the CMB-correction formula.
- [Section 3.2] The abstract states that grain size/composition variations have negligible impact on T_dust. This is inferred from SHAP importances of SAM-predicted S/L and Sil/C features, not from controlled variations of these properties. Please soften the wording to indicate that this is a model-based inference rather than a direct experimental variation.
- [Fig. 3] The grey points show median values with 16–84th percentile dispersion. To ease comparison with Eq. (4), consider adding bootstrap confidence intervals on the medians, especially in the sparsely populated high-redshift bins.
Circularity Check
No significant circularity: forward radiative-transfer simulation with external comparison; Eq. 6 is an in-sample calibration, not a circular prediction.
full rationale
The derivation chain is a forward model: the L-Galaxies SAM with the dust model of Parente et al. (2023) is post-processed with GRASIL RT (Silva et al. 1998), mock photometry is binned (Sect. 2.2), and T_dust is recovered by MBB fitting (Sect. 2.3) exactly as done for real galaxies. The resulting T_dust(z) trend (Fig. 3) is then compared to external observational compilations and independent theoretical models, so the central claim does not reduce to its inputs. Eq. (4) is a polyfit to the simulated medians, a summary of the model output, not an input. Eq. (6) is an empirical calibration fitted to the same simulated T_dust, Sigma_SFR, DTG, and redshift values; its R^2≈0.78 is an in-sample goodness-of-fit statistic rather than an independent prediction, but the paper does not claim a held-out test, so this is a statistical-presentation caveat, not circularity. The SHAP/XGBoost analysis (Sect. 3.2) is explicitly an interpretative decomposition of the model's own output, not a first-principles derivation, and is therefore not circular. Self-citations to Parente et al. (2023), Tripodi et al. (2024), and Salvestrini et al. (2025) supply the simulation and fitting codes, not an unverified uniqueness theorem; they are described in the text and are not load-bearing as external proof. The acknowledged two-phase ISM geometry ('significant caveat of the model', Sect. 4) and the uniform stellar-mass sampling (Sect. 2) are modeling/selection limitations that could bias the quantitative trend, but they are not cases where a claimed result is equivalent to its own input by construction. No circular step is therefore identified.
Assumptions & free parameters
free parameters (6)
- A,B,C,D in DTG estimator (Eq. 6) =
A=-4.129±0.027, B=0.456±0.003, C=-1.295±0.019, D=4.521±0.042
- Broken power-law coefficients for T_dust scaling relations (Table 3) =
a,b,x_crit,q for Sigma_SFR, DTG, sSFR, fH2, tdep
- Source size factor 1.5 in solid angle estimate (Sect. 2.3) =
1.5 x(R_gas)
- Per-SED MBB fit parameters T_dust, M_dust, beta_dust =
T_dust, log M_dust, beta_dust per galaxy
- Stellar escape timescale t_esc in GRASIL =
3 Myr
- Mass absorption coefficient k0 =
0.45 cm^2 g^-1 at 250 GHz
assumptions (5)
- domain assumption GRASIL two-phase ISM geometry: smooth disk + spherical molecular clouds, all stars born in clouds with t_esc=3 Myr
- domain assumption Single-temperature optically thin modified blackbody with CMB correction adequately represents the cold dust SED
- domain assumption SAM dust model of Parente et al. (2023) correctly evolves DTG and grain populations
- domain assumption Sample selection M_star>=1e9 M_sun plus sSFR cut defines the star-forming population
- domain assumption SHAP attribution on an XGBoost regressor is interpreted as physical driver importance
Cite this review
Pith. "Pith review of The Drivers of Cosmic Dust Temperature Evolution." pith.science (2026). https://pith.science/paper/BM3J5AXL
@misc{pith2026260304505,
  author       = {Pith},
  title        = {Pith review of: The Drivers of Cosmic Dust Temperature Evolution},
  year         = {2026},
  howpublished = {\url{https://pith.science/paper/BM3J5AXL}},
  note         = {Machine review of arXiv:2603.04505}
}
abstract
Observations of the rest-frame far-infrared (far-IR) emission of galaxies suggest a mild increase of dust temperature $T_{\rm dust}$ with redshift, although constraining $T_{\rm dust}$ in high-redshift systems remains challenging due to limited sampling of the far-IR spectral energy distribution (SED). We present and discuss the redshift evolution of $T_{\rm dust}$ predicted by a cosmological galaxy evolution simulation with dust treatment, and interpret its dependence on other galaxy physical properties. We use a semi-analytic model of galaxy formation that includes an explicit treatment of dust, post-processed with radiative transfer. Dust temperatures are derived by applying modified blackbody SED fitting to the simulated galaxies, mirroring the methodology adopted in most observational studies. The dust temperature of simulated galaxies increases with redshift, in broad agreement with observational results. A feature-importance analysis reveals that the star formation rate surface density $\Sigma_{\rm SFR}$ and the dust-to-gas ratio (DTG) are the main drivers of dust temperature, tracing the intensity of the interstellar radiation field and the optical depth of warm molecular clouds, respectively. Galaxies with higher star formation rate surface density and lower DTGs -- common conditions at high$-z$ -- are associated with warmer dust. We provide a simple relation to estimate DTG from $\Sigma_{\rm SFR}$, $T_{\rm dust}$, and redshift. Variations in dust grain size and chemical composition have a negligible impact on $T_{\rm dust}$. Our results are particularly relevant to the study of dust properties with observations of high-z galaxies, where far-IR dust emission is not fully sampled.
Figures


Figures from the paper (4 more)


Forward citations
Cited by 2 Pith papers
-
The evolution of galaxy dust scaling relations in the COLIBRE simulations
The COLIBRE simulations reproduce the broad evolution of galaxy dust scaling relations from z=15 to 0, but overproduce the z<1 cosmic dust mass density and miss the most extreme sub-millimeter galaxies.
-
A first [CII] view of high-z quiescent galaxies
First ALMA [CII] observations of high-redshift quiescent galaxies reveal gas fractions from 0.1% to 25%, dust temperatures of 40-50 K, strong [CII] deficits, and merger-like features, suggesting merger-driven quenchin...
Reference graph
Works this paper leans on
-
[1]
Algera, H. S. B., Herrera-Camus, R., Aravena, M., et al. 2025, arXiv e-prints, arXiv:2512.02320 Algera, H. S. B., Inami, H., De Looze, I., et al. 2024a, MNRAS, 533, 3098 Algera, H. S. B., Inami, H., Oesch, P. A., et al. 2023, MNRAS, 518, 6142 Algera, H. S. B., Inami, H., Sommovigo, L., et al. 2024b, MNRAS, 527, 6867 Algera, H. S. B., Rowland, L., Stefanon...
arXiv 2025
-
[17]
A Value for n-Person Games, ed. H. W. Kuhn & A. W. Tucker (Princeton: Princeton University Press), 307–318 Shen, X., V ogelsberger, M., Nelson, D., et al. 2022, MNRAS, 510, 5560 Silva, L., Granato, G. L., Bressan, A., & Danese, L. 1998, ApJ, 509, 103 Simpson, J. M., Smail, I., Swinbank, A. M., et al. 2017, ApJ, 839, 58 Sommovigo, L. & Algera, H. 2025, MNR...
2022
-
[2021]
2018; Franco et al
and at higher redshift (e.g., Schreiber et al. 2018; Franco et al. 2020; Viero et al. 2022; Witstok et al. 2023). Most of the samples at intermediate and high redshift (z>1) are domi- nated by dusty star forming galaxies and sub-millimetre galaxies (DSFGs and SMGs, respectively; e.g., Faisst et al. 2020; Bakx et al. 2021; Sommovigo et al. 2022a,b; Bing et...
2018
-
[2022]
and to the REBELS (Reioniza- tion Era Bright Emission Line Survey; Schaerer et al. 2020). The results were presented in Sommovigo et al. (2022a) and Som- movigo et al. (2022b), respectively. We checked the consistency of the [CII]-based approach with the single MBB model, and we found consistent results both for the sample of local galaxies (e.g., with th...
2020
Reviewed August 2, 2026 · model on record in the stance chip above.
Discussion (0). Sign in to comment.