REVIEW 3 major objections 6 minor 1 cited by
Inhomogeneous stellar mixing in the final hours before the Cassiopeia A supernova
T0 review · 3 major / 6 minor · reviewed 2026-08-06 · deepseek-v4-flash
Pith's one-line read The Cassiopeia A supernova remnant preserves chemical evidence of a shell merger in the star's final hours before collapse.
desk verdict A new, well-measured compositional pattern in Cas A's O-rich ejecta, but the claim that it proves a pre-supernova shell merger is overstated because post-explosion mixing is not ruled out. read the letter →
The pith
A machine-rendered reading of the paper's core claim, the machinery that carries it, and where it could break.
The reading
What carries the argument
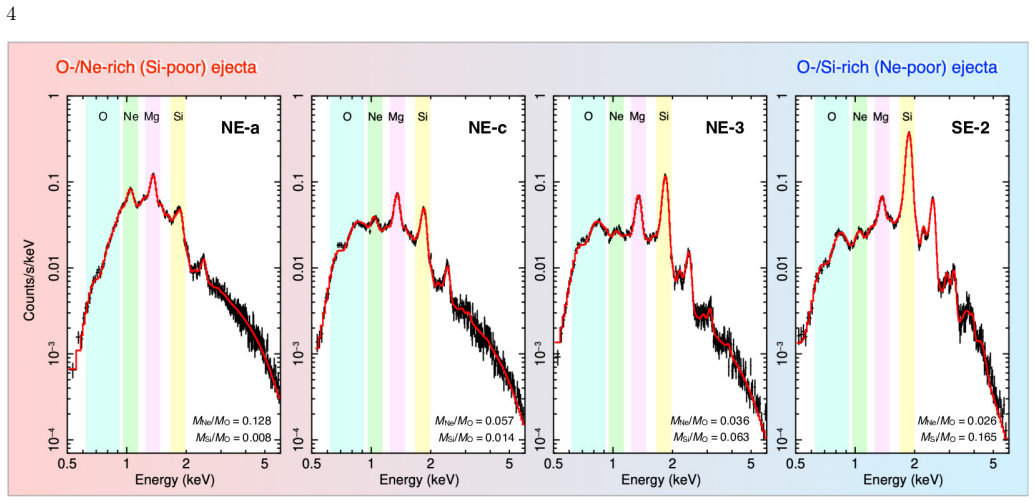
The two diagnostics that carry the argument are the mass ratios Ne/Mg and Si/Mg in fifteen spatially distinct O-rich regions, chosen because neon, magnesium, and silicon all coexist in the shell-merger convection zone and so avoid the systematic uncertainties that affect oxygen-based ratios. The theoretical side rests on the Si mass radius $M_r(\mathrm{Si}=0.05)$, defined as the maximum mass radius at which the silicon mass fraction exceeds 0.05 in one-dimensional pre-supernova models: models that have undergone a shell merger reach $\gtrsim 3.0\,M_\odot$ while standard models stay below $2.5\,M_\odot$. Plotting the observed knots against 1,499 such models shows the remnant straddling the two families, and a comparison with a three-dimensional shell-merger simulation reproduces the coexistence of large-scale O/Si-rich material with small surviving O/Ne-rich clumps.
What would settle it
A dedicated three-dimensional simulation of the explosion and remnant phase that starts from a homogeneous O/Ne-rich progenitor and reproduces the observed Ne/Mg–Si/Mg anti-correlation through post-explosion mixing alone would falsify the shell-merger interpretation.
Extended reading notes
Core claim
The paper's central claim is that Cassiopeia A's oxygen-rich ejecta contain a frozen record of a shell merger that began less than roughly $10^4$ seconds before gravitational collapse. The observed anti-correlation between Ne/Mg and Si/Mg across the remnant places some knots in the O/Ne-rich regime expected of progenitors that never merged their shells and others in the O/Si-rich regime expected after a merger. The coexistence of both regimes in the same remnant implies the merger did not homogenize the O-rich layer, leaving multi-scale compositional inhomogeneities and asymmetric velocity fields. This, the authors argue, is the first direct evidence that the final burning phase rapidly alters the pre-supernova interior, seeding the asymmetries that facilitate the explosion and influence the neutron star's kick and spin.
Load-bearing premise
The conclusion rests on the assumption that the observed neon-poor, silicon-rich knots were produced inside the progenitor before the explosion, and that no post-explosion process—such as Rayleigh–Taylor instabilities or reverse-shock processing—could create the same anti-correlation from an initially homogeneous O/Ne-rich ejecta.
Editorial extensions
If this is right
- The pre-supernova asymmetry seeds explosion asymmetries and helps revive the stalled shock in neutrino-driven supernova models.
- Cassiopeia A's low Ne/O, long noted from optical and X-ray data, finds a natural explanation: shell burning consumed Ne in the merged layer, rather than exotic nucleosynthesis.
- The inferred last-hours timescale ($\sim 10^4$ s) sets a constraint on convection and mixing speed in the final burning stage.
- The neutron-star kick and spin of the remnant can be linked to the low-mode convective flow asymmetries seeded by the shell merger.
- Progenitor models without shell mergers cannot reproduce the observed composition, narrowing the acceptable initial mass range toward roughly 17–20 $M_\odot$.
Reading between the lines
- A testable consequence not pursued here: other young oxygen-rich remnants whose progenitors fall in the ~15–20 $M_\odot$ range should show a similar Ne/Mg–Si/Mg scatter, while remnants of lower- or higher-mass stars should not.
- The degree of surviving inhomogeneity could be read as a clock: the smaller the O/Ne-rich clumps, the closer the collapse followed the shell merger, so mapping more knots could time the pre-supernova interior.
- Because the authors note that rotation and binary stripping can alter shell-merger mixing, comparing the scatter in Cassiopeia A with that in remnants with stripped-envelope histories could test single-star against binary evolution.
- A finer angular map with future X-ray instruments could reveal whether the inhomogeneity continues to smaller scales, tightening the comparison with the 3D simulation's clump sizes.
Editorial analysis
A structured set of objections, weighed in public.
Referee Report
Summary. The paper analyzes deep Chandra ACIS-S spectra of 15 O-rich ejecta knots in Cassiopeia A and reports a correlated decrease of Ne/Mg with increasing Si/Mg across these regions. Comparing the observed ratios to 1D pre-supernova models from Sukhbold et al. (2018), the authors argue that the Cas A progenitor experienced a shell merger in its final hours, that the merger inhomogeneously mixed the O-rich layer, and that the remnant today preserves both O/Ne-rich and O/Si-rich ejecta. They further infer that the shell merger began ≲10^4 s before collapse and that this pre-supernova asymmetry helped shape the explosion.
Significance. If the interpretation is correct, this would be the first direct observational evidence of a shell merger in a massive star's final hours, with substantial implications for explosion asymmetries, neutron-star kicks, and remnant morphology. The spectral analysis is careful: the authors use a deep 1 Ms Chandra dataset, fit two different plasma models, and justify the choice of Ne/Mg and Si/Mg over O-based ratios. The comparison against a large public progenitor grid is transparent, and the paper clearly acknowledges several limitations. The observational data are valuable regardless of the astrophysical conclusion. However, the central inference currently rests on a verbal argument against post-explosion mixing that is not backed by any quantitative test, and the shell-merger classification threshold is ad hoc. These issues are load-bearing for the paper's main claim.
major comments (3)
- [Section 3 and Section 4] The central claim that the observed Ne/Mg–Si/Mg anti-correlation cannot be produced by post-explosion mixing is not supported by any quantitative analysis. Section 3 states that the trend 'would be difficult to explain' by post-explosion mixing, and Section 4 asserts that 'post-supernova mixing alone would not explain the inhomogeneity,' but no mixing calculation or simulation is presented. This is a critical gap because a simple two-component mixture of an O/Ne-rich plasma (e.g., NE-a in Table A3: Ne/Mg ≈ 5.1, Si/Mg ≈ 0.31) with an Si-rich explosive product (e.g., SE-2: Ne/Mg ≈ 1.4, Si/Mg ≈ 8.8) naturally produces decreasing Ne/Mg with increasing Si/Mg, the same direction as the observed trend. The authors' statement that the reduction in Ne cannot be explained by mixing appears to assume that the Si-rich component must itself be Ne-rich, but explosive oxygen-burning products are Ne-poor, so dilution does lower Ne/Mg. The authors themselves concede in Section 4 that future work must 'compare the effects of mixing during the neutrino-driven explosion and the remnant phase,' which is precisely the test that is missing for the current conclusion. Without such a test, the data are equally consistent with post-explosion mixing of two reservoirs, and the pre-supernova shell-merger interpretation is not established.
- [Section 4, Figure 4] The definition of the shell-merger group relies on the hand-chosen threshold Mr(Si=0.05) ≥ 3 M⊙. This threshold is introduced visually ('we found that models with Mr(Si=0.05) ≳ 3 M⊙ form an isolated group') and is not derived from a physical principle or from the observational data. The paper does not test whether the conclusions change for threshold values such as 2.8 or 3.2 M⊙, nor for the alternative O-rich layer definition of oxygen mass fraction > 0.4. Because the central interpretation is that the observed points fall into two distinct progenitor groups, a sensitivity analysis of this classification is required.
- [Section 4, Figure 4 and Table A3] The comparison between local observational ratios and 1D model-averaged compositions is not apples-to-apples. The models are 1D and the plotted mass ratios are averages over the entire O-rich layer (oxygen mass fraction > 0.4), while the observations are 2-arcsec regions that may sample only a small portion of that layer, possibly with substantial explosive-nucleosynthesis contributions. The high Si, S, Ar, and Ca abundances in SE-2 (Table 1) are reminiscent of explosive oxygen burning, yet the paper classifies this region as O-rich stellar ejecta solely on the basis of Fe/O < 0.2. The authors acknowledge the 1D/3D issue in Sections 2 and 4, but they do not quantify how much of the observed Si in the O/Si-rich knots could be explosive in origin. This is a load-bearing ambiguity: if the Si-rich knots are dominated by explosive products, the comparison to pre-supernova shell-merger models is invalid.
minor comments (6)
- [Section 3 heading] The heading 'DATA ANALYIS' contains a typo and should read 'DATA ANALYSIS'.
- [Figure 1 caption] The caption contains typos: 'C-/-Ne-burning shell' and 'arrrow' should be corrected.
- [Table A2 caption] The caption says 'Same as Table A2' but should refer to Table 1.
- [Section 3, paragraph on spectral fitting] The sentence 'The increase in Si accompanying the decrease in Ne would be difficult to explain the effects of post-explosion mixing' is ungrammatical; consider rewording to '...difficult to explain as the effects of post-explosion mixing'.
- [Appendix A] The statement that the low Ne/O ratio 'can only be explained by stars undergoing shell mergers' is too strong given the mixing degeneracy acknowledged in Appendix B, and should be softened.
- [Figure 4 caption] The caption should explicitly define all plotting symbols and the color scale (mass ranges and Mr(Si=0.05)), as the current description is incomplete.
Circularity Check
No significant circularity: the central comparison uses the external Sukhbold et al. (2018) model grid, and the observed Ne/Mg and Si/Mg data are not fitted to the shell-merger diagnostic.
full rationale
The paper's derivation chain is: extract Chandra ACIS-S spectra from 15 O-rich regions, fit plasma models to obtain Ne/Mg and Si/Mg, overlay these ratios on the 1D pre-supernova grid of Sukhbold et al. (2018), classify models by the mass radius Mr(Si=0.05), and conclude that the observed spread across 'O-/Ne-rich' and 'O-/Si-rich' groups implies inhomogeneous shell-merger mixing. The threshold Mr(Si=0.05) >= 3 M⊙ is defined from the model grid, not tuned to the Cassiopeia A data, so the comparison is not a fitted-input-called-prediction. The observed anti-correlation is an independent spectroscopic measurement. Self-citations appear (Matsunaga et al. 2024; Sato et al. 2025; Yoshida et al. 2019, 2021), but the key model dataset is external, and the same assumptions are supported by non-self citations such as Woosley & Weaver (1995) and Thielemann et al. (1996). The paper's weakest point is the verbal dismissal of post-explosion mixing in Section 3 and Section 4 ('post-supernova mixing alone would not explain the inhomogeneity'), which is a quantitative-support gap rather than a circular reduction; no equation or fitted parameter is reused as its own conclusion. The conditional framing in Section 2 ('assuming a shell merger as the origin of the low Ne abundance') is an explicit assumption, not a hidden equivalence. Overall the derivation is self-contained against external benchmarks, with only minor non-load-bearing self-citations and a conditional argument structure; this does not rise to circularity.
Assumptions & free parameters
free parameters (4)
- Mr(Si=0.05) radius threshold =
≥3.0 M⊙
- Si fraction threshold in Mr(Si=0.05) =
0.05
- O-rich layer mass fraction threshold =
O mass fraction > 0.4
- Region selection (2 arcsec radius, 15 regions) =
N = 15, r = 2 arcsec
assumptions (5)
- domain assumption The O-rich ejecta in Cas A were synthesized during hydrostatic nucleosynthesis, and explosive nucleosynthesis does not significantly alter Ne/Mg and Si/Mg in this material.
- domain assumption The 1D pre-supernova models of Sukhbold et al. (2018) provide a valid description of the O-rich layer composition and its dependence on shell mergers for the Cas A progenitor.
- domain assumption The mass radius Mr(Si=0.05) is a reliable proxy for the occurrence and extent of shell mergers.
- domain assumption Post-explosion mixing and reverse-shock processing cannot reproduce the observed anti-correlation between Ne/Mg and Si/Mg.
- domain assumption The 15 selected regions are representative of the O-rich ejecta and avoid pile-up contamination.
Cite this review
Pith. "Pith review of Inhomogeneous stellar mixing in the final hours before the Cassiopeia A supernova." pith.science (2026). https://pith.science/paper/BMZYXX3A
@misc{pith2026250707563,
  author       = {Pith},
  title        = {Pith review of: Inhomogeneous stellar mixing in the final hours before the Cassiopeia A supernova},
  year         = {2026},
  howpublished = {\url{https://pith.science/paper/BMZYXX3A}},
  note         = {Machine review of arXiv:2507.07563}
}
abstract
Understanding stars and their evolution is a key goal of astronomical research and has long been a focus of human interest. In recent years, theorists have paid much attention to the final interior processes within massive stars, as they can be essential for revealing neutrino-driven supernova mechanisms and other potential transients of massive star collapse. However, it is challenging to observe directly the last hours of a massive star before explosion, since it is the supernova event that triggers the start of intense observational study. Here we report evidence for a final phase of stellar activity known as a ``shell merger'', an intense shell burning in which the O-burning shell swallows its outer C-/Ne-burning shell, deep within the progenitor's interior moments before the supernova explosion. In the violent convective layer created by the shell merger, Ne, which is abundant in the stellar O-rich layer, is burned as it is pulled inward, and Si, which is synthesized inside, is transported outward. The remnant still preserves some traces of such Ne-rich downflows and Si-rich upflows in the O-rich layer, suggesting that inhomogeneous shell-merger mixing began just hours ($\lesssim 10^4$ s) before its gravitational collapse. Our results provide the first observational evidence that the final stellar burning process rapidly alters the internal structure, leaving a pre-supernova asymmetry. This breaking of spherical symmetry facilitates the explosion of massive stars and influences various supernova and remnant characteristics, including explosion asymmetries and the neutron star's kick and spin.
Figures


Figures from the paper (3 more)


Forward citations
Cited by 1 Pith paper
-
Potassium abundances in extremely metal poor stars: Implications for nucleosynthesis in the final stages of massive star evolution
Potassium-to-iron and potassium-to-calcium ratios in seven extremely metal-poor stars show ~0.1 dex scatter, implying K production in massive stars or supernovae is decoupled from the processes driving Na/Mg variation.
Reference graph
Works this paper leans on
-
[1]
1989, GeoCoA, 53, 197, doi: 10.1016/0016-7037(89)90286-X
Anders, E., & Grevesse, N. 1989, GeoCoA, 53, 197, doi: 10.1016/0016-7037(89)90286-X
-
[2]
2020, Monthly Notices of the Royal Astronomical Society, 491, 972, doi: 10.1093/mnras/stz2952
Andrassy, R., Herwig, F., Woodward, P., & Ritter, C. 2020, Monthly Notices of the Royal Astronomical Society, 491, 972, doi: 10.1093/mnras/stz2952
-
[3]
Arnett, W. D., & Meakin, C. 2011, The Astrophysical Journal, 733, 78, doi: 10.1088/0004-637X/733/2/78
-
[4]
1994, The Astrophysical Journal Letters, 433, L41, doi: 10.1086/187543 13 Figure A9
Bazan, G., & Arnett, D. 1994, The Astrophysical Journal Letters, 433, L41, doi: 10.1086/187543 13 Figure A9. Mass fraction profiles for characteristic progenitor models in T. Sukhbold et al. (2018). Top: a progenitor model with a standard O-/Ne-rich layer. Middle: a progenitor model that has undergone a shell merger, forming a Ne-poor O-/Si-rich layer. Bo...
doi:10.1086/187543 2018
-
[5]
2021, The Astrophysical Journal, 915, 28, doi: 10.3847/1538-4357/abf82e
Bollig, R., Yadav, N., Kresse, D., et al. 2021, The Astrophysical Journal, 915, 28, doi: 10.3847/1538-4357/abf82e
-
[6]
Burrows, A., & Vartanyan, D. 2021, Nature, 589, 29, doi: 10.1038/s41586-020-03059-w 14 T able A3.Elemental mass ratios in each O-rich region. The errors are 1 σ level. MNe/MO MMg/MO MSi/MO MSi/MMg MNe/MMg NE-a (1.3 +0.1 −0.2)×10−1 (2.5+0.1 −0.3)×10−2 (7.7+0.7 −1.0)×10−3 (3.1+0.3 −0.5)×10−1 5.1+0.4 −0.9 NE-b (4.4 +1.1 −0.5)×10−2 (1.5+0.2 −0.1)×10−2 (1.1+0....
-
[7]
Burrows, A., Vartanyan, D., Dolence, J. C., Skinner, M. A., & Radice, D. 2018, SSRv, 214, 33, doi: 10.1007/s11214-017-0450-9
-
[8]
2024, ApJL, 964, L16, doi: 10.3847/2041-8213/ad319e
Burrows, A., Wang, T., & Vartanyan, D. 2024, ApJL, 964, L16, doi: 10.3847/2041-8213/ad319e
Show all 62 references
-
[9]
A., & Kirshner, R
Chevalier, R. A., & Kirshner, R. P. 1979, The Astrophysical Journal, 233, 154, doi: 10.1086/157377
1979 doi
- [10]
-
[11]
2018, Monthly Notices of the Royal Astronomical Society, 473, 1695, doi: 10.1093/mnras/stx2470
Collins, C., M¨ uller, B., & Heger, A. 2018, Monthly Notices of the Royal Astronomical Society, 473, 1695, doi: 10.1093/mnras/stx2470
2018 doi
-
[12]
M., & Ott, C
Couch, S. M., & Ott, C. D. 2013, The Astrophysical Journal Letters, 778, L7, doi: 10.1088/2041-8205/778/1/L7
2013 doi
-
[13]
M., & Ott, C
Couch, S. M., & Ott, C. D. 2015, The Astrophysical Journal, 799, 5, doi: 10.1088/0004-637X/799/1/5 De Looze, I., Milisavljevic, D., Temim, T., et al. 2024, ApJL, 976, L4, doi: 10.3847/2041-8213/ad855d
2015 doi
-
[14]
2016, The Astrophysical Journal, 818, 124, doi: 10.3847/0004-637X/818/2/124
Ugliano, M. 2016, The Astrophysical Journal, 818, 124, doi: 10.3847/0004-637X/818/2/124
2016 doi
-
[15]
A., Hammell, M
Fesen, R. A., Hammell, M. C., Morse, J., et al. 2006, The Astrophysical Journal, 636, 859, doi: 10.1086/498092
2006 doi
-
[16]
Fryer, C. L. 2004, The Astrophysical Journal Letters, 601, L175, doi: 10.1086/382044
2004 doi
-
[17]
1991, The Astrophysical Journal, 367, 619, doi: 10.1086/169657
Fryxell, B., Mueller, E., & Arnett, D. 1991, The Astrophysical Journal, 367, 619, doi: 10.1086/169657
1991 doi
-
[18]
W., Harrison, F
Grefenstette, B. W., Harrison, F. A., Boggs, S. E., et al. 2014, Nature, 506, 339, doi: 10.1038/nature12997
2014 doi
-
[19]
J., Janka, H
Hammer, N. J., Janka, H. T., & M¨ uller, E. 2010, The Astrophysical Journal, 714, 1371, doi: 10.1088/0004-637X/714/2/1371
2010 doi
-
[20]
2020, Monthly Notices of the Royal Astronomical Society, 499, 1154, doi: 10.1093/mnras/staa2898
Mandel, I. 2020, Monthly Notices of the Royal Astronomical Society, 499, 1154, doi: 10.1093/mnras/staa2898
2020 doi
-
[21]
P., Rakowski, C
Hughes, J. P., Rakowski, C. E., Burrows, D. N., & Slane, P. O. 2000, The Astrophysical Journal Letters, 528, L109, doi: 10.1086/312438
2000 doi
-
[22]
Hwang, U., & Laming, J. M. 2012, The Astrophysical Journal, 746, 130, doi: 10.1088/0004-637X/746/2/130
2012 doi
-
[23]
M., Badenes, C., et al
Hwang, U., Laming, J. M., Badenes, C., et al. 2004, The Astrophysical Journal l, 615, L117, doi: 10.1086/426186
2004 doi
-
[24]
2017, The Astrophysical Journal, 837, 84, doi: 10.3847/1538-4357/aa618e
Janka, H.-T. 2017, The Astrophysical Journal, 837, 84, doi: 10.3847/1538-4357/aa618e
2017 doi
-
[25]
2020, The Astrophysical Journal, 902, 63, doi: 10.3847/1538-4357/abb8db
Joyce, M., Leung, S.-C., Moln´ ar, L., et al. 2020, The Astrophysical Journal, 902, 63, doi: 10.3847/1538-4357/abb8db
2020 doi
-
[26]
2015, The Astrophysical Journal, 808, 168, doi: 10.1088/0004-637X/808/2/168
Kato, C., Delfan Azari, M., Yamada, S., et al. 2015, The Astrophysical Journal, 808, 168, doi: 10.1088/0004-637X/808/2/168
2015 doi
-
[27]
2018, The Astrophysical Journal, 856, 18, doi: 10.3847/1538-4357/aab092
Katsuda, S., Morii, M., Janka, H.-T., et al. 2018, The Astrophysical Journal, 856, 18, doi: 10.3847/1538-4357/aab092
2018 doi
-
[28]
E., Do, T., de Mink, S
Kerzendorf, W. E., Do, T., de Mink, S. E., et al. 2019, Astronomy and Astrophysics, 623, A34, doi: 10.1051/0004-6361/201732206
2019 doi
-
[29]
T., & M¨ uller, E
Kifonidis, K., Plewa, T., Janka, H. T., & M¨ uller, E. 2003, Astronomy & Astrophysics, 408, 621, doi: 10.1051/0004-6361:20030863 15
2003 doi
-
[30]
2000, The Astrophysical Journal, 535, 402, doi: 10.1086/308821
Lai, D., & Goldreich, P. 2000, The Astrophysical Journal, 535, 402, doi: 10.1086/308821
2000 doi
-
[31]
2021, Astronomy and Astrophysics, 656, A58, doi: 10.1051/0004-6361/202140506
Laplace, E., Justham, S., Renzo, M., et al. 2021, Astronomy and Astrophysics, 656, A58, doi: 10.1051/0004-6361/202140506
2021 doi
-
[32]
Laplace, E., Schneider, F. R. N., & Podsiadlowski, P. 2025, A&A, 695, A71, doi: 10.1051/0004-6361/202451077
2025 doi
-
[33]
2024, ApJ, 970, 4, doi: 10.3847/1538-4357/ad5284
Matsunaga, K., Uchida, H., Enokiya, R., et al. 2024, ApJ, 970, 4, doi: 10.3847/1538-4357/ad5284
2024 doi
-
[34]
Milisavljevic, D., & Fesen, R. A. 2015, Science, 347, 526, doi: 10.1126/science.1261949
2015 doi
-
[35]
2024, The Astrophysical Journal Letters, 965, L27, doi: 10.3847/2041-8213/ad324b M¨ uller, B., Melson, T., Heger, A., & Janka, H.-T
Milisavljevic, D., Temim, T., De Looze, I., et al. 2024, The Astrophysical Journal Letters, 965, L27, doi: 10.3847/2041-8213/ad324b M¨ uller, B., Melson, T., Heger, A., & Janka, H.-T. 2017, Monthly Notices of the Royal Astronomical Society, 472, 491, doi: 10.1093/mnras/stx1962...
2024 doi
-
[36]
2020, The Astrophysical Journal, 888, 111, doi: 10.3847/1538-4357/ab5dba
Ono, M., Nagataki, S., Ferrand, G., et al. 2020, The Astrophysical Journal, 888, 111, doi: 10.3847/1538-4357/ab5dba
2020 doi
-
[37]
L., & Bocchino, F
Orlando, S., Miceli, M., Pumo, M. L., & Bocchino, F. 2016, The Astrophysical Journal, 822, 22, doi: 10.3847/0004-637X/822/1/22
2016 doi
-
[38]
T., et al
Orlando, S., Wongwathanarat, A., Janka, H. T., et al. 2021, Astronomy and Astrophysics, 645, A66, doi: 10.1051/0004-6361/202039335
2021 doi
-
[39]
T., Wongwathanarat, A., et al
Orlando, S., Janka, H. T., Wongwathanarat, A., et al. 2025, A&A, 696, A108, doi: 10.1051/0004-6361/202553833
2025 doi
-
[40]
2024, Monthly Notices of the Royal Astronomical Society, 533, 687, doi: 10.1093/mnras/stae1778
Rizzuti, F., Hirschi, R., Varma, V., et al. 2024, Monthly Notices of the Royal Astronomical Society, 533, 687, doi: 10.1093/mnras/stae1778
2024 doi
-
[41]
2023, Monthly Notices of the Royal Astronomical Society, 526, 2765, doi: 10.1093/mnras/stad2949
Saio, H., Nandal, D., Meynet, G., & Ekstr¨ om, S. 2023, Monthly Notices of the Royal Astronomical Society, 526, 2765, doi: 10.1093/mnras/stad2949
2023 doi
-
[42]
2020, The Astrophysical Journal, 893, 49, doi: 10.3847/1538-4357/ab822a
Sato, T., Yoshida, T., Umeda, H., et al. 2020, The Astrophysical Journal, 893, 49, doi: 10.3847/1538-4357/ab822a
2020 doi
-
[43]
2021, Nature, 592, 537, doi: 10.1038/s41586-021-03391-9
Sato, T., Maeda, K., Nagataki, S., et al. 2021, Nature, 592, 537, doi: 10.1038/s41586-021-03391-9
2021 doi
-
[44]
2025, ApJ, 984, 185, doi: 10.3847/1538-4357/adc68d
Sato, T., Matsunaga, K., Sawada, R., et al. 2025, ApJ, 984, 185, doi: 10.3847/1538-4357/adc68d
2025 doi
-
[45]
Sukhbold, T., & Woosley, S. E. 2014, The Astrophysical Journal, 783, 10, doi: 10.1088/0004-637X/783/1/10
2014 doi
-
[46]
E., & Heger, A
Sukhbold, T., Woosley, S. E., & Heger, A. 2018, The Astrophysical Journal, 860, 93, doi: 10.3847/1538-4357/aac2da
2018 doi
-
[47]
2014, The Astrophysical Journal, 794, 162, doi: 10.1088/0004-637X/794/2/162
Takahashi, K., & Yamada, S. 2014, The Astrophysical Journal, 794, 162, doi: 10.1088/0004-637X/794/2/162
2014 doi
-
[48]
1996, The Astrophysical Journal, 460, 408, doi: 10.1086/176980
Thielemann, F.-K., Nomoto, K., & Hashimoto, M.-A. 1996, The Astrophysical Journal, 460, 408, doi: 10.1086/176980
1996 doi
-
[49]
Vartanyan, D., Coleman, M. S. B., & Burrows, A. 2022, Monthly Notices of the Royal Astronomical Society, 510, 4689, doi: 10.1093/mnras/stab3702
2022 doi
-
[50]
Vartanyan, D., Tsang, B. T. H., Kasen, D., et al. 2025, ApJ, 982, 9, doi: 10.3847/1538-4357/adb1e4
2025 doi
-
[51]
2004, NewAR, 48, 61, doi: 10.1016/j.newar.2003.11.008
Vink, J. 2004, NewAR, 48, 61, doi: 10.1016/j.newar.2003.11.008
2004 doi
-
[52]
S., & Bleeker, J
Vink, J., Kaastra, J. S., & Bleeker, J. A. M. 1996, Astronomy and Astrophysics, 307, L41
1996
-
[53]
Wang, T., Vartanyan, D., Burrows, A., & Coleman, M. S. B. 2022, Monthly Notices of the Royal Astronomical Society, 517, 543, doi: 10.1093/mnras/stac2691
2022 doi
-
[54]
2017, The Astrophysical Journal, 842, 13, doi: 10.3847/1538-4357/aa72de
Wongwathanarat, A., Janka, H.-T., M¨ uller, E., Pllumbi, E., & Wanajo, S. 2017, The Astrophysical Journal, 842, 13, doi: 10.3847/1538-4357/aa72de
2017 doi
-
[55]
E., Heger, A., & Weaver, T
Woosley, S. E., Heger, A., & Weaver, T. A. 2002, Reviews of Modern Physics, 74, 1015, doi: 10.1103/RevModPhys.74.1015
2002 doi
-
[56]
E., & Weaver, T
Woosley, S. E., & Weaver, T. A. 1995, The The Astrophysical Journal Supplement, 101, 181, doi: 10.1086/192237
1995 doi
-
[57]
T., Melson, T., & Heger, A
Yadav, N., M¨ uller, B., Janka, H. T., Melson, T., & Heger, A. 2020, The Astrophysical Journal, 890, 94, doi: 10.3847/1538-4357/ab66bb
2020 doi
-
[58]
G., Ho, W
Yakovlev, D. G., Ho, W. C. G., Shternin, P. S., Heinke, C. O., & Potekhin, A. Y. 2011, Monthly Notices of the Royal Astronomical Society, 411, 1977, doi: 10.1111/j.1365-2966.2010.17827.x
2011
-
[59]
2016, Physical Review D, 93, 123012, doi: 10.1103/PhysRevD.93.123012
Yoshida, T., Takahashi, K., Umeda, H., & Ishidoshiro, K. 2016, Physical Review D, 93, 123012, doi: 10.1103/PhysRevD.93.123012
2016 doi
-
[60]
R., et al
Yoshida, T., Takiwaki, T., Aguilera-Dena, D. R., et al. 2021, Monthly Notices of the Royal Astronomical Society, 506, L20, doi: 10.1093/mnrasl/slab067
2021 doi
-
[61]
2019, The Astrophysical Journal, 881, 16, doi: 10.3847/1538-4357/ab2b9d
Yoshida, T., Takiwaki, T., Kotake, K., et al. 2019, The Astrophysical Journal, 881, 16, doi: 10.3847/1538-4357/ab2b9d
2019 doi
-
[62]
A., Fryer, C
Young, P. A., Fryer, C. L., Hungerford, A., et al. 2006, The Astrophysical Journal, 640, 891, doi: 10.1086/500108
2006 doi
Reviewed August 6, 2026 · model on record in the stance chip above.
Discussion (0). Continue with ORCID to comment.