REVIEW 3 major objections 5 minor 49 references
Investigating Direct Manipulation of Graphical Encodings as a Method for User Interaction
T0 review · 3 major / 5 minor · reviewed 2026-08-14 · deepseek-v4-flash
Pith's one-line read A qualitative study of ten users produces the first empirical catalog of 48 direct-manipulation strategies for charts, organized into four user approaches.
desk verdict A genuinely useful first catalog of direct-manipulation strategies, with a real caveat: the 'selection' category was suggested, not enacted, and the paper's 'employ' language overstates the evidence. read the letter →
The pith
A machine-rendered reading of the paper's core claim, the machinery that carries it, and where it could break.
The reading
What carries the argument
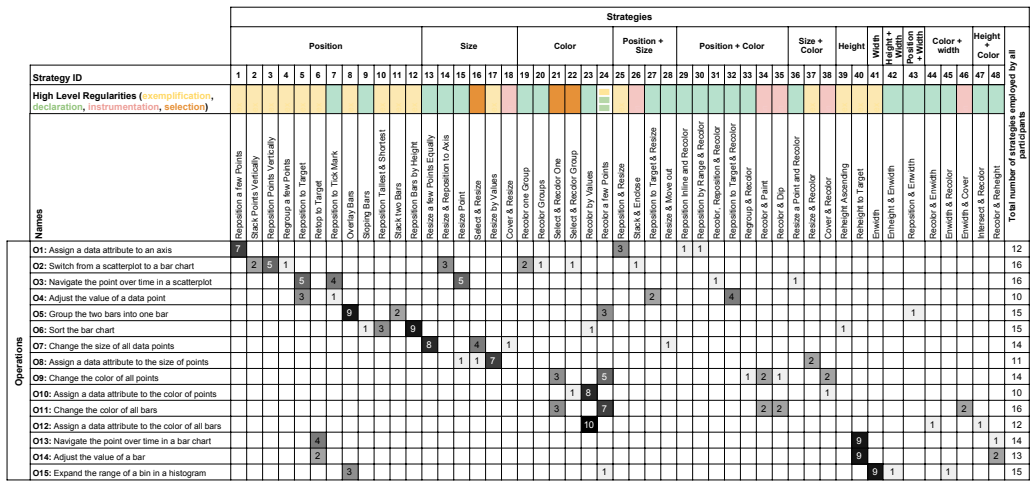
The machinery is the 'intended strategy' as the defined unit of analysis: an expression of intent that a participant performed physically and/or explained verbally. Because the study prototype let participants manipulate position, size, color, height, and width but did not react to those actions, the coders could capture unrevised behavior, including verbally described strategies for interactions the prototype did not support (notably selection). Two coders used open coding on the screen recordings to extract 203 intended strategies, clustered them into 48 named archetypal strategies, and laid them out in a matrix with the 15 operations. That matrix does the argument's work: it shows which strategies have consensus, which conflict across operations, and how the four high-level approaches (exemplification, declaration, instrumentation, selection) emerge from comparing rows and columns.
What would settle it
Conduct the same 15 operations in a follow-up study with a prototype that supports selection and the other suggested strategies; if new participants rarely or never choose Select & Resize and Select & Recolor when selection is available, or choose different gestures than the ones earlier participants described verbally, then the selection category and the verbal portion of the 48-strategy list would lose their empirical grounding.
Extended reading notes
Core claim
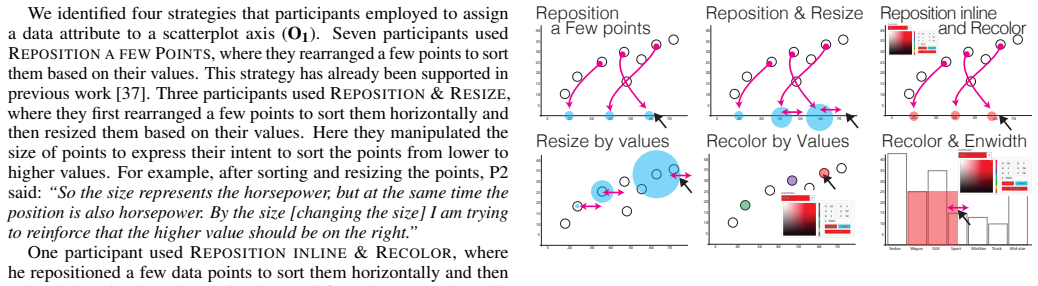
The paper's central claim is empirical and descriptive: people have recognizable, recurring ways of manipulating graphical encodings to express visualization operations, and those ways can be inventoried. The inventory was built from a qualitative study in which 10 participants performed 15 operations on a scatterplot, a bar chart, and a histogram; coding of 298 minutes of video produced 203 intended strategies, grouped into 48 mutually exclusive archetypal strategies. For 10 of the 15 operations, a single strategy accounted for more than half of the participants' attempts, showing consensus; for others, such as switching from a scatterplot to a bar chart, participants spread across eight strategies with no clear winner. The same strategy could serve different operations (recoloring a few marks in the same color was used to group bars, to change all marks, and to expand a histogram bin), and the authors use this strategy-operation matrix to derive four high-level approaches: exemplification, declaration, instrumentation, and selection. On the paper's telling, this is the first list of its kind, offered as a framework for further empirical work rather than as a finished generalization.
Load-bearing premise
The load-bearing premise is that what participants said they would do when the prototype lacked a feature (especially selection) matches what they would actually do if that feature existed; if that mismatch is large, the verbally reported strategies are not empirical observations.
Editorial extensions
If this is right
- Designers can adopt the consensus strategies, such as repositioning bars by height to sort and widening a bar to expand a histogram bin, as default direct-manipulation mappings.
- For operations with no consensus, such as switching a scatterplot to a bar chart, tools should support several strategies or offer a menu of candidate operations after a gesture.
- Because the same strategy can express different operations, direct-manipulation systems need a disambiguation step, such as recommending possible operations for the user to confirm.
- The four high-level approaches give designers a vocabulary for choosing an interaction style: show an example, declare intent through another encoding, use a mark as an instrument, or select first and then act.
- The number of marks involved can guide the choice of approach, since participants preferred instrumentation and selection for many marks and simple exemplification for one or two marks.
Reading between the lines
- An implication the authors leave implicit is that the taxonomy could serve as the label space for recognizing intent from low-level manipulation traces; a classifier trained on the 48 archetypes could predict the operation a user is performing, with consensus strategies likely easier to recognize than conflicting ones.
- A testable extension is a Wizard-of-Oz comparison where the system reacts in real time, to see whether feedback shortens or changes the strategies people use, since the current prototype deliberately does not react to actions.
- The conflict between strategies suggests that ambiguity itself is a design resource: instead of forcing one canonical gesture, a direct-manipulation tool could treat the moment after a gesture as a lightweight disambiguation dialogue, which would also collect preference data.
- A further extension would test the matrix across other chart types, such as line charts or treemaps, to see whether the four approaches are stable or whether encodings like angle or area introduce new strategies.
Signed reviews
Editorial analysis
A structured set of objections, weighed in public.
Referee Report
Summary. The paper reports a qualitative study in which 10 participants performed 15 visualization operations on scatterplots, bar charts, and histograms using direct manipulation of graphical encodings in a purpose-built prototype. From 203 coded 'intended strategies,' the authors derive 48 archetypal strategies, analyze which strategies are consensual or conflicting across operations, and propose four high-level approaches: exemplification, declaration, instrumentation, and selection. They use these results to derive design implications for future direct-manipulation visualization tools. The central claim is that this constitutes 'the first list of strategies, sometimes consensual and sometimes conflicting, that people employ to perform operations using direct manipulation of graphical encodings.'
Significance. If the descriptive claim holds, the paper makes a useful empirical contribution: it provides a catalog of user-generated strategies and a taxonomy that can ground design decisions for direct-manipulation interactions, where prior work largely relied on designer intuition. The study is carefully conducted in several respects: video-based open coding, saturation checking after 10 participants, two coders, and online availability of datasets, software, and strategy sketches. The distinction between consensual and conflicting strategies and the discussion of design trade-offs are valuable for researchers and practitioners. However, the strength of the contribution depends on the empirical grounding of the strategy catalog, and that grounding needs to be tightened with respect to verbally proposed versus physically enacted strategies, as discussed below.
major comments (3)
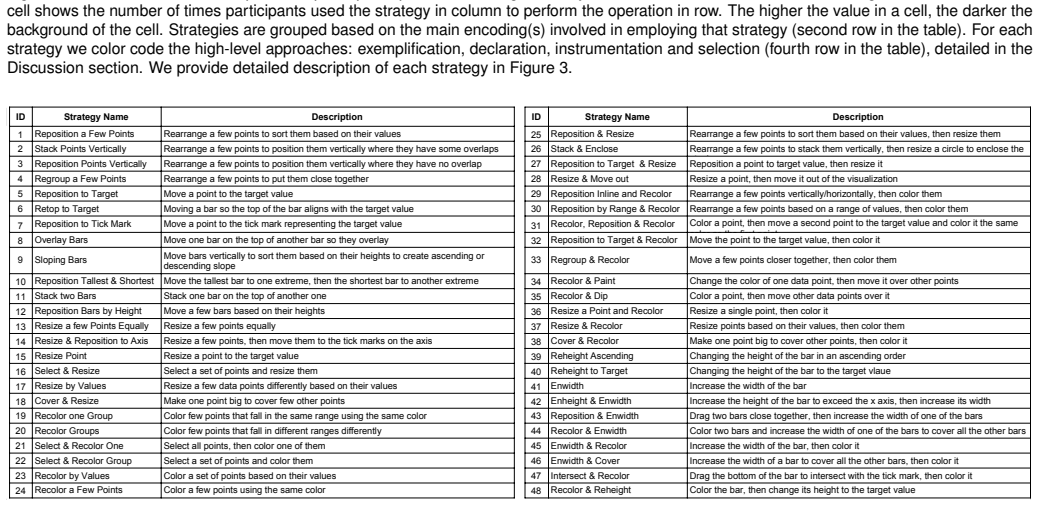
- [§4.7, §4.4, §6.3, §7] The unit of analysis defined in §4.7 ('an intention that a participant performed physically and/or explained verbally') makes hypothetical verbal descriptions methodologically equivalent to enacted actions. Since §4.4 states that the prototype does not support selection, the selection strategies (e.g., Select & Resize, strategy 16; Select & Recolor One, strategy 21; Select & Recolor Group, strategy 22) were only ever verbal suggestions, as §6.3 concedes ('verbally because selection was not supported in the prototype'). The conclusion (§7) nevertheless claims 'the first list of strategies ... that people employ.' This conflation inflates the empirical catalog and makes the selection category, one of the four high-level approaches, not grounded in enacted behavior. I request that the paper report enacted and verbally proposed strategies separately, qualify the conclusion accordingly, and either remove selection from the observed taxonomy or re-label it as a desired interaction technique rather than an empirically observed strategy.
- [§4.7] Coding reliability is reported only as one coder coding all videos and a second coder confirming two randomly selected videos; no agreement statistic or disagreement count is given. Because the 48 archetypal strategies and the counts in Figure 2 are the paper's primary empirical output, the absence of systematic reliability evidence weakens the descriptive claim. Please report per-category agreement (e.g., Cohen's kappa or percentage agreement) or have both coders independently code a larger sample, and report resolved disagreements.
- [§6.1] The 'consensus' statements are based on small counts (e.g., 10 of 12 in O12, 9 of 15 in O15), and 'two thirds of the operations (10/15)' is computed from these small per-operation samples. With 10 participants and multiple strategies per participant, a single strategy appearing in more than half of the elicited strategies does not establish a stable consensus. Please present raw counts with per-participant breakdowns and soften the 'consensus' language, or frame these as descriptive tendencies that require a larger follow-up before being used as design priorities.
minor comments (5)
- [Figure 2] The 'High Level Regularities' row in Figure 2 is difficult to read in the manuscript; please provide a clear legend for the color coding of exemplification, declaration, instrumentation, and selection, ideally with the strategy names visible.
- [Figure 3] In the description of strategy 40, 'vlaue' should be 'value'.
- [§5 and online materials] The text says 'We provide raw sketches ... in supplemental materials,' but the online repository is only given as a footnote; please include a stable URL or DOI in the references.
- [§6.3] In the Exemplification paragraph, the reference 'Rows 1-6 in Figure 2' is confusing because rows are operations, not strategies; please refer explicitly to operation rows or strategy columns.
- [§6.5 and §7] Section 6.5 acknowledges that limited prototype functionality likely impacted strategies and that future work should add selection support; this caveat should be reflected in the abstract and conclusion, not only in the limitations subsection.
Circularity Check
No significant circularity: the empirical catalog and taxonomy are derived from participant observations, not from the paper's own prior results.
full rationale
The paper's derivation chain is empirical rather than formal. The 15 operations (Table 1) are gathered from prior systems as study stimuli, including some authored by the present authors, but they are inputs to the study, not predictions derived from it. The 48 strategies are induced from 203 coded 'intended strategies' observed in screen-capture videos (Section 4.7), and the four high-level categories (exemplification, declaration, instrumentation, selection) are presented in Section 6.3 as an organization of those observed strategies. Self-citations such as [37] and [39] appear only as comparison points (e.g., 'like in previous work') or as sources for the operation list; no load-bearing conclusion reduces to a self-cited result. The main validity concern, that some strategies were verbally hypothetical because the prototype did not support selection, is explicitly acknowledged in Section 6.5 as a limitation of prototype functionality. That is a threat to empirical generalizability, not a circularity of the kind where a prediction or derivation is equivalent to its inputs. No equation, fitted parameter, or definition makes the conclusion true by construction. Therefore the paper is self-contained against its empirical data and earns a circularity score of 0.
Assumptions & free parameters
assumptions (4)
- domain assumption Think-aloud verbalizations and observed manipulations are valid expressions of users' intended strategies.
- ad hoc to paper The 15 operations sampled from prior work are representative of visualization operations users want to invoke.
- domain assumption Empirical saturation was reached with ten participants.
- domain assumption Strategies expressed verbally for unsupported features (e.g., selection) predict behavior in systems that support them.
Cite this review
Pith. "Pith review of Investigating Direct Manipulation of Graphical Encodings as a Method for User Interaction." pith.science (2026). https://pith.science/paper/BOCTAFJS
@misc{pith2026190800679,
  author       = {Pith},
  title        = {Pith review of: Investigating Direct Manipulation of Graphical Encodings as a Method for User Interaction},
  year         = {2026},
  howpublished = {\url{https://pith.science/paper/BOCTAFJS}},
  note         = {Machine review of arXiv:1908.00679}
}
read the original abstract
We investigate direct manipulation of graphical encodings as a method for interacting with visualizations. There is an increasing interest in developing visualization tools that enable users to perform operations by directly manipulating graphical encodings rather than external widgets such as checkboxes and sliders. Designers of such tools must decide which direct manipulation operations should be supported, and identify how each operation can be invoked. However, we lack empirical guidelines for how people convey their intended operations using direct manipulation of graphical encodings. We address this issue by conducting a qualitative study that examines how participants perform 15 operations using direct manipulation of standard graphical encodings. From this study, we 1) identify a list of strategies people employ to perform each operation, 2) observe commonalities in strategies across operations, and 3) derive implications to help designers leverage direct manipulation of graphical encoding as a method for user interaction.
Figures

Figures from the paper (8 more)




Reference graph
Works this paper leans on
-
[1]
Tableau datasets, https://public.tableau.com/s/resources, 2015
work page 2015
-
[2]
S. K. Badam, A. Srinivasan, N. Elmqvist, and J. Stasko. Affordances of input modalities for visual data exploration in immersive environments. In 2nd Workshop on Immersive Analytics, 2017
work page 2017
-
[3]
T. Baudel. From information visualization to direct manipulation: Ex- tending a generic visualization framework for the interactive editing of large datasets. In Proceedings of the 19th Annual ACM Symposium on User Interface Software and Technology, UIST ’06, pp. 67–76. ACM, New York, NY , USA, 2006
work page 2006
-
[4]
Beaudouin-Lafon
M. Beaudouin-Lafon. Instrumental interaction: an interaction model for designing post-wimp user interfaces. In Proceedings of the SIGCHI conference on Human Factors in Computing Systems, pp. 446–453. ACM, 2000
2000
-
[5]
Bostock, V
M. Bostock, V . Ogievetsky, and J. Heer. D 3: Data-driven documents. IEEE Trans. Visualization & Comp. Graphics, 17(12):2301–2309, 2011
2011
-
[6]
J. Boy, R. A. Rensink, E. Bertini, and J.-D. Fekete. A principled way of assessing visualization literacy. IEEE Transactions on Visualization & Computer Graphics, 20(12):1963–1972, 2014
work page 1963
-
[7]
F. Chevalier, P. Dragicevic, and C. Hurter. Histomages: fully synchronized views for image editing. In Proceedings of the 25th annual ACM sym- posium on User interface software and technology, pp. 281–286. ACM, 2012
work page 2012
-
[8]
J. W. Creswell. Qualitative inquiry and research design: Choosing among five tradition, 1998
work page 1998
Show all 49 references
-
[9]
J. W. Creswell. Educational research: Planning, conducting, and evaluat- ing quantitative. Prentice Hall Upper Saddle River, NJ, 2002
2002
-
[10]
desJardins, J
M. desJardins, J. MacGlashan, and J. Ferraioli. Interactive visual cluster- ing. In Proceedings of the 12th International Conference on Intelligent User Interfaces, IUI ’07, pp. 361–364. ACM, New York, NY , USA, 2007
2007
-
[11]
B. T. Eli, J. Liu, C. E. Brodley, and R. Chang. Dis-function: Learning distance functions interactively. In 2012 IEEE Conference on Visual Analytics Science and Technology (VAST), pp. 83–92, Oct 2012
2012
-
[12]
Elmqvist, A
N. Elmqvist, A. Vande Moere, H.-C. Jetter, D. Cernea, H. Reiterer, and T. J. Jankun-Kelly. Fluid interaction for information visualization. Information Visualization, 10(4):327–340, Oct. 2011
2011
-
[13]
Endert, P
A. Endert, P. Fiaux, and C. North. Semantic interaction for visual text analytics. In Proceedings of the SIGCHI Conference on Human Factors in Computing Systems, CHI ’12, pp. 473–482. ACM, New York, NY , USA,
-
[14]
S. Few. Now you see it: simple visualization techniques for quantitative analysis. Analytics Press, 2009
2009
-
[15]
H. V . Henderson and P. F. Velleman. Building multiple regression models interactively. Biometrics, pp. 391–411, 1981
1981
-
[16]
Huron, Y
S. Huron, Y . Jansen, and S. Carpendale. Constructing visual represen- tations: Investigating the use of tangible tokens. IEEE Transactions on Visualization and Computer Graphics, 20(12):2102–2111, Dec 2014
2014
-
[17]
E. L. Hutchins, J. D. Hollan, and D. A. Norman. Direct manipulation interfaces. Human–Computer Interaction, 1(4):311–338, 1985
1985
-
[18]
H. Kim, J. Choo, H. Park, and A. Endert. Interaxis: Steering scatterplot axes via observation-level interaction. IEEE transactions on visualization and computer graphics, 22(1):131–140, 2016
2016
-
[19]
N. W. Kim, E. Schweickart, Z. Liu, M. Dontcheva, W. Li, J. Popovic, and H. Pfister. Data-Driven Guides: Supporting Expressive Design for Information Graphics. IEEE Transactions on Visualization and Computer Graphics, 23(1):491–500, Jan 2017. doi: 10.1109/TVCG.2016.2598620
2017
-
[20]
Kondo and C
B. Kondo and C. Collins. Dimpvis: Exploring time-varying information visualizations by direct manipulation. IEEE Transactions on Visualization and Computer Graphics, 20(12):2003–2012, Dec 2014
2003
-
[21]
B. c. Kwon, W. Javed, N. Elmqvist, and J. S. Yi. Direct manipulation through surrogate objects. In Proceedings of the SIGCHI Conference on Human Factors in Computing Systems, CHI ’11, pp. 627–636. ACM, New York, NY , USA, 2011
2011
-
[22]
B. Lee, P. Isenberg, N. H. Riche, and S. Carpendale. Beyond mouse and keyboard: Expanding design considerations for information visualization interactions. IEEE Transactions on Visualization and Computer Graphics, 18(12):2689–2698, Dec. 2012
2012
-
[23]
Z. Liu, J. Thompson, A. Wilson, M. Dontcheva, J. Delorey, S. Grigg, B. Kerr, and J. Stasko. Data Illustrator: Augmenting Vector Design Tools with Lazy Data Binding for Expressive Visualization Authoring. In Proceedings of the 2018 CHI Conference on Human Factors in Computing S...
2018
-
[24]
Maulsby and I
D. Maulsby and I. H. Witten. Watch what i do. chap. Metamouse: An Instructible Agent for Programming by Demonstration, pp. 155–181. MIT Press, Cambridge, MA, USA, 1993
1993
-
[25]
M ´endez, J
G. M ´endez, J. Walny, S. Knudsen, C. Perin, S. Huron, J. Vermeulen, R. Pusch, and S. Carpendale. Reconstructor: A scalable constructive visualization tool, 2019. arXiv preprint
2019
-
[26]
G. G. M´endez, M. A. Nacenta, and S. Vandenheste. iV oLVER: Interactive Visual Language for Visualization Extraction and Reconstruction. In Proceedings of the CHI Conference on Human Factors in Computing Systems, CHI ’16, pp. 4073–4085. ACM, New York, NY , USA, 2016
2016
-
[27]
J. M. Morse. Determining sample size, 2000
2000
-
[28]
C. Perin. Direct Manipulation for Information Visualization. PhD thesis, Paris 11, 2014
2014
-
[29]
Perin and P
C. Perin and P. Dragicevic. Manipulating multiple sliders by crossing. In Proceedings of the 26th Conference on L’Interaction Homme-Machine, IHM ’14, pp. 48–54. ACM, New York, NY , USA, 2014
2014
-
[30]
Perin, P
C. Perin, P. Dragicevic, and J. D. Fekete. Revisiting bertin matrices: New interactions for crafting tabular visualizations. IEEE Transactions on Visualization and Computer Graphics, 20(12):2082–2091, Dec 2014
2014
-
[31]
Perin, R
C. Perin, R. Vuillemot, and J.-D. Fekete. A table!: Improving temporal navigation in soccer ranking tables. In Proceedings of the 32Nd Annual ACM Conference on Human Factors in Computing Systems, CHI ’14, pp. 887–896. ACM, New York, NY , USA, 2014
2014
-
[32]
D. Ren, H. Tobias, and X. Yuan. ivisdesigner: Expressive interactive design of information visualizations. IEEE Transactions on Visualization and Computer Graphics, 20(12):2092–2101, Dec 2014
2014
-
[33]
N. H. Riche, B. Lee, and C. Plaisant. Understanding interactive legends: a comparative evaluation with standard widgets. In Computer graphics forum, vol. 29, pp. 1193–1202. Wiley Online Library, 2010
2010
-
[34]
Saket and A
B. Saket and A. Endert. Demonstrational interaction for data visualization. IEEE Computer Graphics and Applications, 39(3):67–72, May 2019. doi: 10.1109/MCG.2019.2903711
2019
-
[35]
Saket and A
B. Saket and A. Endert. Investigating the manual view specification and visualization by demonstration paradigms for visualization construction. Computer Graphics Forum, 2019. doi: 10.1111/cgf.13718
2019 doi
-
[36]
Saket, L
B. Saket, L. Jiang, C. Perin, and A. Endert. Liger: Combining interaction paradigms for visual analysis, 2019. arXiv preprint 1907.08345
2019 arXiv
-
[37]
Saket, H
B. Saket, H. Kim, E. T. Brown, and A. Endert. Visualization by demon- stration: An interaction paradigm for visual data exploration. IEEE Trans- actions on Visualization and Computer Graphics , 23(1):331–340, Jan 2017
2017
-
[38]
Saket, A
B. Saket, A. Srinivasan, E. D. Ragan, and A. Endert. Evaluating inter- active graphical encodings for data visualization. IEEE Transactions on Visualization and Computer Graphics, 24(3):1316–1330, 2018
2018
-
[39]
Sarvghad, B
A. Sarvghad, B. Saket, A. Endert, and N. Weibel. Embedded merge amp; split: Visual adjustment of data grouping. IEEE Transactions on Visualization and Computer Graphics, 25(1):800–809, Jan 2019
2019
-
[40]
Setlur, S
V . Setlur, S. E. Battersby, M. Tory, R. Gossweiler, and A. X. Chang. Eviza: A natural language interface for visual analysis. In Proceedings of the 29th Annual Symposium on User Interface Software and Technology, UIST ’16, pp. 365–377. ACM, New York, NY , USA, 2016
2016
-
[41]
Shneiderman
B. Shneiderman. Direct manipulation: a step beyond programming lan- guages. Sparks of innovation in human-computer interaction, 17:1993, 1993
1993
-
[42]
Siirtola
H. Siirtola. Interaction with the reorderable matrix. In In International Conference on Information Visualization (Cat. No. PR00210), pp. 272– 277, 1999
1999
-
[43]
R. S. Torres, C. G. Silva, C. B. Medeiros, and H. V . Rocha. Visual structures for image browsing. In Proceedings of the twelfth international conference on Information and knowledge management, pp. 49–55. ACM, 2003
2003
-
[44]
Vuillemot and C
R. Vuillemot and C. Perin. Investigating the direct manipulation of ranking tables for time navigation. In Proceedings of the 33rd Annual ACM Conference on Human Factors in Computing Systems, CHI ’15, pp. 2703–
-
[45]
Vuillemot and C
R. Vuillemot and C. Perin. Sports tournament predictions using direct manipulation. IEEE Computer Graphics and Applications, 36(5):62–71, Sept 2016. doi: 10.1109/MCG.2016.90
2016 doi
-
[46]
E. Wall, S. Das, R. Chawla, B. Kalidindi, E. T. Brown, and A. Endert. Podium: Ranking data using mixed-initiative visual analytics. IEEE Transactions on Visualization and Computer Graphics, 24(1):288–297, Jan 2018
2018
-
[47]
Wenskovitch, I
J. Wenskovitch, I. Crandell, N. Ramakrishnan, L. House, S. Leman, and C. North. Towards a systematic combination of dimension reduction and clustering in visual analytics. IEEE Transactions on Visualization and Computer Graphics, 24(1):131–141, Jan 2018
2018
-
[2012]
doi: 10.1145/2207676.2207741
-
[2706]
doi: 10.1145/2702123.2702237
ACM, New York, NY , USA, 2015. doi: 10.1145/2702123.2702237
2015
Reviewed August 14, 2026 · model on record in the stance chip above.
Discussion (0). Continue with ORCID to comment.