REVIEW 3 major objections 6 minor 36 references
Mobility restrictions for the control of epidemics: When do they work?
T0 review · 3 major / 6 minor · reviewed 2026-08-14 · deepseek-v4-flash
Pith's one-line read This paper claims that unrestricted mobility from a high-risk to a low-risk community can reduce overall epidemic size, while a cordon sanitaire can increase it.
desk verdict A clearly argued extension of prior work showing when mobility controls backfire, but the headline claim rests on an unflagged assumption that infected people stay as mobile as healthy ones, and the SI is missing. read the letter →
The pith
A machine-rendered reading of the paper's core claim, the machinery that carries it, and where it could break.
The reading
What carries the argument
The central object is a Lagrangian residency-time matrix P = (p_ij), where p_ij is the constant average fraction of time a resident of community i spends in community j, with i, j ∈ {1, 2}. This matrix converts two coupled communities into a single integrated epidemic system. Disease risk is summarized by community-specific basic reproduction numbers R01 > 1 and R02 < 1, and the global basic reproduction number R0(P) is computed using the next-generation matrix method. Two emergent thresholds carry the argument: t1^- (the HRC mobility level needed to push total final size below the cordon sanitaire baseline) and t1^+ (the HRC mobility level needed to make R0(P) = 1). The mechanism is that moving infectious people from high-transmission, resource-poor settings to low-transmission, resource-rich settings reduces the average number of secondary cases per infected person, shifting infections into the LRC while reducing the combined total.
What would settle it
The claim would be falsified by an observed epidemic in two neighboring communities with R01 ≈ 2.45 and R02 ≈ 0.9 in which the total final number of cases under unrestricted mobility from the high-risk to the low-risk community is larger than the total under a full cordon sanitaire, contrary to the predicted threshold behavior.
Extended reading notes
Core claim
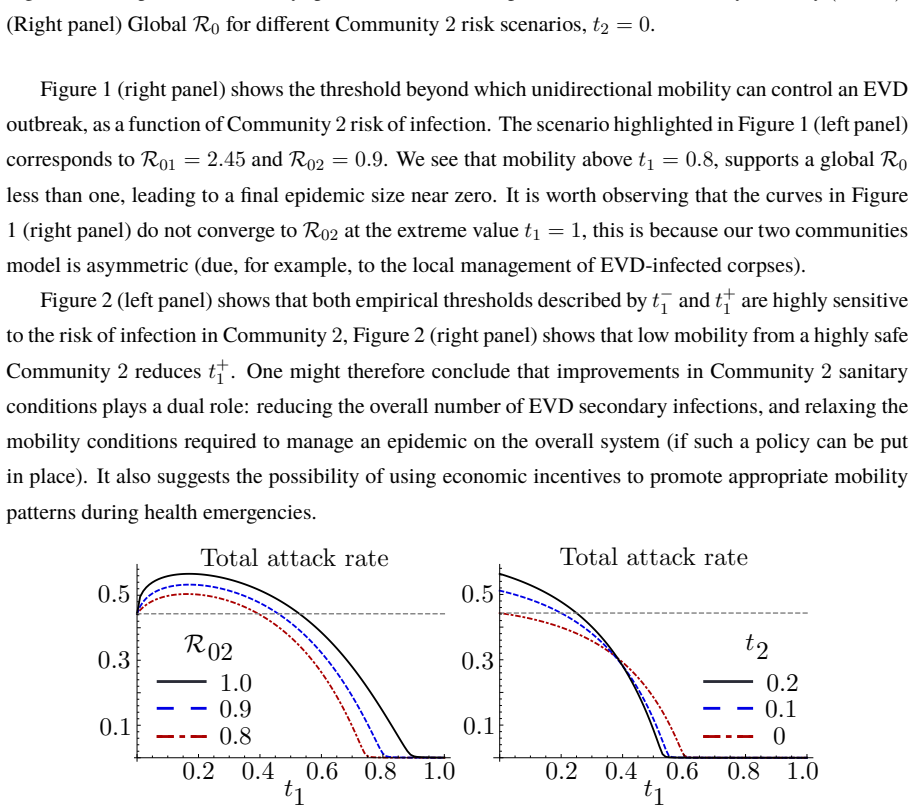
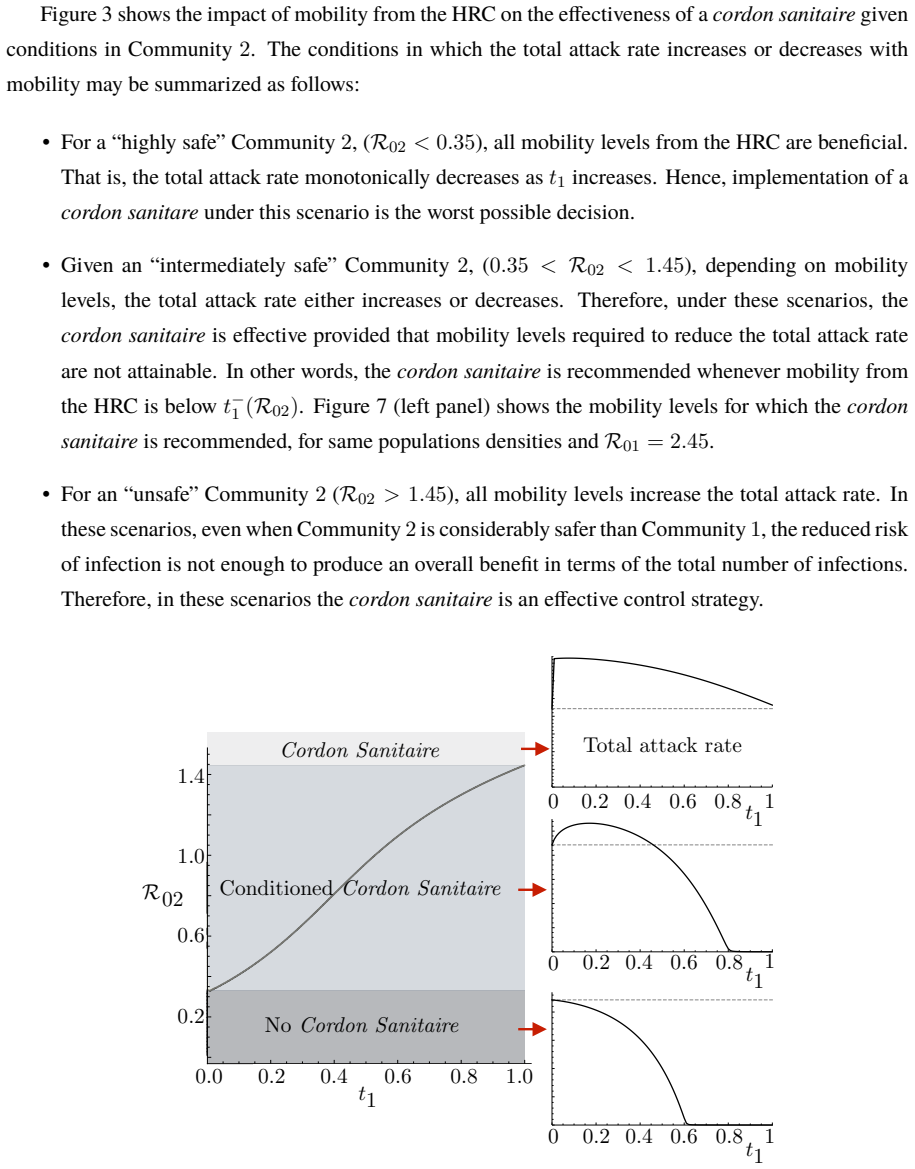
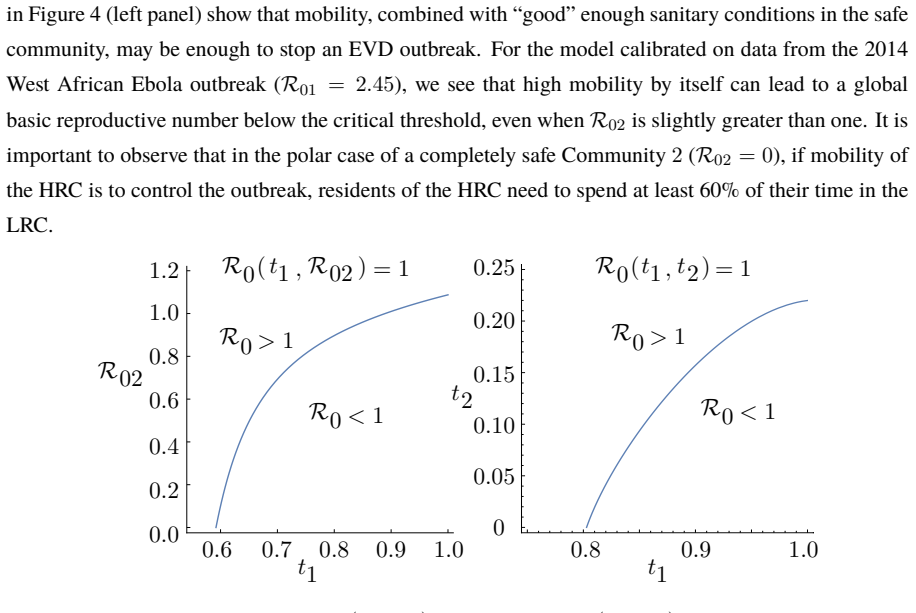
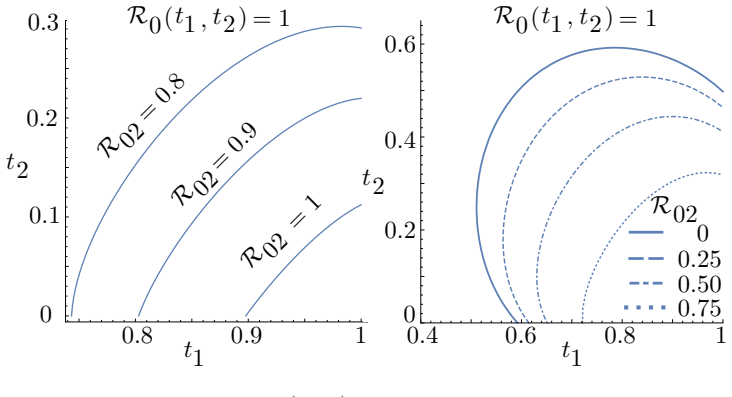
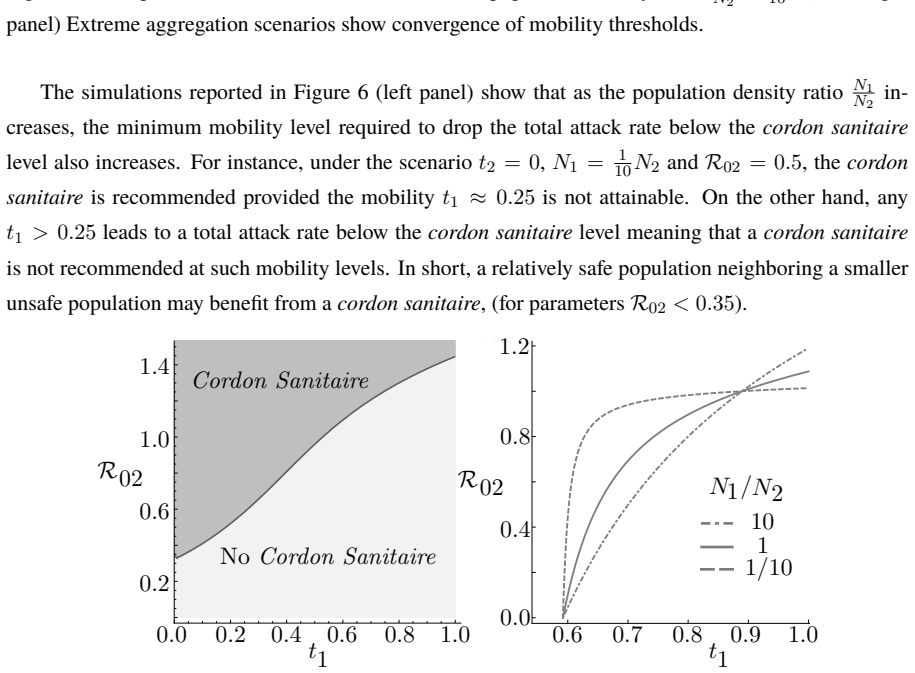
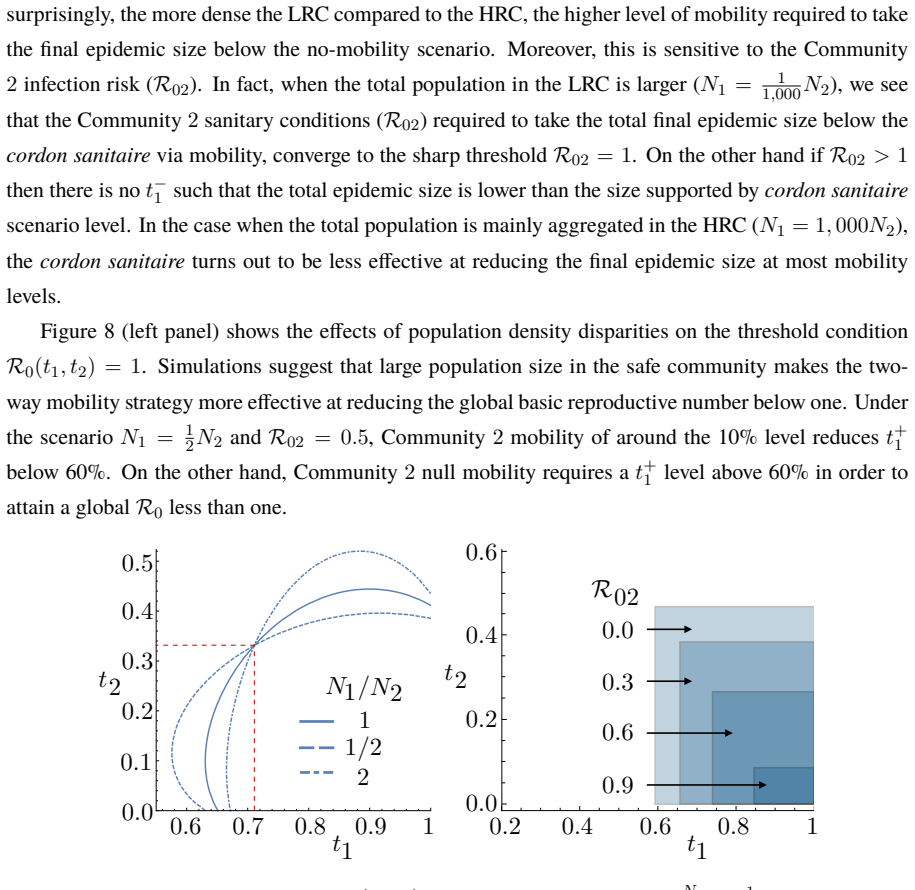
For an epidemic centered in a high-risk community (HRC) with local basic reproduction number R01 > 1, the total final epidemic size is a non-monotonic function of mobility from the HRC to a low-risk community (LRC). With one-way mobility (t2 = 0), low mobility levels (t1 < 0.45) raise the total final size above the cordon sanitaire baseline, moderate mobility (t1 > 0.45) lowers it below that baseline, and high mobility (t1 > 0.8) can drive the global basic reproduction number R0(P) below one, ending the outbreak even when the LRC's local R02 is slightly greater than one. Conversely, mobility from the LRC into the HRC can undo this benefit: when R02 ≈ 0.9 and t2 rises above about 0.23, no amount of HRC mobility can bring the global R0 below one. The thresholds depend on the risk levels in each community and on their relative population densities, with a very safe LRC (R02 < 0.35) making any HRC mobility beneficial and an unsafe LRC (R02 > 1.45) making the cordon sanitaire the better strategy.
Load-bearing premise
The model assumes the fraction of time each resident spends in the other community is constant and identical for everyone, including infected and infectious residents; if sick people stop traveling once they feel ill, the mechanism that makes open borders reduce total cases weakens or disappears.
Editorial extensions
If this is right
- When one-way mobility from the high-risk to the low-risk community is high enough, the global basic reproduction number can fall below one, meaning an ongoing outbreak is driven to extinction without any mobility ban.
- A cordon sanitaire is beneficial only within specific risk windows: it helps when the low-risk community is unsafe (R02 > 1.45) but is the worst possible policy when the low-risk community is very safe (R02 < 0.35).
- Mobility from the low-risk community into the high-risk community can cancel the benefit of HRC mobility, so travel advisories need to account for two-way movement, not just outflow from the outbreak zone.
- Relative population density shifts the mobility thresholds: a larger high-risk population relative to the low-risk population lowers the mobility level needed for disease control, while a larger low-risk population raises it.
- If the low-risk community's healthcare or sanitary conditions improve, the mobility threshold needed to control the outbreak falls, implying that investments in the safer community can substitute for movement restrictions.
Reading between the lines
- If policy is set by each community independently, the cordon sanitaire remains locally attractive because it protects the low-risk community's own residents, even when it is globally harmful; a formal game-theoretic extension would likely predict over-restriction unless incentives are aligned.
- The mechanism depends on infected, symptomatic people continuing to travel at the same rate as healthy people; behavioral data on sick individuals reducing travel would require lowering the mobility thresholds or could invalidate the control result in practice.
- The same residency-time framework could be turned into a real-time decision tool: if local R0 values can be estimated from surveillance data during an outbreak, the thresholds t1^- and t1^+ give an immediate criterion for whether to relax or tighten travel restrictions.
- Because the results hold for a range of disease types and depend only on risk differentials and density ratios, the qualitative conclusion that open mobility can outperform quarantine is likely to extend to other pathogens with similar transmission routes, though the specific thresholds would need recalibration.
Signed reviews
Editorial analysis
A structured set of objections, weighed in public.
Referee Report
Summary. The paper develops a two-community epidemic model with a Lagrangian mobility formulation, in which individuals from a high-risk community (HRC) and a low-risk community (LRC) spend fixed proportions of time in each community. The model is calibrated to the 2014 West African EVD outbreak (R01 = 2.45) and used to compare final epidemic sizes under a cordon sanitaire (no mobility) versus various levels of one-way or two-way mobility. The central claims are that unrestricted one-way mobility from the HRC to the LRC can reduce the total final epidemic size below the cordon-sanitaire baseline when the LRC is sufficiently safe, and that sufficiently high mobility from the HRC can bring the global basic reproductive number R0(P) below one, thereby controlling the outbreak. The paper also identifies two mobility thresholds, t1- (mobility level that outperforms the cordon sanitaire) and t1+ (mobility level that drives R0 below one), and examines how these thresholds depend on the LRC risk level R02, the LRC mobility t2, and the population density ratio N1/N2. The conclusions are framed as general insights for when mobility restrictions are beneficial or harmful.
Significance. If the main results hold, they would provide a formal counterexample to the conventional view that restricting mobility from a high-risk to a low-risk community reduces overall epidemic burden, and they would offer an explanation for the observed counterproductive effects of cordons sanitaires in some outbreaks. The paper's use of a residence-time (Lagrangian) framework is a useful alternative to Eulerian metapopulation models, and the explicit thresholds t1- and t1+ are falsifiable predictions that can be tested with parameter estimates. However, the central quantitative claims rest on assumptions that are currently not verifiable from the preprint: the model equations, R0 derivation, and final-size formulas are relegated to an omitted SI appendix, and the main control result assumes that infected individuals remain as mobile as healthy individuals, an assumption that is not flagged or tested. The internal consistency of one stated result (R0<1 despite R02>1) is also questionable. The paper has merit as a conceptual contribution, but the strength of the conclusions currently exceeds what the available evidence supports.
major comments (3)
- [Section 2] The residency-time matrix P = (p_ij) is assumed to be constant over time and identical for all residents, with no distinction between susceptible and infected individuals. The main control result, including the threshold t1+ ≈ 0.8 reported in Section 3.1 and the abstract's claim that high mobility can control an outbreak, depends on infected and infectious HRC residents spending up to 80% of their time in the LRC. For EVD, symptomatic patients are typically bedridden, hospitalized, or isolated, so their realized mobility is far below that of healthy residents. The paper never flags this dependence, and the abstract states the conclusion without this qualifier. This assumption is load-bearing: if infected individuals are even modestly less mobile than healthy ones, the export-of-cases mechanism weakens and t1+ may become unattainable. Please either relax this assumption in the model or provide a sensitivity analysis showing that the qualitative results persist when infected individuals have reduced mobility, and state the assumption explicitly in the abstract and conclusions.
- [Section 2] The manuscript states that 'Detailed model formulation, computation of the community-specific and global basic reproductive numbers obtained using the next generation approach, as well as community-specific and global final epidemic size, can be found in the SI appendix.' However, the SI appendix is not included in the arXiv version. Consequently, the equations defining R0(P), the final-size formulas, and the numerical thresholds in Figures 1–8 cannot be independently checked. For a modeling paper in which all quantitative conclusions flow from these derivations, this is a central omission. The model equations and the R0 derivation must be included in the main text or a complete supplement must be provided with the submission.
- [Section 4] The statement that 'high mobility by itself can lead to a global basic reproductive number below the critical threshold, even when R02 is slightly greater than one' is inconsistent with the model assumption in Section 2 that Community 2 is unable to support an outbreak in isolation (R02 < 1). Moreover, for a nonnegative next-generation matrix, the spectral radius (the global R0) is at least the spectral radius of each diagonal block, so if R02 > 1, the global R0 cannot be less than one regardless of mobility. This claim is either a typographical error (perhaps 'slightly less than one' was intended) or it indicates a problem with the R0 computation in the SI. Please correct the statement and check the level curves in Figures 4 and 5 against this bound.
minor comments (6)
- [Section 1] The introduction states that 'our results hold for a range of disease types,' but all quantitative results use EVD parameters only. Please either provide an additional disease example or soften this claim.
- [Section 3.1] The thresholds t1- and t1+ are defined in the text, but the notation is introduced after the phrase 'two empirical thresholds' in a way that may be confusing. Consider defining t1- and t1+ explicitly before the first use in the description of Figure 1.
- [Figure 1] In the left panel of Figure 1, the threshold values t1 ≈ 0.45 and t1 ≈ 0.8 are described in the text but are not marked on the figure. Adding vertical dashed lines at these values would improve readability.
- [Figure 4] The left panel of Figure 4 has y-axis labels that appear to contain numerical values such as '0.0234192' instead of R02 values, which makes the level curve difficult to interpret. Please regenerate the figure with clear axis labels.
- [Section 3.3] In the discussion of Figure 7, the text refers to 'same populations densities' and 'identical populations densities' in the caption, but the figure description is not fully legible. Please ensure the figure caption specifies the population density ratio clearly.
- [General] There are inconsistencies in the use of subscripts for t1 and t2 (e.g., t−1 vs. t1−). Please use consistent notation throughout.
Circularity Check
No significant circularity: the model outputs are computed from stated epidemiological assumptions, and the self-citations provide context rather than load-bearing support.
full rationale
The paper's conclusions are not equivalent to its inputs by construction. R01 = 2.45 is imported from published EVD estimates ([16,32,33]), while R02, population-density ratios, and the mobility parameters are assigned or scanned; the reported thresholds t1- and t1+ and the final epidemic sizes are computed from an SIR-type model through next-generation and final-size formulas (described as detailed in the SI), not fitted to those outputs. The Lagrangian residency-time framework is attributed to the authors' prior work ([30,22,31]), and the sharp-threshold statement does cite [30], but the framework itself is also explicitly stated in Section 2 (the matrix P = (p_ij) with p_ij >= 0 assumed constant over time), so the citations are contextual rather than load-bearing. There is no self-definitional construction in which an input is defined in terms of the target result, no fitted parameter is renamed as a prediction, and no uniqueness theorem is imported from the authors' prior work. The assumptions that residency times are identical across disease states and that detailed formulas are confined to the omitted SI affect realism and verifiability, not circularity. Therefore no circular step is identified and the score is 0.
Assumptions & free parameters
free parameters (2)
- R02 (basic reproduction number in low-risk community) =
varied from 0 to >1.45; baseline 0.9
- population density ratio N1/N2 =
k = 1/1000, 1/10, 1/2, 1, 2, 10, 1000
assumptions (5)
- domain assumption The two communities are well-mixed populations with constant residency-time fractions p_ij.
- domain assumption In the absence of mobility, Community 1 sustains an epidemic (R01 > 1) and Community 2 does not (R02 < 1).
- domain assumption R01 = 2.45 from West African EVD outbreak estimates.
- standard math Next-generation matrix method for R0 and standard final-size relations are valid for this model.
- domain assumption One-way mobility baseline t2=0 in Section 3.1.
Cite this review
Pith. "Pith review of Mobility restrictions for the control of epidemics: When do they work?." pith.science (2026). https://pith.science/paper/BQJSFSR3
@misc{pith2026190805261,
  author       = {Pith},
  title        = {Pith review of: Mobility restrictions for the control of epidemics: When do they work?},
  year         = {2026},
  howpublished = {\url{https://pith.science/paper/BQJSFSR3}},
  note         = {Machine review of arXiv:1908.05261}
}
read the original abstract
Mobility restrictions - travel advisories, trade and travel bans, border closures and, in extreme cases, area quarantines or cordons sanitaires - are among the most widely used measures to control infectious diseases. Restrictions of this kind were important in the response to epidemics of SARS (2003), H1N1 influenza (2009), and Ebola (2014). However, they do not always work as expected. The imposition of a cordon sanitaire to control the 2014 West African Ebola outbreak, for example, is argued to have led to a higher-than-expected number of cases in the quarantined area. To determine when mobility restrictions reduce the size of an epidemic, we use a model of disease transmission within and between economically heterogeneous locally connected communities. One community comprises a low-risk, resource-rich, low-density population with access to effective medical resources. The other comprises a high-risk, resource-poor, high-density population without access to effective medical resources. We find that the overall size of an epidemic centered in the high-risk community is sensitive to the stringency of mobility restrictions between the two communities. Unrestricted mobility between the two risk communities increases the number of secondary cases in the low-risk community but reduces the overall epidemic size. By contrast, the imposition of a cordon sanitaire around the high-risk community reduces the number of secondary infections in the low-risk community but increases the overall epidemic size. The degree to which mobility restrictions increase or decrease the overall epidemic size depends on the level of risk in each community and the characteristics of the disease.
Figures

Figures from the paper (5 more)

Reference graph
Works this paper leans on
-
[1]
Proceedings of the National Academy of Sciences, 101(42):15124–15129, 2004
LarsHufnagel,DirkBrockmann,andTheoGeisel.Forecastandcontrolofepidemicsinaglobalized world. Proceedings of the National Academy of Sciences, 101(42):15124–15129, 2004
work page 2004
-
[2]
Skip the trip: Air travelers’ behavioral responses to pandemic influenza.PloS one, 8(3):e58249, 2013
Eli P Fenichel, Nicolai V Kuminoff, and Gerardo Chowell. Skip the trip: Air travelers’ behavioral responses to pandemic influenza.PloS one, 8(3):e58249, 2013
work page 2013
-
[3]
Merg- ing economics and epidemiology to improve the prediction and management of infectious disease
Charles Perrings, Carlos Castillo-Chavez, Gerardo Chowell, Peter Daszak, Eli P Fenichel, David Finnoff, Richard D Horan, A Marm Kilpatrick, Ann P Kinzig, Nicolai V Kuminoff, et al. Merg- ing economics and epidemiology to improve the prediction and management of infectious disease. EcoHealth, 11(4):464–475, 2014
work page 2014
-
[4]
Some further consideration of the plague in eyam, 1665/6.Local population studies, 54:56–57, 1995
Philip Race. Some further consideration of the plague in eyam, 1665/6.Local population studies, 54:56–57, 1995. Page 11 / 13
work page 1995
-
[5]
Adreadfulheritage: interpretingepidemicdiseaseateyam,1666–2000
PatrickWallis. Adreadfulheritage: interpretingepidemicdiseaseateyam,1666–2000. In History Workshop Journal, volume 61, pages 31–56. Oxford University Press, 2006
work page 2000
-
[6]
A short history of yellow fever in the us.Bob Arnebeck, 2008
Bob Arnebeck. A short history of yellow fever in the us.Bob Arnebeck, 2008
work page 2008
-
[7]
Encyclopediaofplagueandpestilence: fromancienttimestothepresent
GeorgeCKohn. Encyclopediaofplagueandpestilence: fromancienttimestothepresent . Infobase Publishing, 2007
work page 2007
-
[8]
Publichealthandethicalconsiderationsinplanningforquar- antine
MartinCetronandJuliusLandwirth. Publichealthandethicalconsiderationsinplanningforquar- antine. The Yale journal of biology and medicine, 78(5):329, 2005
work page 2005
Show all 36 references
-
[9]
R. K. Hoffmann et.al. Ethical considerations in the use of cordons sanitaires, 2018
2018
-
[10]
McNeil Jr.NYT: Using a Tactic Unseen in a Century, Countries Cordon Off Ebola- Racked Areas, August 12, 2014
Donald G. McNeil Jr.NYT: Using a Tactic Unseen in a Century, Countries Cordon Off Ebola- Racked Areas, August 12, 2014
2014
-
[11]
Lessonsfromthehistoryofquarantine,fromplaguetoinfluenza a, 2018
CentersforDiseaseControlCDC. Lessonsfromthehistoryofquarantine,fromplaguetoinfluenza a, 2018
2018
-
[12]
New jersey releases nurse quarantined in ebola scare, 2018
Ashley Fantz CNN. New jersey releases nurse quarantined in ebola scare, 2018
2018
-
[13]
Ebola outbreaks in nigeria, senegal, appear contained: Cdc reports, 2018
Julie Steenhuysen. Ebola outbreaks in nigeria, senegal, appear contained: Cdc reports, 2018
2018
-
[14]
As ebola grips liberia’s capital, a quarantine sows social chaos, August 2014
Norimitsu Onishi. As ebola grips liberia’s capital, a quarantine sows social chaos, August 2014
2014
-
[15]
Springer, 2013
R Davis.The Spanish flu: narrative and cultural identity in Spain, 1918. Springer, 2013
1918
-
[16]
Temporal variations in the effective reproduction number of the 2014 west africa ebola outbreak.PLoS currents, 6, 2014
Sherry Towers, Oscar Patterson-Lomba, and Carlos Castillo-Chavez. Temporal variations in the effective reproduction number of the 2014 west africa ebola outbreak.PLoS currents, 6, 2014
2014
-
[17]
2014-2016 ebola outbreak in west africa, 2018
Centers for Disease Control CDC. 2014-2016 ebola outbreak in west africa, 2018
2014
-
[18]
Proposal for a revised taxonomy of the family filoviridae: classification, names of taxa and viruses, and virus abbreviations
Jens H Kuhn, Stephan Becker, Hideki Ebihara, Thomas W Geisbert, Karl M Johnson, Yoshihiro Kawaoka, W Ian Lipkin, Ana I Negredo, Sergey V Netesov, Stuart T Nichol, et al. Proposal for a revised taxonomy of the family filoviridae: classification, names of taxa and viruses, and vir...
2010
-
[19]
Genomicsurveil- lance elucidates ebola virus origin and transmission during the 2014 outbreak.science, page 1259657, 2014
StephenKGire,AugustineGoba,KristianGAndersen,RachelSGSealfon,DanielJPark,Lansana Kanneh, SimbirieJalloh, MambuMomoh, MohamedFullah, GytisDudas, etal. Genomicsurveil- lance elucidates ebola virus origin and transmission during the 2014 outbreak.science, page 1259657, 2014
2014
-
[20]
Ebola-hit african states seal off outbreak epicentre, 2018
Agence France-Presse. Ebola-hit african states seal off outbreak epicentre, 2018
2018
-
[21]
Quarantining an entire liberian slum to fight ebola is a recipe for disaster, 2018
Amesh Adalja. Quarantining an entire liberian slum to fight ebola is a recipe for disaster, 2018
2018
-
[22]
Assessing the efficiency of movement restriction as a control strategy of ebola
Baltazar Espinoza, Victor Moreno, Derdei Bichara, and Carlos Castillo-Chavez. Assessing the efficiency of movement restriction as a control strategy of ebola. InMathematical and Statistical Modeling for Emerging and Re-emerging Infectious Diseases, pages 123–145. Springer, 2016
2016
-
[23]
P Galvani
A.Pandey, K.EAtkins, J.Medlock, N.Wenzel, J.PTownsend, ChildsJ.E,T.G.Nyenswah, M.L Ndeffo-Mba, and A. P Galvani. Strategies for containing ebola in west africa, 2014. Page 12 / 13
2014
-
[24]
Epidemic modeling in metapopulation systems with heterogeneous coupling pattern: Theory and simulations
Vittoria Colizza and Alessandro Vespignani. Epidemic modeling in metapopulation systems with heterogeneous coupling pattern: Theory and simulations. Journal of theoretical biology, 251(3):450–467, 2008
2008
-
[25]
Quarantine in a multi-species epidemic model with spatial dynamics.Mathematical biosciences, 206(1):46–60, 2007
Julien Arino, Richard Jordan, and P Van den Driessche. Quarantine in a multi-species epidemic model with spatial dynamics.Mathematical biosciences, 206(1):46–60, 2007
2007
-
[26]
Controlling pandemic flu: the value of international air travel restrictions
Joshua M Epstein, D Michael Goedecke, Feng Yu, Robert J Morris, Diane K Wagener, and Georgiy V Bobashev. Controlling pandemic flu: the value of international air travel restrictions. PloS one, 2(5):e401, 2007
2007
-
[27]
Human mobility networks, travel restrictions, and the global spread of 2009 h1n1 pandemic
Paolo Bajardi, Chiara Poletto, Jose J Ramasco, Michele Tizzoni, Vittoria Colizza, and Alessandro Vespignani. Human mobility networks, travel restrictions, and the global spread of 2009 h1n1 pandemic. PloS one, 6(1):e16591, 2011
2009
-
[28]
Assess- ingtheimpactoftravelrestrictionsoninternationalspreadofthe2014westafricanebolaepidemic
Chiara Poletto, Marcelo FC Gomes, Ana Pastore y Piontti, Luca Rossi, Livio Bioglio, Dennis L Chao,IraMLongini,MElizabethHalloran,VittoriaColizza,andAlessandroVespignani. Assess- ingtheimpactoftravelrestrictionsoninternationalspreadofthe2014westafricanebolaepidemic. Euro survei...
2014
-
[29]
Assessing the international spreading risk associated with the 2014 west african ebola outbreak.PLoS currents, 6, 2014
Marcelo FC Gomes, Ana Pastore y Piontti, Luca Rossi, Dennis Chao, Ira Longini, M Elizabeth Halloran, and Alessandro Vespignani. Assessing the international spreading risk associated with the 2014 west african ebola outbreak.PLoS currents, 6, 2014
2014
-
[30]
Sis and sir epidemic models under virtual dispersal.The Bulletin of Mathematical Biology, DOI: 10.1007/s11538-015-0113-5, 2015
Derdei Bichara, Yun Kang, Carlos Castillo-Chavez, Richard Horan, and Charles Perrings. Sis and sir epidemic models under virtual dispersal.The Bulletin of Mathematical Biology, DOI: 10.1007/s11538-015-0113-5, 2015
2015 doi
-
[31]
Perspectives on the role of mo- bility, behavior, and time scales in the spread of diseases.Proceedings of the National Academy of Sciences, 113(51):14582–14588, 2016
Carlos Castillo-Chavez, Derdei Bichara, and Benjamin R Morin. Perspectives on the role of mo- bility, behavior, and time scales in the spread of diseases.Proceedings of the National Academy of Sciences, 113(51):14582–14588, 2016
2016
-
[32]
Transmission dynamics and control of ebola virus disease (evd): a review.BMC medicine, 12(1):196, 2014
Gerardo Chowell and Hiroshi Nishiura. Transmission dynamics and control of ebola virus disease (evd): a review.BMC medicine, 12(1):196, 2014
2014
-
[33]
Estimating the reproduction number of ebola virus (ebov) during the 2014 outbreak in west africa.PLoS currents, 6, 2014
Christian L Althaus. Estimating the reproduction number of ebola virus (ebov) during the 2014 outbreak in west africa.PLoS currents, 6, 2014
2014
-
[34]
Diekmann, J
O. Diekmann, J. A. P. Heesterbeek, and J. A. J. Metz. On the definition and the computation of the basic reproduction ratioR0 in models for infectious diseases in heterogeneous populations.J. Math. Biol., 28(4):365–382, 1990
1990
-
[35]
reproductionnumbersandsub-thresholdendemicequilibria for compartmental models of disease transmission.Math
P.vandenDriesscheandJ.Watmough. reproductionnumbersandsub-thresholdendemicequilibria for compartmental models of disease transmission.Math. Biosci., 180:29–48, 2002
2002
-
[36]
Wells, Abhishek Pandey, Alyssa S
Chad R. Wells, Abhishek Pandey, Alyssa S. Parpia, Meagan C. Fitzpatrick, Burton H. Singer, and Alison P. Galvani. Ebola vaccination in the democratic republic of congo (in press).Proceedings of the National Academy of Sciences, 2019. Page 13 / 13
2019
Reviewed August 14, 2026 · model on record in the stance chip above.
Discussion (0). Continue with ORCID to comment.