REVIEW 4 major objections 6 minor 49 references
Dynamics and connectivity of an extended arch filament system
T0 review · 4 major / 6 minor · reviewed 2026-08-14 · deepseek-v4-flash
Pith's one-line read This paper identifies an extended arch filament system that ties moving magnetic features of a decaying sunspot to opposite-polarity quiet-Sun network flux and shows footpoint downflows rising from about 10 to 23 km/s in 30 minutes.
desk verdict A careful multi-wavelength case study of an unusual arch filament system connecting a decaying sunspot's moving magnetic features to quiet-Sun network flux; the main quantitative claim (footpoint downflows increasing from ~10 to ~23 km/s) rests on a single hand-picked pixel, so treat the trend as suggestive rather than established. read the letter →
The pith
A machine-rendered reading of the paper's core claim, the machinery that carries it, and where it could break.
The reading
What carries the argument
The central object is the extended arch filament system, a bundle of dark chromospheric threads in Hα absorption that connect opposite magnetic polarities. The paper’s classification rests on comparing it with the classical arch filament system: here the footpoints are moving magnetic features around a decaying sunspot and quiet-Sun network flux, not emerging pores. The measurement that carries the argument is pixel-by-pixel Doppler mapping: a second-order polynomial fit to the Hα and near-infrared Ca II line cores yields line-of-sight velocities, and the temporal increase of the redshift at the southern footpoint is the central result. Context from photospheric magnetograms establishes the polarities at the two footpoints and the slow decrease of the southern footpoint flux, while EUV images place the migrating brightening in time.
What would settle it
A direct test is a multi-hour high-sensitivity spectropolarimetric observation of the same type of system: if the southern footpoint polarity is not negative, or if the downflow does not grow from about 10 to 23 km s$^{-1}$ and no second component appears, the central interpretation would be refuted. A simpler statistical check is to survey decaying sunspots with photospheric magnetograms and Hα filtergrams to see whether such extended AFS configurations are frequent and whether their footpoint downflows always strengthen with time.
Extended reading notes
Core claim
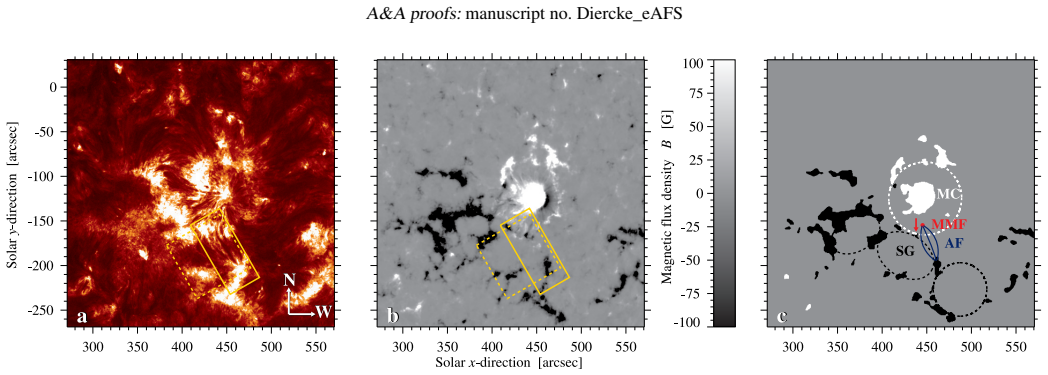
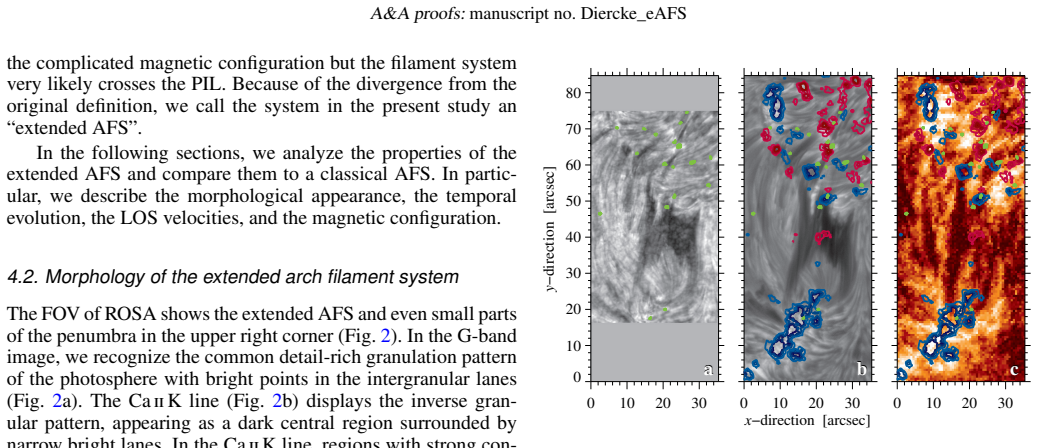
On 2013 January 20 the filament system near active region 11658 was seen to bridge positive-polarity moving magnetic features just outside the sunspot penumbra and negative-polarity network flux along a supergranule border. This is not a classical arch filament system, which forms above an emerging flux region and connects two opposite-polarity pores with no link to the surrounding network, so the authors call it an extended arch filament system. It measures roughly 25–30 Mm in length and 20 Mm in width, with individual threads about 3 Mm wide, and the system persisted for several days while individual arch filaments lived more than an hour. Doppler maps from line-core fits to Hα and near-infrared Ca II show upflows at the loop tops that decay over time, while downflows at the southern footpoint increase from $(9.8\pm 0.6)$ km s$^{-1}$ to $(22.8\pm 0.6)$ km s$^{-1}$ over 30 minutes, exceeding the chromospheric sound speed; the northern footpoint stays slower and weaker. An EUV brightening appeared at 17:20 UT in one newly formed arch filament and moved from the northern to the southern footpoint, and shortly afterward strong redshifts and a second spectral component appeared at the southern footpoint, which the authors interpret as plasma draining downward from a rising loop.
Load-bearing premise
The interpretation assumes that the dark Hα and Ca II threads are magnetic loops connecting the specific positive-polarity moving magnetic features to the negative-polarity network flux at the southern footpoint; the paper itself states that the Ca II Stokes-V maps cannot definitively define a clear polarity inversion line, so the connectivity rests on photospheric magnetograms and structure morphology.
Editorial extensions
If this is right
- Sunspot magnetic flux carried away as moving magnetic features can connect to quiet-Sun network flux through an arch filament system, so network flux growth at supergranule borders can be a direct product of sunspot decay.
- Footpoint downflows in such systems can double in 30 minutes and pass the chromospheric sound speed, so velocity maps need two-component spectral analysis rather than single line-core fits.
- Downflow asymmetry between the two footpoints can grow rapidly, rather than being strongest at the birth of the system as reported for young arch filaments.
- Hβ can stand in for Hα as a blue-wavelength tracer of chromospheric filamentary structure, though individual threads are less clearly resolved.
- A system classified as an arch filament system can exist in a region of decreasing rather than emerging flux, with the southern footpoint losing flux at about $2.8\times10^{18}$ Mx h$^{-1}$.
Reading between the lines
- If this configuration is common around decaying sunspots, the brightenings and drainages seen here may be small-scale flux-cancellation events that quietly transfer active-region flux into the network; the paper does not quantify the global rate, so this is an extrapolation.
- The second spectral component, estimated near 48 km s$^{-1}$ in Hα and appearing about 5 minutes later in Ca II, could be resolved with denser wavelength sampling to test whether it is a separate draining plasma blob or a line-core fitting artifact.
- A longer time series should show the downflows eventually relaxing after the activation, as seen in other arch filament studies; only the increasing phase was captured here.
- The same multi-line Doppler method could be applied to other decaying sunspots to test whether a growing downflow asymmetry between footpoints is a generic signature of flux transfer from a sunspot to the network.
Signed reviews
Editorial analysis
A structured set of objections, weighed in public.
Referee Report
Summary. The paper presents a multi-instrument observational study of a filament system observed on 2013 January 20 with the Dunn Solar Telescope (ROSA and IBIS) and SDO/AIA/HMI. The authors classify the system as an 'extended arch filament system' connecting moving magnetic features (MMFs) around a decaying sunspot to opposite-polarity network flux along a supergranular border. They derive LOS velocities from Hα and NIR Ca II line-core fits, finding upflows at loop tops and downflows at footpoints, with the southern footpoint downflow increasing from about 9.8 to 22.8 km/s in 30 minutes and a developing second spectral component. They also report an EUV brightening migrating from the northern to southern footpoint, flux decrease at the southern footpoint, and compare properties with classical AFSs.
Significance. If the interpretation is correct, the paper extends AFS classification to decaying sunspot environments and demonstrates a possible pathway for sunspot flux transport to the quiet-Sun network. The study is carefully reduced: the data reduction and calibration are described in detail, per-pixel uncertainty maps are provided (99th percentile 1.8 km/s for Hα, 1.1 km/s for NIR Ca II), and limitations (noisy Stokes-V, sparse wavelength sampling for the second component, short time series) are explicitly acknowledged. The comparison with classical AFS literature is quantitative and useful. The main advance is the observation of a strongly asymmetric, accelerating downflow at one footpoint during a 30-minute activation, but this claim currently rests on a measurement procedure that needs to be made more robust.
major comments (4)
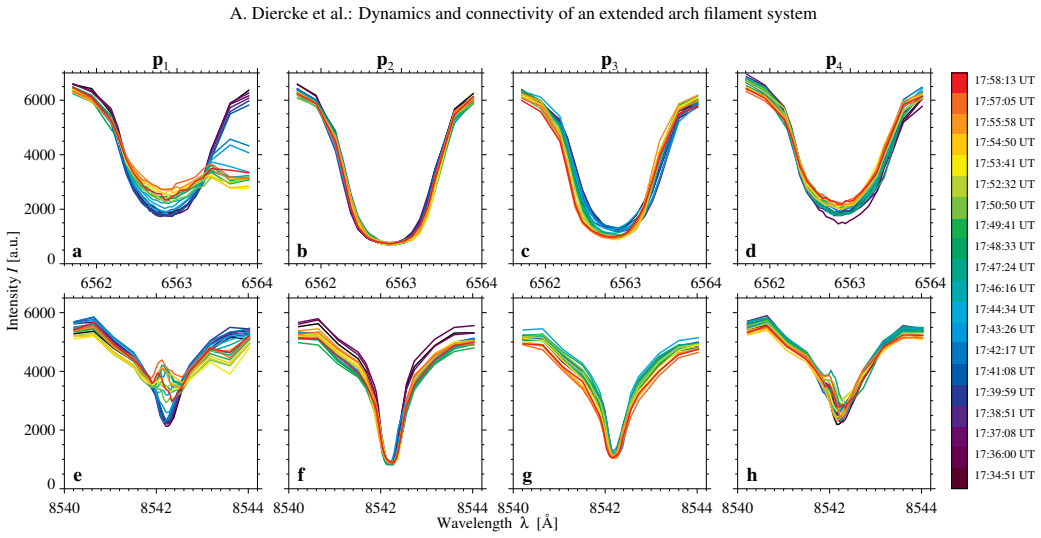
- [Sect. 4.5, Figs. 9 and 10] The central quantitative claim that Hα downflows at the southern footpoint increase from (9.8±0.6) to (22.8±0.6) km s−1 is based on single-line-core fits in a region where the spectral profiles develop a second red component (Fig. 10a, point p1). The increasing redshift of the single-line-core fit can be driven by the growth of the second component (roughly estimated at 48 km s−1) rather than by an acceleration of the main plasma component. Please perform a two-component fit (e.g., two Gaussians) to separate the components and show whether the first-component velocity genuinely increases, or report spatially averaged velocities over a fixed aperture that excludes the second-component pixels. Without such a test, the physical interpretation of an accelerating downflow is not yet established.
- [Sect. 4.5, Fig. 9] The procedure for extracting the quoted maximum velocities is not specified. The velocity maps are clipped at ±7.5 km s−1, and the text refers to 'maximum velocities' without stating whether these are the global maximum over the footpoint region, the value at the fixed point p1, or the maximum in the saturated area. The paper should define the aperture/pixel used, and provide a time series of robust statistics (e.g., median or 95th percentile within a fixed footpoint box) to demonstrate that the increase is not a single-pixel extreme-value effect. The growing area of the saturated region alone does not bias the global maximum, but the lack of a clear measurement definition and the presence of second-component pixels make the quoted peak values difficult to interpret.
- [Sect. 3.3] The reported uncertainties on the maximum velocities (e.g., ±0.6 km s−1) are formal line-core-fit uncertainties. The authors state that changing the number of wavelength points by ±1 changes the derived velocities by 10% (Hα) and 12% (NIR Ca II); this systematic term is larger than the quoted error bars at the reported velocities (e.g., roughly 1–2.3 km s−1 for 10–23 km s−1). Please include the systematic uncertainty in the quoted values or give a separate estimate, and propagate it into the discussion of whether the 13 km s−1 increase is significant. Also clarify the relationship between the per-pixel uncertainty maps (99th percentile 1.79 km s−1) and the peak-value uncertainties.
- [Sect. 4.1] The classification as an 'extended AFS' and the paper's connectivity claim depend on the assertion that the observed Hα/Ca II structures are loops connecting positive-polarity MMFs near the sunspot with negative-polarity network flux at the southern footpoint. The paper itself notes that the NIR Ca II Stokes-V maps are 'not suitable to definitively define a clear polarity inversion line' (Sect. 4.1), and the footpoint regions contain mixed polarities. Please strengthen the connectivity evidence, for example by tracking the MMFs and footpoint polarities in the HMI time series, checking whether the EUV loops in AIA 171/193 connect the same footpoints, or performing a simple potential-field extrapolation. At minimum, discuss the alternative that the dark structure is a filament lying along a PIL rather than a loop system connecting the specific opposite-polarity patches.
minor comments (6)
- [Sect. 4.5] The statement 'The number of poor fits is 0.01%' is hard to reconcile with the many pixels marked by black contours as having two components; please define what constitutes a poor fit and state whether line-core fits were still performed in the two-component regions.
- [Sect. 4.5, Fig. 9] Consider showing the unclipped velocity values in the saturated regions using a different color scale or contours, so that the peak values are visually summarized.
- [Sect. 5] When stating that 'the up- and downflow velocities exceed the sound speed in the chromosphere,' please state the adopted sound speed and note that the measured velocities are LOS projections.
- [Sect. 6] There is a typo 'unusal' for 'unusual'; also 'Nontheless' appears in Sect. 5.
- [Sect. 4.5] The caution about a prominent shoulder in the red wing is stated for NIR Ca II but applies equally to Hα; please make this explicit.
- [Table 1] The row 'Footpoints' is ambiguous ('footpoints drifting apart' vs 'MMFs move toward other footpoint'); please clarify the intended comparison.
Circularity Check
No significant circularity: the observational claims are derived from calibrated measurements and external comparisons, not from their own definitions or fits.
full rationale
This is a purely observational case study with no parametric model or fitted quantity that is later relabeled as a prediction. The central claims—that the filament system connects MMFs around a decaying sunspot to opposite-polarity network flux and that H-alpha downflows at the southern footpoint increase from about 9.8 to 22.8 km/s—are supported by direct measurements: line-core fitting calibrated to the FTS atlas and laboratory rest wavelengths, HMI magnetograms, AIA context images, and multi-instrument morphology. The 'extended AFS' label is explicitly introduced as a descriptive classification based on deviation from the classical AFS definition, not used as an input to derive the velocities or connectivity. Comparisons with classical AFS properties rely on independent published values (e.g., Bruzek 1967, 1969; Gonzalez Manrique et al. 2018). Self-citations appear for data-reduction software (sTools, Kuckein et al. 2017; MFGS implementation, Denker et al. 2018) and prior AFS work by the same group, but none of these citations supplies the load-bearing evidence for the paper's conclusions; the cited software is a tool, and the cited AFS studies are external observational comparisons. The reported velocity increase is a measurement-robustness concern (single-pixel maximum, clipped maps, possible growth of the redshifted area) rather than a circularity: those concerns do not make the result equivalent to its inputs by construction. No equation in the paper reduces a derived quantity to a fitted or assumed quantity, and no uniqueness theorem or ansatz is imported from the authors' prior work to force the classification or the velocities. Accordingly, no specific circular step can be exhibited.
Assumptions & free parameters
free parameters (1)
- Line-core polynomial fit width =
0.72 Å (Hα), 0.24 Å (Ca II)
assumptions (3)
- standard math The rest wavelengths λ0=6562.81 Å (Hα) and λ0=8542.14 Å (Ca II) from Moore et al. (1966) convert line shifts to LOS velocities.
- domain assumption The Hα and Ca II line cores form in the chromosphere, and line-of-sight Doppler shifts trace the plasma motion of the arch filaments.
- domain assumption Averaged IBIS Stokes-V maps and HMI photospheric magnetograms can be compared across atmospheric layers to infer the magnetic connectivity of the filament footpoints.
Cite this review
Pith. "Pith review of Dynamics and connectivity of an extended arch filament system." pith.science (2026). https://pith.science/paper/C7N3DA2F
@misc{pith2026190801510,
  author       = {Pith},
  title        = {Pith review of: Dynamics and connectivity of an extended arch filament system},
  year         = {2026},
  howpublished = {\url{https://pith.science/paper/C7N3DA2F}},
  note         = {Machine review of arXiv:1908.01510}
}
abstract
In this study, we analyzed a filament system, which expanded between moving magnetic features (MMFs) of a decaying sunspot and opposite flux outside of the active region from the nearby quiet-Sun network. This configuration deviated from a classical arch filament system (AFS), which typically connects two pores in an emerging flux region. Thus, we called this system an extended AFS. We contrasted classical and extended AFSs with an emphasis on the complex magnetic structure of the latter. Furthermore, we examined the physical properties of the extended AFS and described its dynamics and connectivity. At the southern footpoint, we measured that the flux decreases over time. We find strong downflow velocities at the footpoints of the extended AFS, which increase in a time period of 30 minutes. The velocities are asymmetric at both footpoints with higher velocities at the southern footpoint. The extended AFS was observed with two instruments at the Dunn Solar Telescope (DST). The Rapid Oscillations in the Solar Atmosphere (ROSA) imager provided images in three different wavelength regions. The Interferometric Bidimensional Spectropolarimeter (IBIS) provided spectroscopic H$\alpha$ data and spectropolarimetric data that was obtained in the near-infrared Ca II 8542 \AA\ line. We used He II 304 \AA\ extreme ultraviolet images of the Atmospheric Imaging Assembly (AIA) and LOS magnetograms of the Helioseismic and Magnetic Imager (HMI) on board the Solar Dynamics Observatory (SDO) as context data.
Figures


Figures from the paper (8 more)






Reference graph
Works this paper leans on
- [1]
-
[2]
Bhatnagar, A. & Livingston, W. 2005, Fundamentals of Solar Astronomy, World Scientific Series in Astronomy and Astrophysics (Singapore: World Scien- tific)
work page 2005
-
[3]
Brault, J. W. 1985, in High Resolution in Astronomy, Fifteenth Advanced Course of the Swiss Society of Astronomy and Astrophysics. Edited by A.O. Benz, M. Huber, and M. Mayer. Geneva Observatory, Sauverny, Switzerland, 3–61
work page 1985
-
[4]
Bray, R. J. & Loughhead, R. E. 1974, The Solar Chromosphere (London, UK: Chapman and Hall)
work page 1974
- [5]
- [6]
-
[7]
Caligari, P., Moreno-Insertis, F., & Schussler, M. 1995, Astrophys. J., 441, 886
work page 1995
-
[8]
Cauzzi, G., Canfield, R. C., & Fisher, G. H. 1996, Astrophys. J., 456, 850
work page 1996
Show all 49 references
-
[9]
2006, Sol
Cavallini, F. 2006, Sol. Phys., 236, 415
2006
-
[10]
2005, Astrophys
Chae, J., Moon, Y .-J., & Park, Y .-D. 2005, Astrophys. J., 626, 574
2005
-
[11]
& Zirin, H
Chou, D.-Y . & Zirin, H. 1988, Astrophys. J., 333, 420
1988
-
[12]
T., et al
Couvidat, S., Schou, J., Hoeksema, J. T., et al. 2016, Sol. Phys., 291, 1887
2016
-
[13]
& Tritschler, A
Criscuoli, S. & Tritschler, A. 2014, IBIS Data Reduction Notes, National Solar Observatory (NSO), New Mexico, USA de la Cruz Rodríguez, J., Löfdahl, M. G., Sütterlin, P., Hillberg, T., & Rouppe van der V oort, L. 2015, Astron. Astrophys., 573, A40
2014
-
[14]
2015, Sol
Deng, H., Zhang, D., Wang, T., et al. 2015, Sol. Phys., 290, 1479
2015
-
[15]
2018, Sol
Denker, C., Dineva, E., Balthasar, H., et al. 2018, Sol. Phys., 293, 44
2018
-
[16]
2018, Astron
Diercke, A., Kuckein, C., Verma, M., & Denker, C. 2018, Astron. Astrophys., 611, A64 Druckmüller, M. 2013, ApJS, 207, 25
2018
-
[17]
1909, Mon
Evershed, J. 1909, Mon. Not. R. Astron. Soc., 69, 454
1909
-
[18]
Frazier, E. N. 1972, Sol. Phys., 26, 130
1972
-
[19]
Gonzalez, R. C. & Woods, R. E. 2002, Digital Image Processing (Upper Saddle
2002
-
[20]
J., Bello González, N., & Denker, C
River, New Jersey, USA: Prentice-Hall) González Manrique, S. J., Bello González, N., & Denker, C. 2017a, Astron. As- trophys., 600, A38 González Manrique, S. J., Denker, C., Kuckein, C., et al. 2017b, in IAU Sym- posium, V ol. 327, Fine Structure and Dynamics of the Solar Atmo...
2018
-
[21]
& Harvey, J
Harvey, K. & Harvey, J. 1973, Sol. Phys., 28, 61
1973
-
[22]
2007, Astron
Ishikawa, R., Tsuneta, S., Kitakoshi, Y ., et al. 2007, Astron. Astrophys., 472, 911
2007
-
[23]
B., Mathioudakis, M., Christian, D
Jess, D. B., Mathioudakis, M., Christian, D. J., et al. 2010, Sol. Phys., 261, 363
2010
-
[24]
G., Tritschler, A., Uitenbroek, H., et al
Judge, P. G., Tritschler, A., Uitenbroek, H., et al. 2010, Astrophys. J., 710, 1486
2010
-
[25]
2017, Astrophys
Kleint, L. 2017, Astrophys. J., 834, 26
2017
-
[26]
2009, Astron
Kuckein, C., Centeno, R., Martínez Pillet, V ., et al. 2009, Astron. Astrophys., 501, 1113
2009
-
[27]
2017, in IAU Symposium, V ol
Kuckein, C., Denker, C., Verma, M., et al. 2017, in IAU Symposium, V ol. 327, Fine Structure and Dynamics of the Solar Atmosphere, ed. S. Vargas Domínguez, A. G. Kosovichev, P. Antolin, & L. Harra, 20–24
2017
-
[28]
2012, Astron
Kuckein, C., Martínez Pillet, V ., & Centeno, R. 2012, Astron. Astrophys., 542, A112
2012
-
[29]
K., & Krupp, N
Lagg, A., Woch, J., Solanki, S. K., & Krupp, N. 2007, Astron. Astrophys., 462, 1147
2007
-
[30]
R., Title, A
Lemen, J. R., Title, A. M., Akin, D. J.and Boerner, P. F., et al. 2012, Sol. Phys., 275, 17 Löfdahl, M. G. 2002, in Proc. SPIE, V ol. 4792, Image Reconstruction from In- complete Data, ed. P. J. Bones, M. A. Fiddy, & R. P. Millane, 146–155 Löhner-Böttcher, J. 2016, PhD thesis,...
2012
-
[31]
2015, Astron
Ma, L., Zhou, W., Zhou, G., & Zhang, J. 2015, Astron. Astrophys., 583, A110
2015
-
[32]
H., Karpen, J
Mackay, D. H., Karpen, J. T., Ballester, J. L., Schmieder, B., & Aulanier, G. 2010, Space Sci. Rev., 151, 333
2010
-
[33]
Martin, S. F. 1998, Sol. Phys., 182, 107 Martínez Pillet, V . 2002, Astron. Nachr., 323, 342
1998
-
[34]
A., Collados, M., Mathioudakis, M., & Erdelyi, R
Matthews, S. A., Collados, M., Mathioudakis, M., & Erdelyi, R. 2016, in So- ciety of Photo-Optical Instrumentation Engineers (SPIE) Conference Series, V ol. 9908, Ground-based and Airborne Instrumentation for Astronomy VI, 990809
2016
-
[35]
E., Minnaert, M
Moore, C. E., Minnaert, M. G. J., Houtgast, J., & Rowland, H. A. 1966, The Solar Spectrum 2935 Å to 8770 Å: Second Revision of Rowland’s Prelimi- nary Table of Solar Spectrum Wavelengths, V ol. 61 (Washington, D.C., USA: National Bureau of Standards)
1966
-
[36]
2001, in Encyclopedia of Astronomy and Astrophysics, ed
Muller, R. 2001, in Encyclopedia of Astronomy and Astrophysics, ed. P. Murdin (London, UK: IOP Publishing Ltd and Nature Publishing Group), 2254
2001
-
[37]
D., Thompson, B
Pesnell, W. D., Thompson, B. J., & Chamberlin, P. C. 2012, Sol. Phys., 275, 3
2012
-
[38]
Reardon, K. P. & Cavallini, F. 2008, Astron. Astrophys., 481, 897
2008
-
[39]
Rimmele, T. R. 2004, in Proc. SPIE, V ol. 5490, Advancements in Adaptive Op- tics, ed. D. Bonaccini Calia, B. L. Ellerbroek, & R. Ragazzoni, 34–46
2004
-
[40]
H., Schou, J., Bush, R
Scherrer, P. H., Schou, J., Bush, R. I., et al. 2012, Sol. Phys., 275, 207
2012
-
[41]
& Title, A
Shine, R. & Title, A. 2001, in Encyclopedia of Astronomy and Astrophysics, ed. P. Murdin (London, UK: IOP Publishing Ltd and Nature Publishing Group), 2038
2001
-
[42]
2004, As- tron
Spadaro, D., Billotta, S., Contarino, L., Romano, P., & Zuccarello, F. 2004, As- tron. Astrophys., 425, 309
2004
-
[43]
2004, The Sun: An Introduction (Berlin, Germany: Springer)
Stix, M. 2004, The Sun: An Introduction (Berlin, Germany: Springer)
2004
-
[44]
& Bello González, N
Strecker, H. & Bello González, N. 2018, Astron. Astrophys., 620, A122
2018
-
[45]
2001, in Encyclopedia of Astronomy and Astrophysics, ed
Tandberg-Hanssen, E. 2001, in Encyclopedia of Astronomy and Astrophysics, ed. P. Murdin (London, UK: IOP Publishing Ltd and Nature Publishing Group), 2277
2001
-
[46]
R., Beruko ff, S., et al
Tritschler, A., Rimmele, T. R., Beruko ff, S., et al. 2015, in Cambridge Work- shop on Cool Stars, Stellar Systems, and the Sun, V ol. 18, 18th Cambridge Workshop on Cool Stars, Stellar Systems, and the Sun, 933–944
2015
-
[47]
A., Alissandrakis, C
Tsiropoula, G., Georgakilas, A. A., Alissandrakis, C. E., & Mein, P. 1992, As- tron. Astrophys., 262, 587 van Noort, M., Rouppe van der V oort, L., & Löfdahl, M. G. 2005, Sol. Phys., 228, 191
1992
-
[48]
1972, Sol
Zirin, H. 1972, Sol. Phys., 22, 34
1972
-
[49]
1974, in IAU Symposium, V ol
Zirin, H. 1974, in IAU Symposium, V ol. 56, Chromospheric Fine Structure, ed. R. G. Athay, 161 Article number, page 14 of 14
1974
Reviewed August 14, 2026 · model on record in the stance chip above.
Discussion (0). Continue with ORCID to comment.