REVIEW 5 major objections 5 minor 40 references
Main trends of the quasar main sequence -- effect of viewing angle
T0 review · 5 major / 5 minor · reviewed 2026-08-14 · deepseek-v4-flash
Pith's one-line read The quasar main sequence is shaped by viewing angle.
desk verdict Useful CLOUDY parameter study whose MS-wide explanation lives mostly in the companion paper and whose BLR-size predictor is calibrated on the very scaling it claims to test. read the letter →
The pith
A machine-rendered reading of the paper's core claim, the machinery that carries it, and where it could break.
The reading
What carries the argument
The load-bearing object is the angle-dependent virial form factor, $f = \frac{1}{4}\left(\kappa^{-2} + \sin^2\theta\right)$, which converts a Keplerian velocity into the observed FWHM of H$\beta$ and therefore determines the virial radius $r_{\rm BLR} = (1/f) G M_{\rm BH} / \mathrm{FWHM}^2$. The paper feeds this $f$ into photoionization simulations of FeII emission and scans density, metallicity, SED shape, microturbulence, and black hole mass, generating 2D maps of $R_{\rm FeII}$ over the density–metallicity plane at each viewing angle. These maps are the predictive tool: they connect an observable spectral indicator to a physical radius.
What would settle it
Compare the viewing angles this model infers for a sample of quasars with independent geometric inclinations, for example from radio jet morphology or accretion-disk continuum fitting; if the two sets of angles do not correlate, the central angle-dependence claim is falsified. Alternatively, measure BLR radii via reverberation mapping for high-accretion xA sources and check against the radii predicted from the $R_{\rm FeII}$–metallicity maps, where a systematic mismatch would also falsify the scheme.
Extended reading notes
Core claim
The central claim is that the virial form factor is strongly viewing-angle dependent, $f = \frac{1}{4}\left(\kappa^{-2} + \sin^2\theta\right)$, where $\theta$ is the angle between the disk axis and the line of sight and $\kappa$ measures how isotropic the cloud velocity field is. Ignoring this dependence, the paper argues, has hidden a key driver of the main sequence. With $f$ included, the full range of $R_{\rm FeII}$ and FWHM(H$\beta$) across both quasar populations is recovered using physically motivated parameters, and each spectral type gets a constrained viewing angle. The method also produces $R_{\rm FeII}$–density–metallicity maps from which the BLR radius can be predicted when matched to the standard $r_{\rm BLR}$–$L_{5100}$ relation.
Load-bearing premise
The viewing angle is not measured directly; it is inferred by requiring the virial broad-line region radius to match the empirical $r_{\rm BLR}$–$L_{5100}$ luminosity relation, and if that relation is not universal for the high-accretion sources the model targets, the inferred angles and BLR-size predictions shift.
Editorial extensions
If this is right
- Viewing angle becomes a constrained, physical parameter for each spectral type, so the main sequence plane can be read as a geometric diagnostic.
- The density–metallicity maps allow the BLR radius to be predicted from a single epoch spectrum, giving a way to forecast reverberation-mapping delays.
- The high-FWHM Population B sources are reproduced by higher black hole mass rather than by implausibly large viewing angles, keeping them within the unobscured Type-1 regime.
- The rarity of extreme FeII emitters (xA sources) is explained: only a narrow combination of density, metallicity, modest microturbulence, and favorable viewing angle yields $R_{\rm FeII} \gtrsim 1$.
- If the inferred radii hold, quasar distances derived from BLR scaling relations become testable and the use of quasars as cosmological probes is put on a firmer physical footing.
Reading between the lines
- An independent test suggests itself: compare the viewing angles inferred from the main-sequence position with geometric inclinations from radio jet morphology or disk continuum fitting; correlation would support the scheme, whereas no correlation would suggest the angle is absorbing other parameter degeneracies.
- The paper's density–metallicity coupling implies that abundance estimates from FeII or UV lines may be biased if inclination is ignored; a joint fit to multiple line ratios could separate the two.
- If part of the scatter in the $r_{\rm BLR}$–$L_{5100}$ relation is actually viewing angle, then correcting for it might tighten the relation and improve quasar-based distance estimates, an extension the paper motivates but does not demonstrate.
- The microturbulence–metallicity coupling found in the grids suggests that template fits to FeII profiles should marginalize over both parameters jointly rather than fixing turbulence, which would change derived metallicities.
Signed reviews
Editorial analysis
A structured set of objections, weighed in public.
Referee Report
Summary. The paper proposes a CLOUDY-based photoionization modeling of the Fe II emission in the broad-line region of quasars, incorporating a viewing-angle-dependent virial form factor, to interpret the quasar main sequence (FWHM Hβ versus R_FeII). The authors argue that with an appropriate distribution of viewing angle, Eddington ratio, cloud density, metallicity, microturbulence, and SED shape, they can reproduce the observed MS trends and the rarity of extreme xA quasars, and they suggest that the resulting R_FeII–density–metallicity maps can be used to recover the BLR radius from a single spectrum. The results, however, are presented for one spectral bin (A1) only, and the viewing angle is set by requiring the virial BLR radius to match the Bentz et al. (2013) scaling.
Significance. If the claims hold, the paper would strengthen the theoretical grounding of the quasar main sequence by tying the optical Fe II strength and Hβ width to a small set of physical parameters including viewing angle, and it would offer an auxiliary route to BLR size estimates. The forward modeling with CLOUDY over a broad density–metallicity grid is a useful resource, and the authors are candid in Section 4 about the provisional nature of the predictive tool. However, the present manuscript demonstrates the approach only for spectral type A1, the comparison with observed R_FeII is qualitative, and the key quantitative claims are not yet established.
major comments (5)
- [Section 2.1, Eq. (2.5)] The formula f = (1/4)(1/κ^2 + sin^2 θ) does not follow from Eqs. (2.3) and (2.4). Using v_iso = κ v_K in Eq. (2.3) and substituting v_K^2 = f FWHM^2 from Eq. (2.4) gives FWHM^2 = 4 f FWHM^2 (κ^2 + sin^2 θ), hence f = 1/[4(κ^2 + sin^2 θ)], not the printed expression. Because f enters Eq. (2.2) for r_BLR and is used to constrain the viewing angle in Section 3.2 and Figures 2–5, this algebraic error is load-bearing; the manuscript must either correct Eq. (2.5) or demonstrate (e.g., by reference to the code) that the correct form was used in the simulations.
- [Section 3.2 and Figure 2 caption] The viewing angle is not independently constrained; the caption states that 'the r_BLR from the virial relation imposed to be close to the one predicted from the standard r_BLR-L5100 relation (Bentz et al., 2013).' The maps are therefore generated at θ values that force the virial radius to coincide with the Bentz scaling. The Section 4 proposal to use these maps to 'recover the virial radius of the broad-line region' from R_FeII and metallicity is consequently circular: any r_BLR recovered from the maps will reproduce the input scaling, and the claim about predicting shorter time delays for high-accretion xA sources is not supported because those sources are not part of the calibration. The authors should refit the maps without imposing Bentz et al. (2013) or validate the method on sources with independently measured reverberation lags.
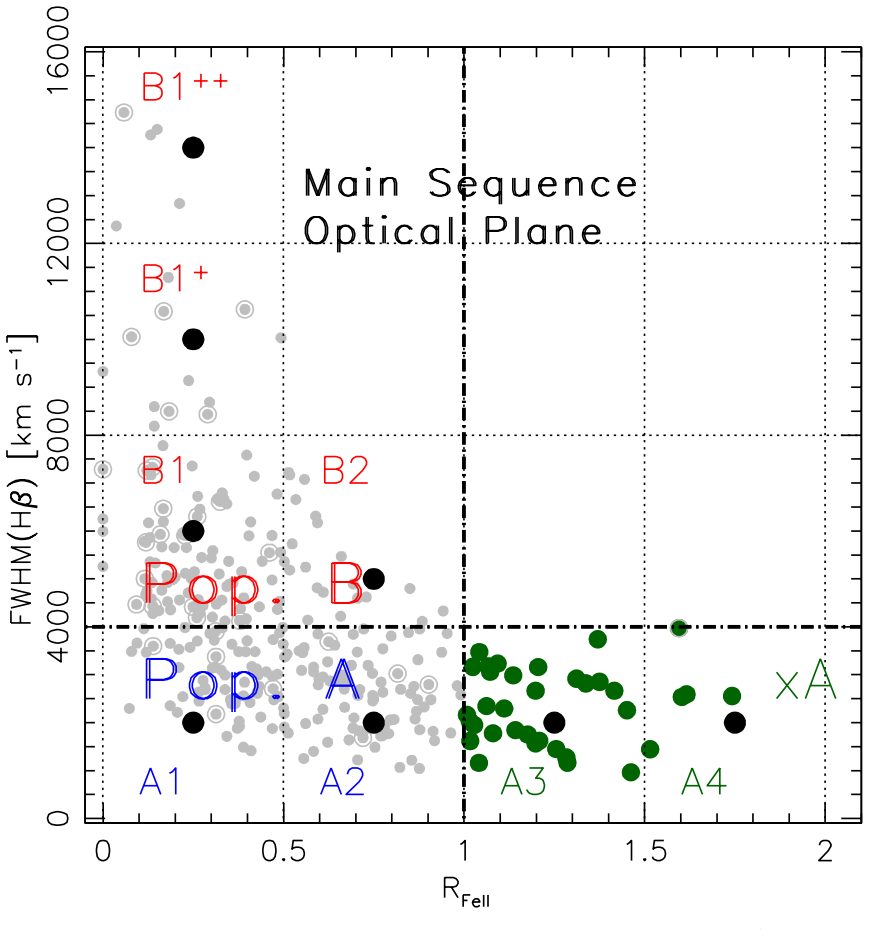
- [Section 3.1 and Section 4] The paper states in Section 3.1 that 'at present we show the full results only for one representative spectral bin A1', yet the abstract and Section 4 claim that the model explains the diversity of quasars and covers the full extent of the quasar main sequence. This broad claim is not supported by the evidence in the manuscript. The authors must either present corresponding maps for the other spectral types (A2–A4, B1, B1+, B2) or restrict the abstract and conclusions to the A1 demonstration.
- [Section 3.2] The comparison of modeled R_FeII to the observed range for A1 is qualitative: 'From Figure 1, we can obtain the range of the RFeII for the spectral type A1 – [0,0.5]. Taking this upper limit and comparing it with the panels in Figure 2...' No quantitative fit, goodness-of-fit measure, or error analysis is presented. The paper therefore does not establish that the model 'recovers' the observed R_FeII trends; a quantitative comparison, such as overlaying observed sources on the model grid or performing a likelihood analysis, is required.
- [Abstract and Section 3] The abstract claims that the model recovers the dependence of R_FeII on L_bol/L_Edd, but all main figures in the paper use a single Eddington ratio (λ_Edd = 0.2) and do not show any variation with L_bol/L_Edd. Either add a figure with varying λ_Edd or rewrite the abstract to refer to the companion paper (Panda et al. 2019b) for this dependence.
minor comments (5)
- [Section 2.1 vs Section 2.2] The viewing angle range is given as 0–60 degrees in Section 2.1 but as [0–90 degrees] in Section 2.2; please reconcile these statements.
- [Section 3.2, first paragraph] The sentence 'The use of angle-dependent form factor (see Eq. 2 and 5)' should reference Eqs. (2.2) and (2.5) using consistent equation numbering.
- [Abstract] The phrase 'the grossly underestimated role of the form factor (f)' is vague; please specify in what sense the role was underestimated and how this work addresses it.
- [Figure 2 caption] In the caption, 'the r_BLR from the virial relation imposed to be close to...' is missing the verb 'is'; it should read 'is imposed to be close to'.
- [Section 4] The abstract presents the predictive tool as established ('can be used as a predictive tool'), while the body says 'Although this possibility needs robust testing, it might be applicable as a predictor.' The abstract should be aligned with this caveat.
Circularity Check
Viewing angle is calibrated to the Bentz r_BLR-L5100 relation, so the proposed BLR-size 'prediction' partly reduces to an input scaling.
-
fitted input called prediction
[Section 3.2 and Figure 2 caption; proposed use in Section 4]
"In the simulation arrays of Fig. 2, the rBLR from the virial relation imposed to be close to the one predicted from the standardrBLR-L5100 relation (Bentz et al., 2013)."
The viewing angle theta is not independently measured: it is the value that makes the virial radius of Eq. 2.2 (with angle-dependent f) match the external Bentz et al. (2013) r_BLR-L5100 scaling, as stated in the quote and in the figure titles. All R_FeII maps in Figures 2-5 are evaluated at such constrained theta values, so each map is tied to the Bentz relation. Section 4 then proposes to use R_FeII and metallicity projected onto these maps 'to ultimately recover the virial radius of the broad-line region.' That recovery is not an independent prediction: the map was generated by imposing the very r_BLR-L5100 relation it is supposed to test, and the claimed shorter time delays for extreme xA sources are not derivable from maps normalized to Bentz.
full rationale
The central photoionization modeling is not circular: CLOUDY forward-computes R_FeII as a function of density, metallicity, SED, microturbulence, and Eddington ratio, with no R_FeII data fitted in the maps, and the resulting main-sequence trend is compared with an external observed plane. The self-citations to Panda et al. (2017, 2018, 2019a,b) provide parameter choices and prior results, but they are not invoked as a uniqueness theorem and the R_FeII calculation itself is independently performable. The one load-bearing circularity is the BLR-size 'prediction': the viewing angle is calibrated by enforcing agreement with Bentz et al. (2013), then the maps are offered as a way to recover the BLR radius, so that particular predictive output reduces to the imposed scaling. Also note as a correctness issue, not circularity, that combining Eqs. 2.3 and 2.4 gives f = 1/[4(kappa^2 + sin^2 theta)], not the printed Eq. 2.5, so the angle-dependent form factor printed in the paper does not follow from the preceding equations.
Assumptions & free parameters
free parameters (5)
- viewing angle theta =
18 and 24 degrees in shown panels
- isotropy parameter kappa = v_iso / v_K =
not specified
- microturbulence v_turb =
0, 10, 50, 100 km/s in the grid
- Eddington ratio L_bol / L_Edd =
0.2
- black hole mass M_BH =
1e8 and 1e10 solar masses
assumptions (5)
- domain assumption BLR clouds move in Keplerian orbits around the black hole
- domain assumption The Bentz et al. (2013) r_BLR-L5100 relation holds for the modeled sources
- domain assumption CLOUDY plane-parallel single-cloud photoionization models capture FeII emission
- domain assumption The four adopted SED shapes are representative of the ionizing continua of Type-1 quasars
- domain assumption The virial factor f follows the Collin et al. (2006) form with a single kappa characterizing the BLR geometry
Cite this review
Pith. "Pith review of Main trends of the quasar main sequence -- effect of viewing angle." pith.science (2026). https://pith.science/paper/CD6PKDYC
@misc{pith2026190807972,
  author       = {Pith},
  title        = {Pith review of: Main trends of the quasar main sequence -- effect of viewing angle},
  year         = {2026},
  howpublished = {\url{https://pith.science/paper/CD6PKDYC}},
  note         = {Machine review of arXiv:1908.07972}
}
abstract
We address the effect of the viewing angle of the accretion disk plane and the geometry of the broad-line region (BLR) with the goal of interpreting the distribution of quasars along the main sequence (MS). We utilize photoionization code CLOUDY to model the BLR FeII emission, incorporating the grossly underestimated role of the form factor (f). We recover the dependence of the strength of the FeII emission in the optical (R$_{\rm{FeII}}$) on L$_{\rm{bol}}$/L$_{\rm{Edd}}$ ratio and related observational trends - as a function of the spectral energy distribution (SED) shape, cloud density, composition and intra-cloud dynamics, assumed following prior observational constraints. With this approach, we are now able to explain the diversity of quasars and the change of the quasar properties along the Main Sequence (MS). Our approach also explains the rarity of the highest FeII emitters known as the extreme xA sources and can be used as a predictive tool in future reverberation mapping studies of Type-1 AGNs. This approach further justifies the use of quasars as `cosmological probes'.
Figures


Figures from the paper (2 more)


Reference graph
Works this paper leans on
-
[1]
, " * write output.state after.block = add.period write newline
ENTRY address archiveprefix author booktitle chapter edition editor howpublished institution eprint journal key month note number organization pages publisher school series title type volume year doi label extra.label sort.label short.list INTEGERS output.state before.all mid.sentence after.sentence after.block FUNCTION init.state.consts #0 'before.all :=...
-
[2]
write newline
" write newline "" before.all 'output.state := FUNCTION n.dashify 't := "" t empty not t #1 #1 substring "-" = t #1 #2 substring "--" = not "--" * t #2 global.max substring 't := t #1 #1 substring "-" = "-" * t #2 global.max substring 't := while if t #1 #1 substring * t #2 global.max substring 't := if while FUNCTION word.in bbl.in " " * FUNCTION format....
- [3]
- [4]
-
[5]
Bentz , M. C., Denney , K. D., Grier , C. J., et al. 2013, ApJ, 767, 149
work page 2013
- [6]
-
[7]
Campitiello , S., Ghisellini , G., Sbarrato , T., & Calderone , G. 2018, A&A, 612, A59
work page 2018
-
[8]
Collin , S., Kawaguchi , T., Peterson , B. M., & Vestergaard , M. 2006, A&A, 456, 75
work page 2006
Show all 40 references
-
[9]
1987, ApJ, 321, 305
Czerny , B., & Elvis , M. 1987, ApJ, 321, 305
1987
-
[10]
D'Onofrio , M., Marziani , P., & Sulentic , J. W. 2012, Fifty Years of Quasars (Springer, https://doi.org/10.1007/978-3-642-27564-7)
2012 doi
-
[11]
J., Porter , R
Ferland , G. J., Porter , R. L., van Hoof , P. A. M., et al. 2013, RMxAA, 49, 137
2013
-
[12]
J., Chatzikos , M., Guzm \'a n , F., et al
Ferland , G. J., Chatzikos , M., Guzm \'a n , F., et al. 2017, RMxAA, 53, 385
2017
-
[13]
J., & Scott , P
Grevesse , N., Asplund , M., Sauval , A. J., & Scott , P. 2010, ApSS, 328, 179
2010
-
[14]
T., Ferland , G
Hamann , F., Korista , K. T., Ferland , G. J., Warner , C., & Baldwin , J. 2002, ApJ, 564, 592
2002
-
[15]
1997, ApJS, 108, 401
Korista , K., Baldwin , J., Ferland , G., & Verner , D. 1997, ApJS, 108, 401
1997
-
[16]
C ., & Dimitrijevi \'c , M
Kova c evi \'c , J., Popovi \'c , L. C ., & Dimitrijevi \'c , M. S. 2010, ApJS, 189, 15
2010
-
[17]
J., & McDowell , J
Laor , A., Fiore , F., Elvis , M., Wilkes , B. J., & McDowell , J. C. 1997, ApJ, 477, 93
1997
-
[18]
2019, Accepted for publication in ApJ, arXiv:1903.09687
Mart \'i nez-Aldama , M., Czerny , B., Panda , S., et al. 2019, Accepted for publication in ApJ, arXiv:1903.09687
2019 arXiv
-
[19]
Marziani , P., & Sulentic , J. W. 2014, MNRAS, 442, 1211
2014
-
[20]
W., et al
Marziani , P., Dultzin , D., Sulentic , J. W., et al. 2018, FrASS, 5, 6
2018
-
[21]
A., et al
Marziani , P., del Olmo , A., Mart \' nez-Carballo , M. A., et al. 2019 a , A&A, 627, A88
2019
-
[22]
2019 b , Atoms, 7, 18
Marziani , P., Bon , E., Bon , N., et al. 2019 b , Atoms, 7, 18
2019
-
[23]
G., & Ferland , G
Mathews , W. G., & Ferland , G. J. 1987, ApJ, 323, 456
1987
-
[24]
M., Assef , R
Padovani , P., Alexander , D. M., Assef , R. J., et al. 2017, A&Ar, 25, 2
2017
-
[25]
P., et al
Panda , S., Czerny , B., Adhikari , T. P., et al. 2018, ApJ, 866, 115
2018
-
[26]
2019 a , ApJ, 875, 133
Panda , S., Czerny , B., Done , C., & Kubota , A. 2019 a , ApJ, 875, 133
2019
-
[27]
2017, FrASS, 4, 33
Panda , S., Czerny , B., & Wildy , C. 2017, FrASS, 4, 33
2017
-
[28]
2019 b , Accepted for publication in ApJ, arXiv:1905.01729
Panda , S., Marziani , P., & Czerny , B. 2019 b , Accepted for publication in ApJ, arXiv:1905.01729
2019 arXiv
-
[29]
T., Lacy , M., Storrie-Lombardi , L
Richards , G. T., Lacy , M., Storrie-Lombardi , L. J., et al. 2006, ApJS, 166, 470
2006
-
[30]
2015, ApJ, 815, 33
Risaliti , G., & Lusso , E. 2015, ApJ, 815, 33
2015
-
[31]
Shen , Y., & Ho , L. C. 2014, Nature, 513, 210
2014
-
[32]
W., Marziani , P., & Dultzin-Hacyan , D
Sulentic , J. W., Marziani , P., & Dultzin-Hacyan , D. 2000, ARA&A, 38, 521
2000
-
[33]
W., Marziani , P., Zamanov , R., et al
Sulentic , J. W., Marziani , P., Zamanov , R., et al. 2002, ApJL, 566, L71
2002
-
[34]
M., & Padovani , P
Urry , C. M., & Padovani , P. 1995, PASP, 107, 803
1995
-
[35]
M., Verner , D
Verner , E. M., Verner , D. A., Korista , K. T., et al. 1999, ApJS, 120, 101
1999
-
[36]
P., & V \'e ron , P
V \'e ron-Cetty , M. P., & V \'e ron , P. 2003, A&A, 412, 399
2003
-
[37]
2013, PRL, 110, 081301
Wang , J.-M., Du , P., Valls-Gabaud , D., Hu , C., & Netzer , H. 2013, PRL, 110, 081301
2013
-
[38]
1959, ApJ, 130, 38
Woltjer , L. 1959, ApJ, 130, 38
1959
-
[39]
2019, MNRAS, doi:10.1093/mnras/stz1766
Yu, L.-M., Bian, W.-H., Wang, C., Zhao, B.-X., & Ge, X. 2019, MNRAS, doi:10.1093/mnras/stz1766
2019 doi
-
[40]
W., Marziani , P., & Dultzin , D
Zamfir , S., Sulentic , J. W., Marziani , P., & Dultzin , D. 2010, MNRAS, 403, 1759
2010
Reviewed August 14, 2026 · model on record in the stance chip above.
Discussion (0). Continue with ORCID to comment.