REVIEW 2 major objections 5 minor 54 references
Detection of Sulfur Dioxide by Broadband Cavity-Enhanced Absorption Spectroscopy (BBCEAS)
T0 review · 2 major / 5 minor · reviewed 2026-08-12 · deepseek-v4-flash
Pith's one-line read A compact LED-based BBCEAS instrument detects ambient SO2 down to 0.75 ppbv in five minutes, matching a reference fluorescence monitor with slope 1.04.
desk verdict A solid, honest LED-BBCEAS demonstration for ambient SO2 with a strong external intercomparison; the central claim holds up, though the calibrator-vs-TECO attribution of the headline slope needs fixing. read the letter →
The pith
A machine-rendered reading of the paper's core claim, the machinery that carries it, and where it could break.
The reading
What carries the argument
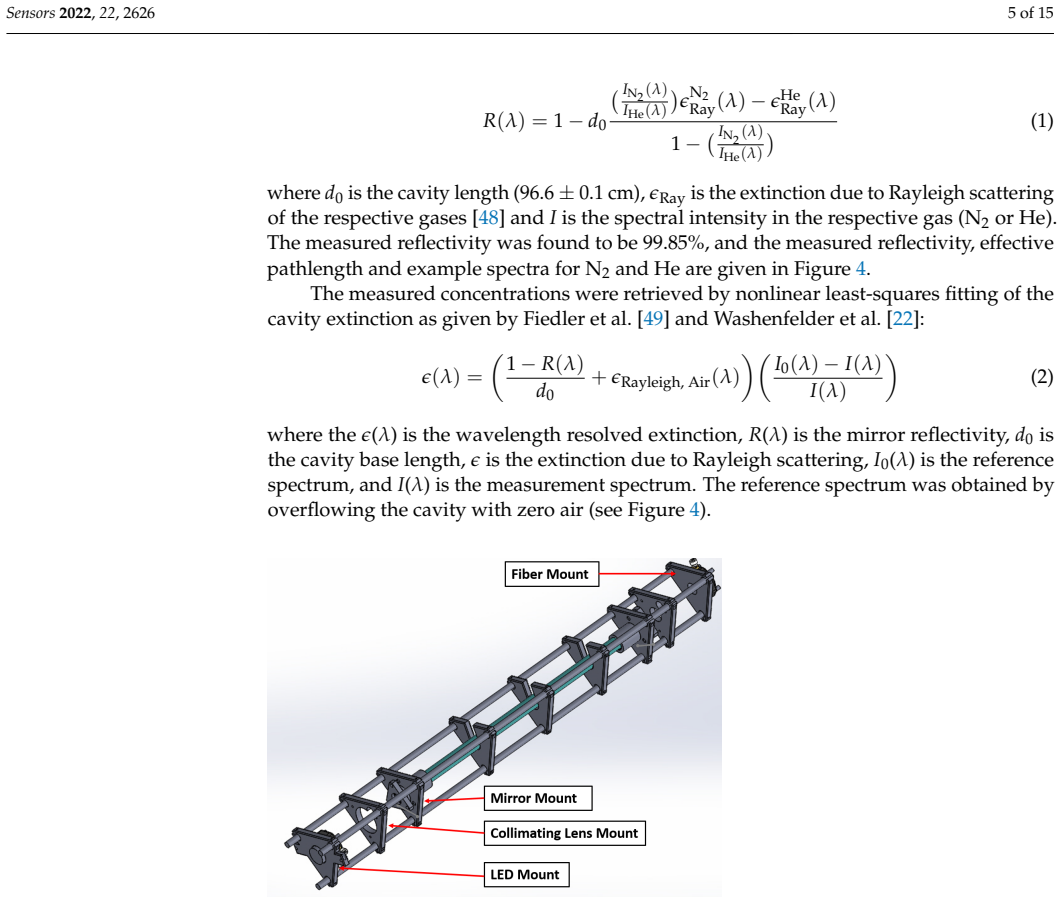
The load-bearing mechanism is the high-finesse optical cavity formed by a pair of 99.85%-reflectivity mirrors spaced 0.966 m apart, which turns a 0.966 m base path into an effective absorption path of 610 m. The mirror reflectivity $R(\lambda)$ is not taken from the manufacturer but measured in place from the differential Rayleigh scattering of helium versus nitrogen (Equation 1); this single calibration, together with the zero-air reference spectrum $I_0(\lambda)$, converts measured intensity ratios into absolute extinction via Equation (2). The retrieved concentrations come from a DOAS-style nonlinear least-squares fit (Equation 3) in which a third-order polynomial absorbs all broadband structure, so the method is sensitive only to the sharp, structured SO2 absorption bands. The combination of long effective path and structured-spectrum fitting is what enables sub-ppbv detection with a low-cost LED and a compact 3D-printed cage.
What would settle it
Re-measure $R(\lambda)$ by the helium/nitrogen Rayleigh method immediately after the ambient campaign and re-fit archived spectra with the re-measured reflectivity; if the retrieved SO2 time series shifts by more than the quoted 5.4% combined uncertainty, or if the reported slope of 1.04 versus the fluorescence monitor changes materially, then the single-time-point mirror calibration was the load-bearing assumption. A second, independent check: inject a structured UV absorber in the same window that was not in the interference test (for example OClO generated in situ) and observe whether the SO2 retrieval changes.
Extended reading notes
Core claim
The central discovery is that the highly structured SO2 absorption bands between 305.5 and 312 nm can be quantified by a LED-based BBCEAS instrument at levels relevant to ambient air quality, with a minimum 3-σ detection limit of 0.75 ppbv over a 5-min average and 0.48 ppbv over 10 min. The retrieval fits the measured cavity extinction as $\epsilon(\lambda)=\sigma_{\mathrm{SO_2}}(\lambda)[\mathrm{SO_2}] + \sigma_{\mathrm{NO_2}}(\lambda)[\mathrm{NO_2}] + \mathrm{polynomial}$, using literature cross sections convolved to the instrument slit function, so only the structured (differential) part of the spectrum contributes; broadband extinction from aerosol or molecules such as acetone is absorbed by the polynomial. The instrument tracked a dilution-calibrated standard and a commercial fluorescence analyser with a correlation slope of 1.04 ± 0.05, offset 0 ± 1 ppbv, and $R^{2}$ = 0.9998. The authors also show that the BBCEAS signal is unchanged when 4 ppmv NO, roughly 1 ppmv xylenes, or ~20 ppmv acetone are added, whereas the fluorescence monitor reports an apparent SO2 response to NO. The paper concludes that this configuration is a viable complementary technique for SO2 monitoring and a pathway to detecting other structured UV absorbers in the same window.
Load-bearing premise
The entire concentration scale rests on one in-place calibration of the mirror reflectivity $R(\lambda)$ measured from the He/N2 Rayleigh-scattering difference at setup; if the mirrors become contaminated, the alignment drifts, or the published Rayleigh cross sections are inaccurate, every retrieved SO2 concentration scales by the same factor and the reported 1.04 agreement with the fluorescence standard moves away from unity.
Editorial extensions
If this is right
- Ambient SO2 monitoring at 0.75 ppbv (5-min) and 0.48 ppbv (10-min) is within the range needed for routine air-quality observations.
- Field calibration can be done with helium and nitrogen rather than traceable SO2 standards, simplifying deployment.
- The demonstrated insensitivity to NO, xylenes, and acetone means the fluorescence interferences that require scrubbers and corrections do not affect this absorption measurement.
- Because the noise follows photon-shot statistics out to at least 20 minutes of integration, longer averaging directly lowers the detection limit without a plateau.
- The same optical arrangement, with higher-throughput gratings, is projected to detect other structured absorbers in the 306–312 nm window at 5-min limits of about 13.5 ppbv NO2, 10.9 ppbv HCHO, 0.09 ppbv OClO, and 0.05 ppbv BrO, as listed in Table 1.
Reading between the lines
- Editorial inference: If the single mirror-reflectivity calibration drifted during the six months of LED operation, all retrieved concentrations would scale uniformly, so the reported slope of 1.04 versus the fluorescence monitor is only as stable as that one calibration.
- Editorial inference: The interference test used one injection each of NO, xylenes, and acetone; other structured UV absorbers in the 305–312 nm window, such as OClO or BrO-like species, were not tested, so 'no interference' is established for the tested set only.
- Editorial inference: A natural extension, mentioned by the authors only as future work, is an open-path configuration to detect short-lived species (BrO, OClO, OH); the same fitting machinery would apply with a different inlet and mirror spacing.
- Editorial inference: The demonstrated cost advantages (3D-printed cage, ~40 W power, LED source) point toward deployment on unmanned aerial platforms for mapping large SO2 emitters, but flight vibration and temperature cycling would need to be tested.
Editorial analysis
A structured set of objections, weighed in public.
Referee Report
Summary. This paper reports a broadband cavity-enhanced absorption spectrometer (BBCEAS) for measuring sulfur dioxide in the deep UV (305.5–312 nm) using a 310 nm LED and high-reflectivity mirrors (R=0.9985). The instrument is calibrated by a He/N2 Rayleigh-scattering difference to retrieve the effective path length, and SO2 concentrations are retrieved by nonlinear least-squares DOAS fitting using literature absorption cross sections. The headline results are a 3-sigma limit of detection of 0.75 ppbv at 5 min averaging (2.6 ppbv at 30 s), an intercomparison slope of 1.04 ± 0.05 with R^2 = 0.9998, a 5.4% combined uncertainty estimate, and the absence of response to NO, xylenes, and acetone. The paper also presents ambient measurements and describes a 3D-printed cage construction.
Significance. If the claims are sustained, this is a useful demonstration of a compact, low-power, interference-free optical approach to ambient SO2 monitoring that approaches commercial fluorescence performance, and it extends BBCEAS into a spectral region (305–312 nm) where LEDs and mirror coatings have historically limited sensitivity. The use of inert-gas calibration and published absorption cross sections is attractive for field deployment and avoids the need for permeation sources. The paper reports a clear photon-noise scaling test (14 h of N2 data) and direct interference tests with NO, xylenes, and acetone. However, the accuracy claim rests on the traceability of the intercomparison and on the long-term stability of the single mirror-reflectivity calibration; these points need clarification before the results can be fully accepted.
major comments (2)
- [Section 3.1 and Figure 7] The text in Section 3.1 states that 'The correlation of the standard dilution from the calibrator with the BBCEAS retrieved concentrations yielded a slope of 1.04 ± 0.05, an offset of 0 ± 1 ppbv, and an R2 value of 0.9998 (Figure 7).' In contrast, the caption of Figure 7 says 'Correlation of BBCEAS (boxes) measured SO2 with respect to that measured by the TECO 43i-TLE.' These are different references: the dilution calibrator is a certified standard while the TECO 43i-TLE is a field fluorescence monitor with its own calibration. If the slope is against the TECO, the intercomparison is one step removed from a traceable standard and the 1.04 slope does not directly validate the BBCEAS accuracy. Please clarify which data are shown in Figure 7, state the traceability of the reference, and if possible provide the correlation against the certified calibrator explicitly.
- [Section 2, Eqs. (1)-(2)] All retrieved mixing ratios are linearly proportional to the factor (1-R(λ))/d0 in Eq. (2), where R(λ) is measured once by the He/N2 Rayleigh-scattering method of Eq. (1). With R ≈ 0.9985 at 310 nm, the mirror-loss term (1-R)/d0 is about 1.55×10⁻³ m−1, and a small absolute drift or bias in R produces a larger relative change in (1-R); for example, an absolute change of 0.0001 in R changes (1-R) by about 7%. The paper reports six months of LED output stability but gives no re-measurement of R over the campaign, and it does not state when the R calibration was performed relative to the calibration and ambient intercomparison. The stated '<2%' uncertainty for the mirror reflectivity is also ambiguous about whether it applies to R or to (1-R). Please provide a time record or repeated R measurements, and a sensitivity analysis showing how a plausible drift in R affects the 1.04 slope and the 5.4% combined uncertainty.
minor comments (5)
- [Section 3.1] The sentence 'Most of the ambient data exhibited no measured SO2 as shown in the ambient portion of Figure 4' appears to reference the wrong figure; Figure 4 shows He/N2 spectra and reflectivity, not ambient time series. This likely should refer to Figure 6 or Figure S2.
- [Section 4] The sentence 'Other absorbance measurements (LP or MAX-DOAS) depend on long path lengths in the atmosphere to and do not represent a point measurement' is garbled and should be rephrased, e.g., 'LP-DOAS and MAX-DOAS depend on long atmospheric path lengths and do not represent point measurements.'
- [Section 3.3] The manuscript reports a 'minimum RMS photon shot noise of 8.7×10⁻⁵' and a 'minimum fit residual for the 30 s average is 1.6 × 10⁻⁸ cm−1'; these numbers differ by orders of magnitude and appear to describe different quantities. Please specify the units and definition of each noise metric (e.g., dimensionless intensity ratio versus extinction in cm−1).
- [Section 3.3] The uncertainty budget lists 'the measurement of the pressure (5%)' as a contributor, but the final 5.4% combined uncertainty appears to be derived only from the 2% extinction uncertainty and the 5% cross-section uncertainty. Please clarify whether the pressure uncertainty is included, and if so, how the mixing-ratio uncertainty remains 5.4%.
- [Section 2 and Abstract] The abstract and conclusions state that 'the BBCEAS showed no interference' and is 'free from interfering species,' while the experimental tests covered NO, xylenes, and acetone only; water vapor was not tested, and other structured UV absorbers such as BrO, OClO, and HCHO (shown in Figure 1) were not examined. Please qualify these statements to the tested species.
Circularity Check
No circular derivation: the mirror-reflectivity calibration, external cross-section fitting, noise-based LOD, and external intercomparison are independent of the claimed SO2 result.
full rationale
The derivation chain is self-contained in the non-circular sense. Mirror reflectivity R(lambda) is measured once via the He/N2 differential Rayleigh-scattering method (Eq. 1), which is an independent calibration input and is not derived from SO2 concentrations or from the intercomparison slope. Equation (2) is the standard BBCEAS extinction relation, and Equation (3) retrieves concentrations by fitting externally published SO2 and NO2 absorption cross sections (Rufus et al. 2003; Vandaele et al. 1998), so the retrieval does not reduce to a fitted parameter of this paper. The 0.75 ppbv LOD is computed from the standard deviation of baseline retrieved concentrations, a statistical noise measure, not from any calibration fit. The intercomparison against the dilution calibrator and/or the TECO 43i-TLE (slope 1.04, R^2 = 0.9998) is an external benchmark: the reported slope is compared against an independent standard, not used as an input to the retrieval. The paper's self-citations, notably Thalman et al. 2014 for Rayleigh scattering cross sections and Thalman and Volkamer 2010 for the BBCEAS method, are real external support because those cited quantities are experimentally measured and not outputs of the present analysis; the load-bearing calibration chain does not define the target result in terms of itself. The only notable issue is an internal-consistency gap in validation reporting, namely that Section 3.1 attributes the 1.04 slope to the dilution calibrator while the Figure 7 caption attributes it to the TECO 43i-TLE; this is a documentation/validation-clarity issue, not a circularity. No step in the paper's derivation is equivalent by construction to its own inputs.
Assumptions & free parameters
free parameters (3)
- DOAS fit polynomial order =
3
- Spectral fit window =
305.5-312 nm
- SO2 absorption cross-section dataset =
Rufus et al. 2003 at 295 K, convolved to instrument slit function
assumptions (4)
- domain assumption BBCEAS extinction equation: epsilon(lambda) = ((1-R)/d0 + epsilon_Rayleigh) * (I0 - I)/I (Eq. 2)
- domain assumption Rayleigh scattering cross sections of N2, He, and air at 305-312 nm (Thalman et al. 2014)
- domain assumption Only SO2 and NO2 have structured absorption large enough to matter in the 305.5-312 nm fit window
- standard math White-noise (photon-shot-noise) scaling of the retrieved SO2 baseline, RMS = 1/sqrt(N)
Cite this review
Pith. "Pith review of Detection of Sulfur Dioxide by Broadband Cavity-Enhanced Absorption Spectroscopy (BBCEAS)." pith.science (2026). https://pith.science/paper/CEANSHS4
@misc{pith2026241115601,
  author       = {Pith},
  title        = {Pith review of: Detection of Sulfur Dioxide by Broadband Cavity-Enhanced Absorption Spectroscopy (BBCEAS)},
  year         = {2026},
  howpublished = {\url{https://pith.science/paper/CEANSHS4}},
  note         = {Machine review of arXiv:2411.15601}
}
abstract
Sulfur dioxide ($\mathrm{SO}_2$) is an important precursor for the formation of atmospheric sulfate aerosol and acid rain. We present an instrument using Broadband Cavity-Enhanced Absorption Spectroscopy (BBCEAS) for the measurement of $\mathrm{SO}_2$ with a minimum limit of detection of 0.75 ppbv (3-$\sigma$) using the spectral range 305.5--312 nm and an averaging time of 5 min. The instrument consists of high-reflectivity mirrors (0.9985 at 310 nm) and a deep UV light source (Light Emitting Diode). The effective absorption path length of the instrument is 610 m with a 0.966 m base length. Published reference absorption cross sections were used to fit and retrieve the $\mathrm{SO}_2$ concentrations and were compared to fluorescence standard measurements for $\mathrm{SO}_2$. The comparison was well correlated ($R^2 = 0.9998$) with a correlation slope of 1.04. Interferences for fluorescence measurements were tested, and the BBCEAS showed no interference, while ambient measurements responded similarly to standard measurement techniques.
Figures


Figures from the paper (6 more)


Reference graph
Works this paper leans on
-
[1]
Schwartz, S.E. Both Sides Now. Ann. N. Y. Acad. Sci. 1987, 502, 83–144. [CrossRef]
work page 1987
-
[2]
Satellite observations and interpretation of the 1991 Mount Pinatubo eruption plumes
Holasek, R.E.; Self, S.; Woods, A.W. Satellite observations and interpretation of the 1991 Mount Pinatubo eruption plumes. J. Geophys. Res. Solid Earth 1996, 101, 27635–27655. [CrossRef]
work page 1991
-
[3]
Oxidation of CS 2 and COS: Sources for atmospheric SO 2
Logan, J.A.; McElroy, M.B.; Wofsy, S.C.; Prather, M.J. Oxidation of CS 2 and COS: Sources for atmospheric SO 2. Nature 1979, 281, 185–188. [CrossRef]
work page 1979
-
[4]
Anthropogenic sulfur dioxide emissions: 1850–2005
Smith, S.J.; van Aardenne, J.; Klimont, Z.; Andres, R.J.; Volke, A.; Delgado Arias, S. Anthropogenic sulfur dioxide emissions: 1850–2005. Atmos. Chem. Phys. 2011, 11, 1101–1116. [CrossRef]
work page 2005
-
[5]
The changing face of lower tropospheric sulfur oxides in the United States
Hidy, G.M.; Blanchard, C. The changing face of lower tropospheric sulfur oxides in the United States. Elem. Sci. Anthr. 2016, 4, 000138. [CrossRef]
work page 2016
-
[6]
EPA. Integrated Science Assessment for Sulfur Oxides-Health Criteria ; Technical Report EPA-HQ-ORD-2013-0357; U.S. Environmental Protection Agency: Washington, DC, USA, 2017
work page 2013
-
[7]
Stratospheric Loading of Sulfur From Explosive Volcanic Eruptions
Bluth, G.J.S.; Rose, W.I.; Sprod, I.E.; Krueger, A.J. Stratospheric Loading of Sulfur From Explosive Volcanic Eruptions. J. Geol. 1997, 105, 671–684. [CrossRef]
work page 1997
-
[8]
An Overview of Geo- engineering of Climate Using Stratospheric Sulphate Aerosols
Rasch, P .J.; Tilmes, S.; Turco, R.P .; Robock, A.; Oman, L.; Chen, C.C.J.; Stenchikov, G.L.; Garcia, R.R. An Overview of Geo- engineering of Climate Using Stratospheric Sulphate Aerosols. Philos. T rans. Math. Phys. Eng. Sci. 2008, 366, 4007–4037. [CrossRef]
work page 2008
Show all 54 references
-
[9]
Sulfate geoengineering: A review of the factors controlling the needed injection of sulfur dioxide
Visioni, D.; Pitari, G.; Aquila, V . Sulfate geoengineering: A review of the factors controlling the needed injection of sulfur dioxide. Atmos. Chem. Phys. 2017, 17, 3879–3889. [CrossRef]
2017
-
[10]
Methods for gas-phase measurements of ozone, ozone precursors and aerosol precursors
Parrish, D.D.; Fehsenfeld, F.C. Methods for gas-phase measurements of ozone, ozone precursors and aerosol precursors. Atmos. Environ. 2000, 34, 1921–1957. [CrossRef]
2000
-
[11]
Results of the Gas-Phase Sulfur Intercomparison Experiment (GASIE): Overview of experimental setup, results and general conclusions
Stecher, H.A., III; Luther, G.W., III; MacTaggart, D.L.; Farwell, S.O.; Crosley, D.R.; Dorko, W.D.; Goldan, P .D.; Beltz, N.; Krischke, U.; Luke, W.T.; et al. Results of the Gas-Phase Sulfur Intercomparison Experiment (GASIE): Overview of experimental setup, results and genera...
1997
-
[12]
Fixation of Sulfur Dioxide as Disulfitomercurate (II) and Subsequent Colorimetric Estimation
West, P .W.; Gaeke, G.C. Fixation of Sulfur Dioxide as Disulfitomercurate (II) and Subsequent Colorimetric Estimation. Anal. Chem. 1956, 28, 1816–1819. [CrossRef]
1956
-
[13]
Reference and Equivalent Methods Used to Measure National Ambient Air Quality Standards (NAAQS) Criteria Air Pollutants; Technical Report EPA/600/R-16/139; U.S
Gilliam, J.; Hall, E. Reference and Equivalent Methods Used to Measure National Ambient Air Quality Standards (NAAQS) Criteria Air Pollutants; Technical Report EPA/600/R-16/139; U.S. Environmental Protection Agency: Washington, DC, USA, 2016; Volume I
2016
-
[14]
ppb-Level SO 2 Photoacoustic Sensors with a Suppressed Absorption–Desorption Effect by Using a 7.41 µm External-Cavity Quantum Cascade Laser
Yin, X.; Wu, H.; Dong, L.; Li, B.; Ma, W.; Zhang, L.; Yin, W.; Xiao, L.; Jia, S.; Tittel, F.K. ppb-Level SO 2 Photoacoustic Sensors with a Suppressed Absorption–Desorption Effect by Using a 7.41 µm External-Cavity Quantum Cascade Laser. ACS Sens. 2020, 5, 549–556. [CrossRef] [PubMed]
2020
-
[15]
Detection of Sulfur Dioxide by Cavity Ring-Down Spectroscopy
Medina, D.S.; Liu, Y.; Wang, L.; Zhang, J. Detection of Sulfur Dioxide by Cavity Ring-Down Spectroscopy. Environ. Sci. T echnol. 2011, 45, 1926–1931. [CrossRef] [PubMed]
2011
-
[16]
Improving long-path differential optical absorption spectroscopy with a quartz-fiber mode mixer
Stutz, J.; Platt, U. Improving long-path differential optical absorption spectroscopy with a quartz-fiber mode mixer. Appl. Opt. 1997, 36, 1105–1115. [CrossRef]
1997
-
[17]
Application of a long-path differential optical absorption spectrometer (LP-DOAS) on the measurements of NO2, SO2, O3, and HNO2 in Gwangju, Korea
Lee, J.; Kim, K.H.; Kim, Y.J.; Lee, J. Application of a long-path differential optical absorption spectrometer (LP-DOAS) on the measurements of NO2, SO2, O3, and HNO2 in Gwangju, Korea. J. Environ. Manag. 2008, 86, 750–759. [CrossRef]
2008
-
[18]
Sulfur dioxide measurements in the lower, middle and upper troposphere: Deployment of an aircraft-based chemical ionization mass spectrometer with permanent in-flight calibration
Speidel, M.; Nau, R.; Arnold, F.; Schlager, H.; Stohl, A. Sulfur dioxide measurements in the lower, middle and upper troposphere: Deployment of an aircraft-based chemical ionization mass spectrometer with permanent in-flight calibration. Atmos. Environ. 2007, 41, 2427–2437. [CrossRef]
2007
-
[19]
Surveillance of SO2 and NO2 from ship emissions by MAX-DOAS measurements and the implications regarding fuel sulfur content compliance
Cheng, Y.; Wang, S.; Zhu, J.; Guo, Y.; Zhang, R.; Liu, Y.; Zhang, Y.; Yu, Q.; Ma, W.; Zhou, B. Surveillance of SO2 and NO2 from ship emissions by MAX-DOAS measurements and the implications regarding fuel sulfur content compliance. Atmos. Chem. Phys. 2019, 19, 13611–13626. [CrossRef]
2019
-
[20]
Broadband cavity enhanced absorption spectroscopy using light emitting diodes
Ball, S.M.; Langridge, J.M.; Jones, R.L. Broadband cavity enhanced absorption spectroscopy using light emitting diodes. Chem. Phys. Lett. 2004, 398, 68–74. [CrossRef]
2004
-
[21]
A compact broadband cavity enhanced absorption spectrometer for detection of atmospheric NO2 using light emitting diodes
Langridge, J.M.; Ball, S.M.; Jones, R.L. A compact broadband cavity enhanced absorption spectrometer for detection of atmospheric NO2 using light emitting diodes. Analyst 2006, 131, 916–922. [CrossRef]
2006
-
[22]
Measurement of glyoxal using an incoherent broadband cavity enhanced absorption spectrometer
Washenfelder, R.A.; Langford, A.O.; Fuchs, H.; Brown, S.S. Measurement of glyoxal using an incoherent broadband cavity enhanced absorption spectrometer. Atmos. Chem. Phys. 2008, 8, 7779–7793. [CrossRef]
2008
-
[23]
Inherent calibration of a blue LED-CE-DOAS instrument to measure iodine oxide, glyoxal, methyl glyoxal, nitrogen dioxide, water vapour and aerosol extinction in open cavity mode
Thalman, R.; Volkamer, R. Inherent calibration of a blue LED-CE-DOAS instrument to measure iodine oxide, glyoxal, methyl glyoxal, nitrogen dioxide, water vapour and aerosol extinction in open cavity mode. Atmos. Meas. T ech. 2010, 3, 1797–1814. [CrossRef]
2010
-
[24]
High Sensitivity in Situ Monitoring of NO3 in an Atmospheric Simulation Chamber Using Incoherent Broadband Cavity-Enhanced Absorption Spectroscopy
Venables, D.S.; Gherman, T.; Orphal, J.; Wenger, J.C.; Ruth, A.A. High Sensitivity in Situ Monitoring of NO3 in an Atmospheric Simulation Chamber Using Incoherent Broadband Cavity-Enhanced Absorption Spectroscopy. Environ. Sci. T echnol. 2006, 40, 6758–6763. [CrossRef] [PubMed]
2006
-
[25]
Absolute ozone absorption cross section in the Huggins Chappuis minimum (350–470 nm) at 296 K
Axson, J.L.; Washenfelder, R.A.; Kahan, T.F.; Young, C.J.; Vaida, V .; Brown, S.S. Absolute ozone absorption cross section in the Huggins Chappuis minimum (350–470 nm) at 296 K. Atmos. Chem. Phys. 2011, 11, 11581–11590. [CrossRef] Sensors 2022, 22, 2626 14 of 15
2011
-
[26]
Instrument intercomparison of glyoxal, methyl glyoxal and NO 2 under simulated atmospheric conditions
Thalman, R.; Baeza-Romero, M.T.; Ball, S.M.; Borrás, E.; Daniels, M.J.S.; Goodall, I.C.A.; Henry, S.B.; Karl, T.; Keutsch, F.N.; Kim, S.; et al. Instrument intercomparison of glyoxal, methyl glyoxal and NO 2 under simulated atmospheric conditions. Atmos. Meas. T ech.2015, 8, 1...
2015
-
[27]
The time dependence of molecular iodine emission from Laminaria digitata
Dixneuf, S.; Ruth, A.A.; Vaughan, S.; Varma, R.M.; Orphal, J. The time dependence of molecular iodine emission from Laminaria digitata. Atmos. Chem. Phys. 2009, 9, 823–829. [CrossRef]
2009
-
[28]
Incoherent broad-band cavity-enhanced absorption spectroscopy of the marine boundary layer species I2, IO and OIO
Vaughan, S.; Gherman, T.; Ruth, A.A.; Orphal, J. Incoherent broad-band cavity-enhanced absorption spectroscopy of the marine boundary layer species I2, IO and OIO. Phys. Chem. Chem. Phys. 2008, 10, 4471–4477. [CrossRef]
2008
-
[29]
Near-ultraviolet Incoherent Broadband Cavity Enhanced Absorption Spectroscopy for OClO and CH2O in Cl-initiated Photooxidation Experiment
Dong, M.; Zhao, W.; Huang, M.; Chen, W.; Hu, C.; Gu, X.; Pei, S.; Huang, W.; Zhang, W. Near-ultraviolet Incoherent Broadband Cavity Enhanced Absorption Spectroscopy for OClO and CH2O in Cl-initiated Photooxidation Experiment. Chin. J. Chem. Phys. 2013, 26, 133–139. [CrossRef]
2013
-
[30]
The UV and visible spectra of chlorine peroxide: Constraining the atmospheric photolysis rate
Young, I.A.K.; Jones, R.L.; Pope, F.D. The UV and visible spectra of chlorine peroxide: Constraining the atmospheric photolysis rate. Geophys. Res. Lett. 2014, 41, 1781–1788. [CrossRef]
2014
-
[31]
An instrument for measurements of BrO with LED-based Cavity-Enhanced Differential Optical Absorption Spectroscopy
Hoch, D.J.; Buxmann, J.; Sihler, H.; Pöhler, D.; Zetzsch, C.; Platt, U. An instrument for measurements of BrO with LED-based Cavity-Enhanced Differential Optical Absorption Spectroscopy. Atmos. Meas. T ech. 2014, 7, 199–214. [CrossRef]
2014
-
[32]
Incoherent Broadband Cavity-Enhanced Absorption Spectroscopy in the near-Ultraviolet: Application to HONO and NO2
Gherman, T.; Venables, D.S.; Vaughan, S.; Orphal, J.; Ruth, A.A. Incoherent Broadband Cavity-Enhanced Absorption Spectroscopy in the near-Ultraviolet: Application to HONO and NO2. Environ. Sci. T echnol. 2008, 42, 890–895. [CrossRef]
2008
-
[33]
Broadband cavity-enhanced absorption spectroscopy in the ultraviolet spectral region for measurements of nitrogen dioxide and formaldehyde
Washenfelder, R.A.; Attwood, A.R.; Flores, J.M.; Zarzana, K.J.; Rudich, Y.; Brown, S.S. Broadband cavity-enhanced absorption spectroscopy in the ultraviolet spectral region for measurements of nitrogen dioxide and formaldehyde. Atmos. Meas. T ech. 2016, 9, 41–52. [CrossRef]
2016
-
[34]
Wang, M.; Varma, R.; Venables, D.S.; Zhou, W.; Chen, J. A Demonstration of Broadband Cavity-Enhanced Absorption Spectroscopy at Deep-Ultraviolet Wavelengths: Application to Sensitive Real-Time Detection of the Aromatic Pollutants Benzene, Toluene, and Xylene. Anal. Chem. 2022,...
2022
-
[35]
Temperature dependent absorption cross-sections of O2–O2 collision pairs between 340 and 630 nm and at atmospherically relevant pressure
Thalman, R.; Volkamer, R. Temperature dependent absorption cross-sections of O2–O2 collision pairs between 340 and 630 nm and at atmospherically relevant pressure. Phys. Chem. Chem. Phys. 2013, 15, 15371–15381. [CrossRef]
2013
-
[36]
Absorption Spectroscopy in High-Finesse Cavities for Atmospheric Studies
Brown, S.S. Absorption Spectroscopy in High-Finesse Cavities for Atmospheric Studies. Chem. Rev. 2003, 103, 5219–5238. [CrossRef] [PubMed]
2003
-
[37]
CW Integrated cavity output spectroscopy
O’Keefe, A.; Scherer, J.J.; Paul, J.B. CW Integrated cavity output spectroscopy. Chem. Phys. Lett. 1999, 307, 343–349. [CrossRef]
1999
-
[38]
Detection of Nitrogen Dioxide by Cavity Attenuated Phase Shift Spectroscopy.Anal
Kebabian, P .L.; Herndon, S.C.; Freedman, A. Detection of Nitrogen Dioxide by Cavity Attenuated Phase Shift Spectroscopy.Anal. Chem. 2005, 77, 724–728. [CrossRef]
2005
-
[39]
Optical-feedback cavity-enhanced absorption spec- troscopy with an interband cascade laser: Application to SO2 trace analysis
Richard, L.; Ventrillard, I.; Chau, G.; Jaulin, K.; Kerstel, E.; Romanini, D. Optical-feedback cavity-enhanced absorption spec- troscopy with an interband cascade laser: Application to SO2 trace analysis. Appl. Phys. B 2016, 122, 247. [CrossRef]
2016
-
[40]
A broadband optical cavity spectrometer for measuring weak near-ultraviolet absorption spectra of gases
Chen, J.; Venables, D.S. A broadband optical cavity spectrometer for measuring weak near-ultraviolet absorption spectra of gases. Atmos. Meas. T ech. 2011, 4, 425–436. [CrossRef]
2011
-
[41]
Bogumil, K.; Orphal, J.; Homann, T.; Voigt, S.; Spietz, P .; Fleischmann, O.; Vogel, A.; Hartmann, M.; Kromminga, H.; Bovensmann, H.; et al. Measurements of molecular absorption spectra with the SCIAMACHY pre-flight model: Instrument characterization and reference data for atmo...
2003
-
[42]
Measurements of the NO2 absorption cross-section from 42,000 cm−1 to 10,000 cm−1 (238–1000 nm) at 220 K and 294 K
Vandaele, A.; Hermans, C.; Simon, P .; Carleer, M.; Colin, R.; Fally, S.; Mérienne, M.; Jenouvrier, A.; Coquart, B. Measurements of the NO2 absorption cross-section from 42,000 cm−1 to 10,000 cm−1 (238–1000 nm) at 220 K and 294 K. J. Quant. Spectrosc. Radiat. T ransf.1998, 59,...
1998
-
[43]
Fourier Transform Ultraviolet Spectroscopy of the A 2Π3/2 ← X 2Π3/2 Transition of BrO
Wilmouth, D.M.; Hanisco, T.F.; Donahue, N.M.; Anderson, J.G. Fourier Transform Ultraviolet Spectroscopy of the A 2Π3/2 ← X 2Π3/2 Transition of BrO. J. Phys. Chem. A 1999, 103, 8935–8945. [CrossRef]
1999
-
[44]
Photochemistry of acetone under tropospheric conditions
Gierczak, T.; Burkholder, J.B.; Bauerle, S.; Ravishankara, A. Photochemistry of acetone under tropospheric conditions. Chem. Phys. 1998, 231, 229–244. [CrossRef]
1998
-
[45]
High-resolution photoabsorption cross section measurements of SO2, 2: 220 to 325 nm at 295 K
Rufus, J.; Stark, G.; Smith, P .L.; Pickering, J.C.; Thorne, A.P . High-resolution photoabsorption cross section measurements of SO2, 2: 220 to 325 nm at 295 K. J. Geophys. Res. Planets 2003, 108. [CrossRef]
2003
-
[46]
Temperature dependence of the absorption cross sections of formaldehyde between 223 and 323 K in the wavelength range 225–375 nm
Meller, R.; Moortgat, G.K. Temperature dependence of the absorption cross sections of formaldehyde between 223 and 323 K in the wavelength range 225–375 nm. J. Geophys. Res. Atmos. 2000, 105, 7089–7101. [CrossRef]
2000
-
[47]
Barbero, A.; Blouzon, C.; Savarino, J.; Caillon, N.; Dommergue, A.; Grilli, R. A compact incoherent broadband cavity-enhanced absorption spectrometer for trace detection of nitrogen oxides, iodine oxide and glyoxal at levels below parts per billion for field applications. Atmos...
2020
-
[48]
Rayleigh scattering cross-section measurements of nitrogen, argon, oxygen and air
Thalman, R.; Zarzana, K.J.; Tolbert, M.A.; Volkamer, R. Rayleigh scattering cross-section measurements of nitrogen, argon, oxygen and air. J. Quant. Spectrosc. Radiat. T ransf. 2014, 147, 171–177. [CrossRef]
2014
-
[49]
Incoherent broad-band cavity-enhanced absorption spectroscopy
Fiedler, S.E.; Hese, A.; Ruth, A.A. Incoherent broad-band cavity-enhanced absorption spectroscopy. Chem. Phys. Lett. 2003, 371, 284–294. [CrossRef]
2003
-
[50]
Differential Optical Absorption Spectroscopy (DOAS)—Principles and Applications ; Springer: Berlin/Heidelberg, Germany, 2008; Volume 15
Platt, U.; Stutz, J. Differential Optical Absorption Spectroscopy (DOAS)—Principles and Applications ; Springer: Berlin/Heidelberg, Germany, 2008; Volume 15. [CrossRef]
2008
-
[51]
QDOAS Software User Manual, Version 3.2
Dankaert, T.; Fayt, C.; Roozendael, M.V .; Smedt, I.D.; Letocart, V .; Merlaud, A.; Pinardi, G. QDOAS Software User Manual, Version 3.2. 2017. Available online: http://uv-vis.aeronomie.be/software/QDOAS (accessed on 31 January 2021). Sensors 2022, 22, 2626 15 of 15
2017
-
[52]
Kinetics and product studies of the reaction chlorine monoxide + bromine monoxide using flash photolysis-ultraviolet absorption
Sander, S.P .; Friedl, R.R. Kinetics and product studies of the reaction chlorine monoxide + bromine monoxide using flash photolysis-ultraviolet absorption. J. Phys. Chem. 1989, 93, 4764–4771. [CrossRef]
1989
-
[53]
Measurements of diurnal variations and eddy covariance (EC) fluxes of glyoxal in the tropical marine boundary layer: Description of the Fast LED-CE-DOAS instrument
Coburn, S.; Ortega, I.; Thalman, R.; Blomquist, B.; Fairall, C.W.; Volkamer, R. Measurements of diurnal variations and eddy covariance (EC) fluxes of glyoxal in the tropical marine boundary layer: Description of the Fast LED-CE-DOAS instrument. Atmos. Meas. T ech. 2014, 7, 3579...
2014
-
[54]
Open path incoherent broadband cavity- enhanced measurements of NO3 radical and aerosol extinction in the North China Plain
Suhail, K.; George, M.; Chandran, S.; Varma, R.; Venables, D.; Wang, M.; Chen, J. Open path incoherent broadband cavity- enhanced measurements of NO3 radical and aerosol extinction in the North China Plain. Spectrochim. Acta Part A Mol. Biomol. Spectrosc. 2019, 208, 24–31. [CrossRef]
2019
Reviewed August 12, 2026 · model on record in the stance chip above.
Discussion (0). Continue with ORCID to comment.