REVIEW 3 major objections 5 minor 27 references
Distribution of plastics of various sizes and densities in the global ocean from a 3D Eulerian model
T0 review · 3 major / 5 minor · reviewed 2026-08-12 · deepseek-v4-flash
Pith's one-line read A 26-year global ocean simulation finds that only larger, low-density microplastic particles collect in the five subtropical garbage patches, while micrometer-scale particles mix down to about 1 km.
desk verdict Worth reading for the size-dependent Eulerian microplastic model, but the ML-depth seasonal mechanism is internally inconsistent as written and needs correction before the claims can be trusted. read the letter →
The pith
A machine-rendered reading of the paper's core claim, the machinery that carries it, and where it could break.
The reading
What carries the argument
The argument is carried by a mass-conservative buoyancy flux in the advection-diffusion equation: the concentration $\tau$ evolves with a vertical term $\partial_z(\tau w_r)$ rather than $w_r\partial_z\tau$. The terminal velocity entering that term is Stokes' law, $w_r = g(\rho_w-\rho_p)d^2/(18\mu)$, which is what lets particle size enter the problem for the first time: the $d^2$ dependence, together with density contrast, determines whether a particle is surface-trapped, neutrally buoyant-like, or sinking. The flow and mixing fields come from a data-constrained global ocean reanalysis, with a turbulent kinetic energy-based vertical mixing parameterization and an isopycnal mixing parameterization supplying the diffusivity tensor, and coastline sources derived from a global mismanaged-waste estimate.
What would settle it
Measure the settling velocity of irregular, biofouled, and partially fragmented microplastic particles in the 1–100 µm range: if a 10 µm polyethylene fragment settles materially faster or slower than the Stokes value of about 6 µm/s used here, the paper's size threshold for gyre accumulation does not carry over to real particles. A global set of size-resolved vertical profiles in the upper kilometer would directly test the predicted near-uniform 1 µm particle distribution in the mixed layer and the sharp cutoff below it.
Extended reading notes
Core claim
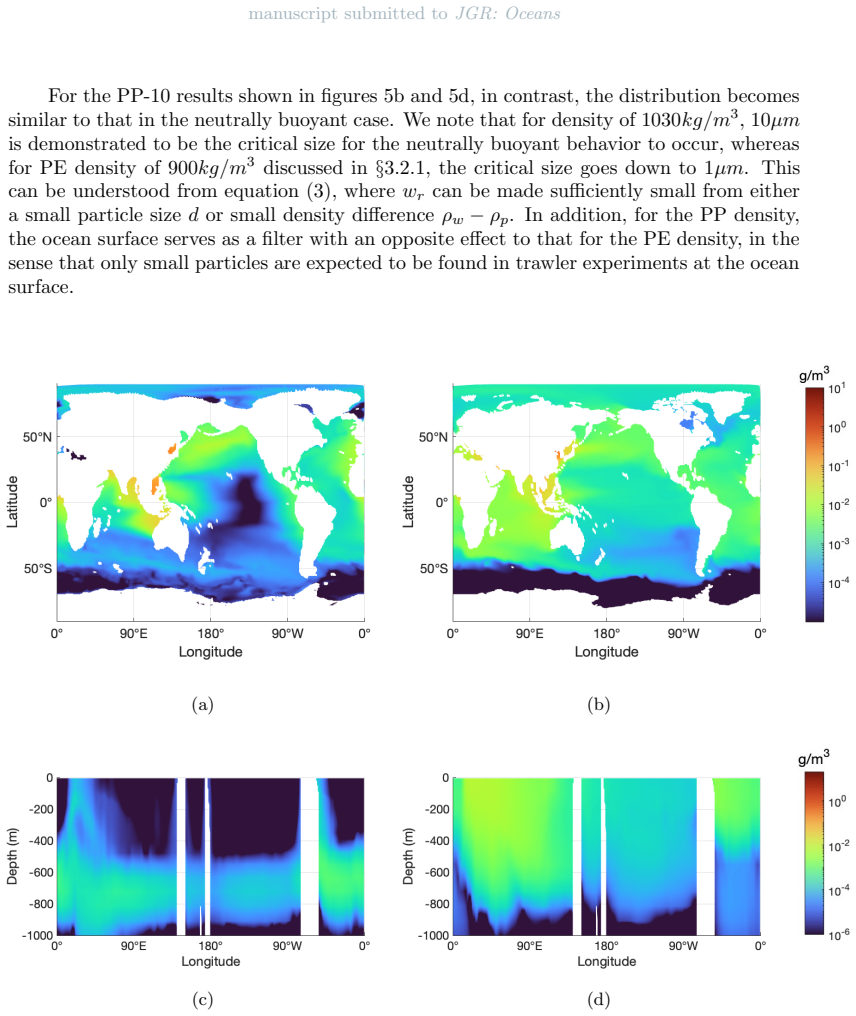
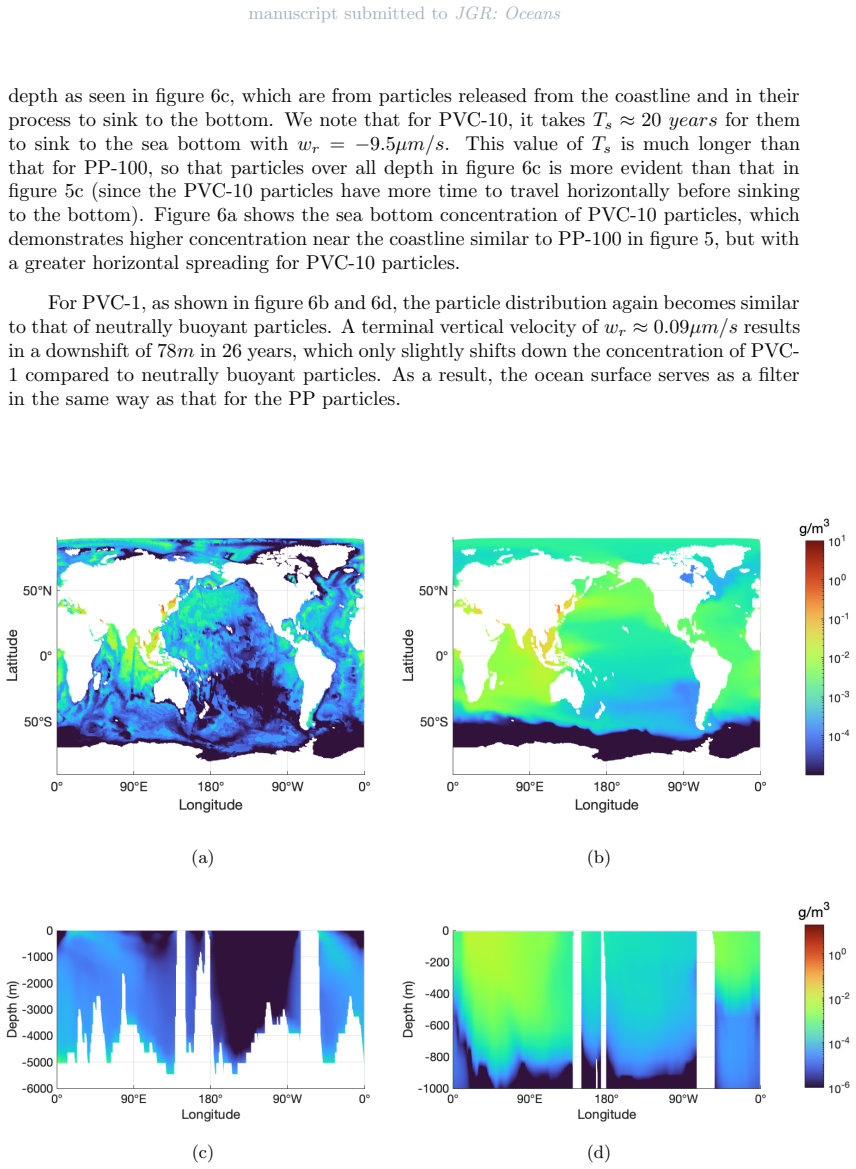
The central discovery is a size threshold for gyre accumulation. For each particle density, there is a critical diameter below which the buoyancy-induced terminal velocity becomes so small that turbulent mixing dominates and the particle's distribution converges to the neutrally buoyant one. Above the threshold, low-density polyethylene rises fast enough to remain near the surface and is concentrated by the converging flow into the five subtropical gyres, while high-density PVC sinks to the seafloor and near-neutral-density polypropylene collects near the depth where seawater density matches the particle density. For floating particles, the model's seasonal surface concentration peaks in summer in the subtropical bands and agrees in phase with CYGNSS satellite retrievals; the authors attribute this to the nearly uniform vertical distribution of particles in a mixed layer whose depth changes seasonally, making surface concentration inversely proportional to mixed-layer depth under conservation of particle mass.
Load-bearing premise
The classification of plastic by size rests on Stokes-law terminal velocities for smooth spheres with fixed viscosity; if real weathered, nonspherical, biofouled particles settle even an order of magnitude faster or slower, the claimed micrometer thresholds and the 1 km penetration depth would shift or disappear.
Editorial extensions
If this is right
- Surface trawler surveys, which catch particles above roughly 0.2 mm, should see garbage-patch accumulation dominated by larger buoyant particles, while smaller particles are underrepresented because vertical mixing carries them below the surface.
- Micrometer-scale plastic of any density should be present throughout the upper kilometer, so global inventories based on surface sampling miss a large subsurface reservoir of microplastic.
- Seasonal changes in surface concentration can occur without any change in the amount of plastic in the ocean, simply because the mixed layer deepens and dilutes the same mass over a thicker water column.
- For near-neutral-density plastics like polypropylene, the surface filter works in reverse: larger particles settle to a depth of matching seawater density, leaving small particles as the main surface-visible population.
- The model gives material-dependent size cutoffs near 1–10 µm that separate surface-accumulating from deeply mixed particles, so particle size data are needed to compare any model or survey with the observed garbage patches.
Reading between the lines
- If real weathered microplastics are nonspherical, biofouled, or fragmented, their effective terminal velocities will differ from Stokes-law values, so an immediate extension would be to replace the smooth-sphere law with shape- and fouling-dependent settling and watch the 1–10 µm thresholds move.
- The mixed-layer dilution mechanism should apply to any passively transported floating tracer, including the surfactant signal that underlies CYGNSS retrievals, which may explain part of the satellite seasonal cycle without invoking seasonal changes in plastic input.
- The predicted penetration of small particles to about 1 km implies a pathway for microplastics to interact with the biological carbon pump and with deep-ocean food webs; coupling the plastic tracer to sinking organic aggregates would be a direct follow-up.
- A targeted test of the size-filter hypothesis would be to measure, in a few gyre transects, whether the size distribution of floating particles is depleted below about 10 µm exactly where the model predicts, and enriched at depth.
Editorial analysis
A structured set of objections, weighed in public.
Referee Report
Summary. The paper develops a global 3D Eulerian advection-diffusion model for microplastics with a size- and density-dependent vertical terminal velocity, forced by ECCOv4r4 currents and coastal mismanaged-waste inputs. Six realistic particle cases plus 2D and neutrally buoyant idealizations are integrated for 26 years. The authors claim that only sufficiently large positively buoyant particles (e.g., PE at 900 kg/m^3 with d >= 10 um) accumulate in the five subtropical gyres, whereas particles near 1 um behave essentially as neutrally buoyant tracers with weaker surface patterns and penetration to roughly 1 km depth. They further report a seasonal cycle of surface PE-10 concentration whose phase agrees with CYGNSS observations, and attribute this cycle to seasonal variation of the mixed-layer depth under an assumed uniform vertical particle distribution with conserved total mass.
Significance. If the results hold, the paper makes a useful contribution by bringing particle size into a global Eulerian microplastic transport framework and proposing a physical mechanism for seasonal surface concentration. The modeling infrastructure is sensible: the buoyancy advection term is written in mass-conservative flux form, the flow and mixing fields come from a data-constrained reanalysis at higher resolution than the previous global Eulerian study, no free parameters are tuned to produce the gyre patterns or seasonal signal, and the code and inputs are intended to be publicly available. The six-case matrix cleanly brackets the neutrally buoyant limit. However, the central size-threshold claim rests on only two diameters per material and on Stokes-law smooth-sphere terminal velocities, and the seasonal mechanism is currently undermined by a sign inconsistency between the reported correlation and the proposed inverse proportionality. These issues do not invalidate the framework but require correction before the conclusions can be accepted as stated.
major comments (3)
- [Section 3.3, Figs. 7 and 10] The seasonal mechanism is internally inconsistent as written. The text reports that the correlation between surface concentration tau and mixed-layer depth h_b is 'positive ... close to 1' (Fig. 10a), and then explains that tau varies inversely with h_b because particles are uniformly mixed in the ML with total mass conserved. If tau is approximately M/h_b with M conserved, the correlation of tau with h_b must be negative, not positive. The paper's own Fig. 7 and Fig. 11 also show high tau in summer when h_b is shallow and low tau in winter when h_b is deep. The authors should correct the sign of the reported correlation, specify that the correlation was computed against 1/h_b or against a transformed variable, or demonstrate that a non-conserved budget term breaks the inverse proportionality. As it stands, the reported statistic contradicts the proposed causal mechanism and must be fixed before the seasonal claim can be evaluated.
- [Section 3.2, Table 2 and Figs. 4-6] The size-threshold conclusions are not supported by the simulation matrix. Each material is simulated at only two diameters (Table 2), so 'PE with d >= 10 um' is not a demonstrated threshold but rather the statement that the tested 10 um case accumulates while the tested 1 um case does not; for PP, the transition is bracketed only between 10 and 100 um, not located. In addition, Eq. (3) presupposes smooth spheres with CD = 24/Re, while Section 4 defers biofouling and fragmentation to future work; non-spherical shapes, biofouling, and fragmentation can change the effective terminal velocity by orders of magnitude and could shift the claimed 10 um and 1 um values substantially. I request either additional intermediate-size or shape-sensitivity simulations, or a revision that presents the result as a qualitative size-dependent transition rather than precise threshold diameters.
- [Sections 3.1-3.2, Figs. 3-6] The claim that small particles penetrate to about 1 km and that gyre accumulation is weak depends on the GGL and GMRedi diffusivity fields from ECCOv4r4 (Section 2.2), but no sensitivity of the penetration depth or of the 10 um vs 1 um distinction to the vertical mixing intensity is provided. Because in the small-particle limit the residual terminal velocity is tiny, the depth profile is largely controlled by the prescribed K, and the 1 km value is therefore a model-dependent diagnostic. A simple sensitivity experiment (for example, scaling K by factors of 0.5 and 2) would show how robust the central size-based classification is to this external input.
minor comments (5)
- [Open Research Section] The GitHub repository URL appears malformed as printed: the text contains spaces and the fragment 'online 68o', and the instruction file is called 'Read me.pdf'. As written, the reproducibility link cannot be used; please provide clean, complete URLs.
- [Section 2.1] The ECCOv4r4 period is given as '1992 to 2007' here but as '1992 to 2017' in the Introduction and elsewhere; since ECCOv4r4 spans 1992-2017, the Section 2.1 date appears to be a typo.
- [Section 3.3, Fig. 10] The global correlation maps are presented without significance testing, sample sizes, or degrees-of-freedom information; given the strong serial correlation of monthly ocean fields, 'close to 1' is not by itself a meaningful statement of agreement unless the correlation is computed on properly detrended or independent data.
- [Section 3.3, Fig. 8] The CYGNSS comparison is qualitative: it compares the month of maximum concentration in a single year (2017) and assesses agreement visually. A quantitative phase-error metric (for example, circular correlation or mean absolute month difference) would strengthen the claim, especially because the retrieval is surfactant-based and the paper itself notes this caveat.
- [Section 2.2] The statement that CD = 24/Re 'irrespective of the shape of the particle' is overly strong: at low Reynolds numbers the drag on non-spherical particles still depends on shape through a shape factor, which is one of the reasons the idealization in Eq. (3) should be flagged as a limitation rather than as a shape-independent law.
Circularity Check
No circular dependency in the core derivation: Stokes-law terminal velocity, ECCOv4r4 currents, GGL/GMRedi diffusivities, and Jambeck sources are independent inputs; the ML-depth/seasonal mechanism is a derived diagnostic rather than an input.
full rationale
The paper's central results are generated by integrating an advection-diffusion equation with a terminal velocity from Stokes' law (Eq. 3), ocean currents from the external ECCOv4r4 reanalysis, diffusivities from GGL/GMRedi parameterizations, and coastal sources from Jambeck et al. (2015). None of these inputs is fitted to the gyre accumulation or seasonal ML-depth signal that is claimed as output, so the stationary-pattern claims are not circular. The size threshold d ~ 10 um follows from comparing the wr values in Table 2 (e.g., PE-10: 6.3 um/s vs PE-1: 0.06 um/s) to a typical vertical ocean current of ~5 um/s; this is a physical comparison, not a fit renamed as prediction. The seasonal ML mechanism is a derived consequence of near-uniform vertical mixing with conserved mass; although the paper reports a 'positive correlation coefficient close to 1' between tau and h_b while asserting tau varies 'inversely proportional' to h_b (Section 3.3), that is an internal sign inconsistency that belongs to correctness risk, not circularity, because the inverse proportionality is not used as an input to produce tau. Self-citations (Evans & Ruf 2022; Sun et al. 2023) are used only for the CYGNSS comparison and for the explicit caveat that the retrieval is surfactant-sensitive rather than a direct microplastic measurement, so they are not load-bearing. The paper itself flags this limitation in Section 3.3 ('CYGNSS retrieves the microplastic concentration from the surface roughness, which is dominantly affected by surfactant'), which further reduces any concern that the independent observational comparison is manufactured.
Assumptions & free parameters
free parameters (3)
- Particle diameter cases =
1, 10, 100 um
- Particle density cases =
900, 1030, 1200 kg/m3
- Coastal source input Q =
Based on Jambeck et al. (2015) mismanaged waste
assumptions (6)
- domain assumption Stokes terminal velocity formula wr = g(rho_w - rho_p)d^2/(18 mu) with C_D = 24/Re applies; particles are spherical and Re < 1.
- domain assumption Microplastics are passive tracers with no feedback on flow and no interaction with each other or marine biota.
- domain assumption ECCOv4r4 reanalysis velocities and GGL plus GMRedi diffusivities are accurate enough at 1 degree resolution to represent vertical transport of particles.
- domain assumption The coastal source Q from Jambeck et al. (2015) and zero-flux boundaries give a realistic particle budget.
- ad hoc to paper Total particle mass in the mixing layer is conserved on seasonal timescales, so surface concentration varies inversely with ML depth.
- domain assumption A 26-year integration yields stationary patterns for the reported particle classes.
Cite this review
Pith. "Pith review of Distribution of plastics of various sizes and densities in the global ocean from a 3D Eulerian model." pith.science (2026). https://pith.science/paper/CKNP2CBB
@misc{pith2026241114335,
  author       = {Pith},
  title        = {Pith review of: Distribution of plastics of various sizes and densities in the global ocean from a 3D Eulerian model},
  year         = {2026},
  howpublished = {\url{https://pith.science/paper/CKNP2CBB}},
  note         = {Machine review of arXiv:2411.14335}
}
abstract
We develop a 3D Eulerian model to study the transport and distribution of microplastics in the global ocean. Among other benefits that will be discussed in the paper, one unique feature of our model is that it takes into consideration the effect of properties of particles (size and density, the former for the first time) to their vertical terminal velocity. With ocean current velocity taken from ECCOv4r4, a dataset generated from a data-assimilated MITgcm reanalysis, our model is integrated for 26 years for particles of different properties with their stationary patterns studied. We find that only low-density particles with sufficient size (e.g. density $900kg/m^3$ with size $\gtrsim 10 \mu m$) aggregate in the five subtropical gyres observed in previous studies. In contrast, particles of smaller size ($\sim 1 \mu m$), irrespective of their density, behave like neutrally buoyant particles with a weaker pattern on the surface and a deeper penetration into depth (up to about 1km deep). In addition, we observe seasonal variations of floating particle concentration on the ocean surface, which reasonably agree with the satellite observation by Cyclone Global Navigation Satellite System (CYGNSS) in terms of the phase of the variation. We find that the seasonal variation of the surface particle concentration correlates well with the variation of the mixing layer (ML) depth globally, due to an almost uniform vertical distribution of particles in the ML with total amount of particles conserved.
Figures


Figures from the paper (8 more)



Reference graph
Works this paper leans on
-
[1]
Adcroft_2004 APACrefauthors Adcroft, A. \ Campin, J M. APACrefauthors \ 2004 jan . Rescaled height coordinates for accurate representation of free-surface flows in ocean circulation models Rescaled height coordinates for accurate representation of free-surface flows in ocean circulation models . Ocean Modelling 7 3–4 269–284 . APACrefURL http://dx.doi.org...
-
[2]
Adcroft_1997 APACrefauthors Adcroft, A. , Hill, C. \ Marshall, J. APACrefauthors \ 1997 sep . Representation of Topography by Shaved Cells in a Height Coordinate Ocean Model Representation of topography by shaved cells in a height coordinate ocean model . Monthly Weather Review 125 9 2293–2315 . APACrefURL http://dx.doi.org/10.1175/1520-0493(1997)125<2293...
-
[3]
Campin_2004 APACrefauthors Campin, J M. , Adcroft, A. , Hill, C. \ Marshall, J. APACrefauthors \ 2004 jan . Conservation of properties in a free-surface model Conservation of properties in a free-surface model . Ocean Modelling 6 3–4 221–244 . APACrefURL http://dx.doi.org/10.1016/S1463-5003(03)00009-X APACrefURL APACrefDOI doi:10.1016/s1463-5003(03)00009-...
-
[4]
Chenillat_2021 APACrefauthors Chenillat, F. , Huck, T. , Maes, C. , Grima, N. \ Blanke, B. APACrefauthors \ 2021 apr . Fate of floating plastic debris released along the coasts in a global ocean model Fate of floating plastic debris released along the coasts in a global ocean model . Marine Pollution Bulletin 165 112116 . APACrefURL http://dx.doi.org/10.1...
-
[5]
C_zar_2014 APACrefauthors Cózar, A. , Echevarría, F. , González-Gordillo, J I. , Irigoien, X. , Úbeda, B. , Hernández-León, S. Duarte, C M. APACrefauthors \ 2014 jun . Plastic debris in the open ocean Plastic debris in the open ocean . Proceedings of the National Academy of Sciences 111 28 10239–10244 . APACrefURL http://dx.doi.org/10.1073/pnas.1314705111...
-
[6]
Dey_2019 APACrefauthors Dey, S. , Zeeshan Ali, S. \ Padhi, E. APACrefauthors \ 2019 aug . Terminal fall velocity: the legacy of Stokes from the perspective of fluvial hydraulics Terminal fall velocity: the legacy of stokes from the perspective of fluvial hydraulics . Proceedings of the Royal Society A: Mathematical, Physical and Engineering Sciences 475 2...
arXiv 2019
-
[7]
ecco_v4r4_synopsis APACrefauthors ECCO Consortium , Fukumori, I. , Wang, O. , Fenty , Heimbach, P. \ Ponte, R M. APACrefauthors \ 2021 feb . Synopsis of the ECCO Central Production Global Ocean and Sea-Ice State Estimate, Version 4 Release 4 Synopsis of the ecco central production global ocean and sea-ice state estimate, version 4 release 4 . APACrefURL h...
-
[8]
eccov4r4_data APACrefauthors ECCO Consortium , Fukumori, I. , Wang, O. , Fenty , Heimbach, P. \ Ponte, R M. APACrefauthors \ 2023 jun . ECCO Central Estimate (Version 4 Release 4). Ecco central estimate (version 4 release 4). APACrefURL https://ecco.jpl.nasa.gov/drive/files/Version4/Release4 APACrefURL
work page 2023
Show all 27 references
-
[9]
, Lebreton, L C M
Eriksen_2014 APACrefauthors Eriksen, M. , Lebreton, L C M. , Carson, H S. , Thiel, M. , Moore, C J. , Borerro, J C. Reisser, J. APACrefauthors \ 2014 dec . Plastic Pollution in the World’s Oceans: More than 5 Trillion Plastic Pieces Weighing over 250,000 Tons Afloat at Sea Pla...
2014 doi
-
[10]
\ Ruf, C S
Maddy_Chris_2022 APACrefauthors Evans, M C. \ Ruf, C S. APACrefauthors \ 2022 . Toward the Detection and Imaging of Ocean Microplastics With a Spaceborne Radar Toward the detection and imaging of ocean microplastics with a spaceborne radar . IEEE Transactions on Geoscience and...
2022
-
[11]
APACrefauthors \ 2010 jun
Forget_2010 APACrefauthors Forget, G. APACrefauthors \ 2010 jun . Mapping Ocean Observations in a Dynamical Framework: A 2004–06 Ocean Atlas Mapping ocean observations in a dynamical framework: A 2004–06 ocean atlas . Journal of Physical Oceanography 40 6 1201–1221 . APACrefUR...
2010 doi
-
[12]
, Campin, J M
Forget_2015 APACrefauthors Forget, G. , Campin, J M. , Heimbach, P. , Hill, C N. , Ponte, R M. \ Wunsch, C. APACrefauthors \ 2015 oct . ECCO version 4: an integrated framework for non-linear inverse modeling and global ocean state estimation Ecco version 4: an integrated frame...
2015 doi
-
[13]
, Grégoris, Y
Gaspar_1990 APACrefauthors Gaspar, P. , Grégoris, Y. \ Lefevre, J. APACrefauthors \ 1990 sep . A simple eddy kinetic energy model for simulations of the oceanic vertical mixing: Tests at station Papa and long‐term upper ocean study site A simple eddy kinetic energy model for s...
1990 doi
-
[14]
\ Mcwilliams, J C
Gent_1990 APACrefauthors Gent, P R. \ Mcwilliams, J C. APACrefauthors \ 1990 jan . Isopycnal Mixing in Ocean Circulation Models Isopycnal mixing in ocean circulation models . Journal of Physical Oceanography 20 1 150–155 . APACrefURL http://dx.doi.org/10.1175/1520-0485(1990)02...
1990 doi
-
[15]
, Geyer, R
Jambeck_2015 APACrefauthors Jambeck, J R. , Geyer, R. , Wilcox, C. , Siegler, T R. , Perryman, M. , Andrady, A. Law, K L. APACrefauthors \ 2015 feb . Plastic waste inputs from land into the ocean Plastic waste inputs from land into the ocean . Science 347 6223 768–771 . APACre...
2015 doi
-
[16]
, Nes, E H v
Kooi_2017 APACrefauthors Kooi, M. , Nes, E H v. , Scheffer, M. \ Koelmans, A A. APACrefauthors \ 2017 jun . Ups and Downs in the Ocean: Effects of Biofouling on Vertical Transport of Microplastics Ups and downs in the ocean: Effects of biofouling on vertical transport of micro...
2017 doi
-
[17]
, Greer, S
Lebreton_2012 APACrefauthors Lebreton, L M. , Greer, S. \ Borrero, J. APACrefauthors \ 2012 mar . Numerical modelling of floating debris in the world’s oceans Numerical modelling of floating debris in the world’s oceans . Marine Pollution Bulletin 64 3 653–661 . APACrefURL htt...
2012 doi
-
[18]
, Hafner, J
Maximenko_2012 APACrefauthors Maximenko, N. , Hafner, J. \ Niiler, P. APACrefauthors \ 2012 jan . Pathways of marine debris derived from trajectories of Lagrangian drifters Pathways of marine debris derived from trajectories of lagrangian drifters . Marine Pollution Bulletin 6...
2012 doi
-
[19]
\ Morales Maqueda, M A
Mountford_2019 APACrefauthors Mountford, A S. \ Morales Maqueda, M A. APACrefauthors \ 2019 dec . Eulerian Modeling of the Three‐Dimensional Distribution of Seven Popular Microplastic Types in the Global Ocean Eulerian modeling of the three‐dimensional distribution of seven po...
2019 doi
-
[20]
APACrefauthors \ 2001
Niiler_2001 APACrefauthors Niiler, P. APACrefauthors \ 2001 . The world ocean surface circulation The world ocean surface circulation . Ocean Circulation and Climate - Observing and Modelling the Global Ocean Ocean circulation and climate - observing and modelling the global o...
2001 doi
-
[21]
, Kawamura, K
Oguri_2013 APACrefauthors Oguri, K. , Kawamura, K. , Sakaguchi, A. , Toyofuku, T. , Kasaya, T. , Murayama, M. Kitazato, H. APACrefauthors \ 2013 may . Hadal disturbance in the Japan Trench induced by the 2011 Tohoku–Oki Earthquake Hadal disturbance in the japan trench induced ...
2013 doi
-
[22]
, Rayner, N A
Reynolds_2002 APACrefauthors Reynolds, R W. , Rayner, N A. , Smith, T M. , Stokes, D C. \ Wang, W. APACrefauthors \ 2002 jul . An Improved In Situ and Satellite SST Analysis for Climate An improved in situ and satellite sst analysis for climate . Journal of Climate 15 13 1609–...
2002 doi
-
[23]
\ Chelton, D B
Risien_2008 APACrefauthors Risien, C M. \ Chelton, D B. APACrefauthors \ 2008 nov . A Global Climatology of Surface Wind and Wind Stress Fields from Eight Years of QuikSCAT Scatterometer Data A global climatology of surface wind and wind stress fields from eight years of quiks...
2008 doi
-
[24]
, Bakker, T
Sun_2023 APACrefauthors Sun, Y. , Bakker, T. , Ruf, C. \ Pan, Y. APACrefauthors \ 2023 feb . Effects of microplastics and surfactants on surface roughness of water waves Effects of microplastics and surfactants on surface roughness of water waves . Scientific Reports 13 1 . AP...
2023 doi
-
[25]
, Krishfield, R
Toole_2011 APACrefauthors Toole, J. , Krishfield, R. , Timmermans, M L. \ Proshutinsky, A. APACrefauthors \ 2011 sep . The Ice-Tethered Profiler: Argo of the Arctic The ice-tethered profiler: Argo of the arctic . Oceanography 24 3 126–135 . APACrefURL http://dx.doi.org/10.5670...
2011 doi
-
[26]
, England, M H
van_Sebille_2012 APACrefauthors van Sebille, E. , England, M H. \ Froyland, G. APACrefauthors \ 2012 dec . Origin, dynamics and evolution of ocean garbage patches from observed surface drifters Origin, dynamics and evolution of ocean garbage patches from observed surface drift...
2012 doi
-
[27]
, Chamecki, M
Yang_2014 APACrefauthors Yang, D. , Chamecki, M. \ Meneveau, C. APACrefauthors \ 2014 mar . Inhibition of oil plume dilution in Langmuir ocean circulation Inhibition of oil plume dilution in langmuir ocean circulation . Geophysical Research Letters 41 5 1632–1638 . APACrefURL ...
2014 doi
Reviewed August 12, 2026 · model on record in the stance chip above.
Discussion (0). Continue with ORCID to comment.