REVIEW 3 major objections 4 minor 1 cited by
Measuring dynamical masses from gas kinematics in simulated high-redshift galaxies
T0 review · 3 major / 4 minor · reviewed 2026-08-14 · deepseek-v4-flash
Pith's one-line read Gas rotation curves in high-redshift disk galaxies can recover the true enclosed-mass profile once turbulent pressure support, non-spherical potentials, and non-circular orbits are accounted for, and neglecting the pressure term alone…
desk verdict The genuinely useful result is that the standard 2σ²dlogΣ/dlogr proxy under-predicts turbulent pressure support in the disk body of FIRE-2 galaxies, but the paper's 'successful recovery' of the mass profile is largely an identity rather than an observational demonstration. read the letter →
The pith
A machine-rendered reading of the paper's core claim, the machinery that carries it, and where it could break.
The reading
What carries the argument
The paper's machinery is a term-by-term decomposition of the enclosed mass into the mass implied by rotation alone, a gravitational correction for non-spherical potentials, and a pressure correction for radial turbulent-pressure gradients: $M_{\rm enc} = M_{\bar v_\phi} + \Delta M_{\rm grav} + \Delta M_{\rm press}$, with $\Delta M_{\rm press} = -\frac{\sigma^2 r}{G}\frac{d\log(\rho\sigma^2)}{d\log r}$. In the simulations each term is measured directly from particle data--brute-force gravitational accelerations on test particles and the pressure profile of cool gas--so the paper can test which physical effects actually account for the discrepancy between $\bar v_\phi$ and $\sqrt{GM_{\rm enc}/r}$. The machinery also includes selection cuts requiring rotation dominance, surface-density smoothness, and orbital circularity (small radial inflow and azimuthally uniform radial motion) to identify the region where rotation can be interpreted as circular motion.
What would settle it
A decisive test is to compare pressure-corrected masses from rotation curves with independent strong-lensing masses for the same $z\approx1$--$2$ galaxies; systematic residuals that grow with radius, or a failure of the correction in galaxies with velocity dispersions well below 100 km/s, would show that the simulated pressure structure does not transfer to real disks.
Extended reading notes
Core claim
The central claim is that the full set of dynamical corrections--turbulent pressure gradients, a non-spherical gravitational potential, and exclusion of non-circular orbital regions--accounts for essentially all of the difference between measured gas rotation and the spherical, zero-pressure expectation in simulated disks. Concretely, the paper derives and tests a mass decomposition $M_{\rm enc} = M_{\bar v_\phi} + \Delta M_{\rm grav} + \Delta M_{\rm press}$ and shows that the corrected sum matches the true enclosed mass on average once only disk snapshots and circularized annuli are selected. The pressure term alone reduces the inferred mass by 10--40 percent in the outer disk, where the surface-density profile steepens, and can exceed 10 percent throughout the disk at $z>2$. The non-spherical-potential correction matters mainly inside the central kiloparsec. The paper concludes that with these conditions met, the total mass profile may be successfully recovered from gas rotation.
Load-bearing premise
The quantitative case rests on the paper's cosmological zoom-in simulations faithfully reproducing the interstellar-medium turbulence of real high-redshift disks, because its velocity dispersions of roughly 100--150 km/s are higher than typical observed values and would inflate the pressure-gradient bias.
Editorial extensions
If this is right
- Neglecting the turbulent-pressure gradient biases dynamical masses of high-redshift disks low by 10--40 percent in the outer disk, so published masses that omit this correction are systematic underestimates there.
- Outer rotation-curve declines in high-redshift galaxies can be produced by pressure support rather than by a falling circular velocity, so they should not be read directly as evidence of low dark-matter content.
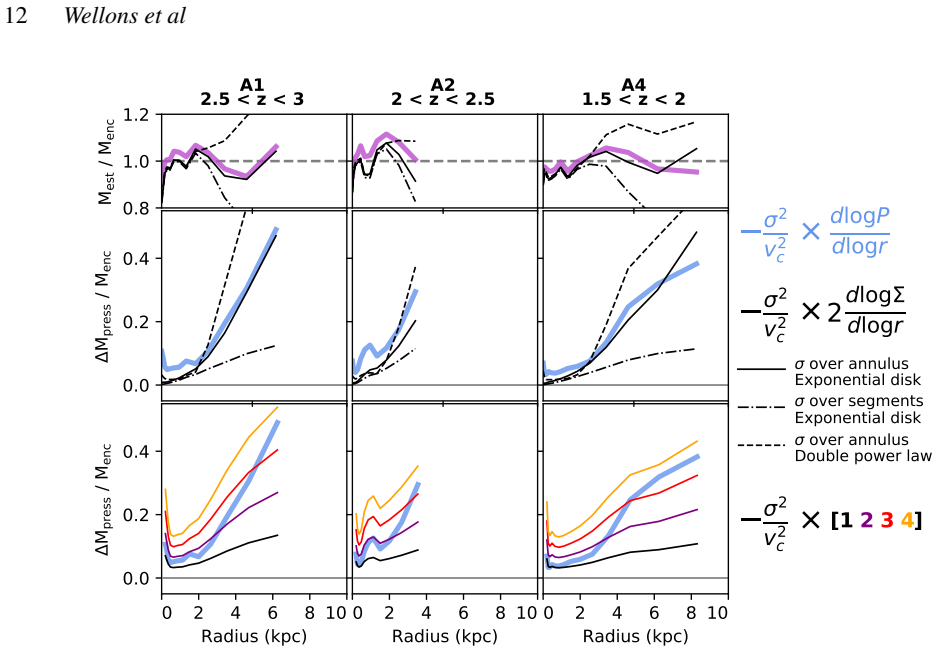
- Standard quasi-observational estimates of pressure support from surface-density slopes (e.g., $-2\sigma^2\,d\log\Sigma/d\log r$) under-correct in the main disk because the surface-density profile is shallow; observers should use steeper outer-disk prescriptions and avoid measuring $\sigma$ in small azimuthal segments.
- At $z>2$, pressure support can bias mass estimates low throughout the disk, so high-redshift kinematic samples need the correction even when they do not reach the far outskirts.
- The same analysis applied to Milky-Way-mass simulated disks at $z\approx0$ shows the correction is small except in the outer disk, supporting the standard local practice of treating rotation as tracing the potential.
Reading between the lines
- Extension: if real high-redshift disks are typically less turbulent than the simulated 100--150 km/s dispersions, the 40 percent figure is an upper bound, and the size of the correction should correlate with measured velocity dispersion in a way that can be tested directly.
- Extension: kinematic samples that trace only bright clumps or CO peaks, where only small-aperture velocity dispersions are available, would systematically under-correct for pressure and therefore keep inferred masses biased low.
- Extension: the paper's circularity criteria suggest a practical quality flag--galaxies with quadrant-to-quadrant variation in radial velocity above roughly 100 km/s, or with azimuthal velocity less than 90 percent of the in-plane speed, should be flagged as unsafe for dynamical mass inference.
Signed reviews
Editorial analysis
A structured set of objections, weighed in public.
Referee Report
Summary. This paper uses four high-resolution FIRE-2 cosmological zoom-in simulations of massive z=1-3 galaxies, plus three lower-mass Milky-Way-mass runs, to assess the corrections required when inferring enclosed dynamical masses from gas rotation curves. The authors measure the intrinsic azimuthal velocity, the radial turbulent pressure gradient, the non-spherical gravitational force, and the degree of orbital circularity in the cool gas, and show that after applying the pressure-gradient and aspherical-potential corrections in the circularized regions of disk snapshots, the summed mass estimate matches the true enclosed mass (Fig. 6). They also test commonly used observational proxies for the pressure term (Eq. 11) and find that these systematically underpredict the true pressure support in the main body of the disk (Fig. 7). The paper concludes that turbulent pressure gradients can bias dynamical mass estimates low by up to 40% in the outer disk and that the full mass profile can be recovered if the corrections are properly included, with the caveat that the simulated galaxies are over-compact and more turbulent than typical observed systems.
Significance. The paper's direct, simulation-internal measurement of the turbulent-pressure and nonspherical-potential corrections is a strength, and its demonstration that these corrections close the radial force balance in the selected annuli is convincing. The central physical result—that pressure gradients can lower inferred masses by tens of percent in the outer, steep-density regions of high-redshift disks—is important and well supported, and the analysis is careful about the disk and circularity selection. The authors are also transparent about the known limitations of the simulations (missing AGN feedback, over-compact stellar distributions, elevated velocity dispersions) and provide a data/code availability statement. The significance is somewhat tempered by the fact that the paper does not demonstrate that these corrections can be measured accurately from observable quantities; indeed, its own Figure 7 shows that standard observational proxies fail to capture the pressure support in the main disk body. Nevertheless, the work is a useful step toward quantifying a systematic that has been identified in observational rotation-curve analyses.
major comments (3)
- [Section 5, Section 4.2, Figure 7] The recovery claim in Section 5 ('the total mass profile may be successfully recovered') is substantially stronger than what the tests demonstrate. Equation (9) is a rearrangement of the radial momentum equation: with f_g defined by Eq. (3) and P = rho sigma^2, Eq. (9) holds by construction for any annulus in which the neglected advective and non-axisymmetric forces are small. The closeness of the purple curve to unity in Figure 6 is therefore primarily a check of the circularity criteria in Section 2.2.4, not a demonstration that a realistic observer can recover M_enc. That latter point is directly challenged by Figure 7, which shows that all three quasi-observational estimators of the pressure term (Eq. 11) underpredict Delta M_press in the main body of the disk. To support the Section 5 claim, the paper needs either to rephrase 'recovered' to make clear that the correction uses simulation-truth forces, or to add a mock-observation analysis that propagates the proxy errors and shows the resulting mass estimates.
- [Section 4.2, abstract] The headline quantitative result—'bias dynamical mass measurements low by up to 40%'—is tied to the simulated ISM velocity dispersions of 100-150 km/s, which the paper itself notes are higher than typically expected from observations. Because the pressure-support term scales approximately as sigma^2/r, a real galaxy population with sigma of order 50-70 km/s would have a substantially smaller bias. Please add an explicit sensitivity estimate (e.g., rescaling sigma to observed values or an analytic scaling argument) and move the caveat into the abstract so that the 'up to 40%' figure is not read as a universal prediction.
- [Section 4.3] The paper assumes that the non-circular regions can be 'identified and excluded' in observations, citing Oman et al. (2019), but does not demonstrate that this selection can be made reliably at the spatial resolution and signal-to-noise of high-redshift IFU or ALMA data. Since the recovery in Figure 6 applies only to the selected circularized region, the practical recommendation for observers is incomplete without a test of how well the selection works on realistic mock observations.
minor comments (4)
- [Section 2.2.2] The text defines P(r) as a sum over particle masses, but it is not immediately clear that this is a volume-averaged pressure; please state explicitly that P(r) = rho sigma_vr^2 with the volume element 2 pi r Delta r times 2 z_h(r), and that sigma_vr is the one-dimensional radial velocity dispersion used throughout.
- [References] The reference list contains a duplicate entry for El-Badry et al. (2018); please merge the two entries.
- [Figure 6] The shaded regions represent the 25th-75th percentile of the variation among snapshots, but the number of snapshots contributing to each panel is not given; please report these numbers, particularly for the z=2.5-3 bins where A4 and A8 have few or no disky snapshots.
- [Equation (11)] The approximation 'approx -2 sigma^2 d log Sigma / d log r' is stated without derivation; a footnote spelling out the isothermal-sheet assumption (rho_0 proportional to Sigma^2, constant scale height) would help readers assess the proxy's validity.
Circularity Check
Mass 'recovery' in Fig. 6 is an algebraic identity because Eq. (9) is constructed from terms that include Menc itself; the central summary claim is therefore a consistency check, though the 40% pressure bias and proxy failures remain directly measured.
-
self definitional
[Section 2.2.3, Eqs. (3)-(9); Figure 6]
"fg(r) = GMenc/r2 + δfg(r) (3) ... We define each of these terms as M¯vφ = ¯v2 φ r/G (6) ∆Mgrav = −r2δfg(r)/G (7) ∆Mpress = −σ2r/G d log(ρσ2)/d logr. (8) such that Menc = M¯vφ + ∆Mgrav + ∆Mpress. (9)"
Because δf_g is defined as f_g - GMenc/r^2, Eq. (7) gives ΔMgrav = Menc - r^2 f_g/G. Inserting this and Eq. (8) into Eq. (9) reduces the right-hand side to Menc whenever the radial momentum equation (Eq. 4) holds. Thus the purple 'recovered' curve in Figure 6 is an algebraic identity in the selected circularized annuli, not an independent measurement of whether the method works: it only verifies that the pre-selected regions satisfy the force balance assumed by the analysis. The summary claim that 'the total mass profile may be successfully recovered' is therefore built into the definitions of the correction terms rather than demonstrated by a test against independent data.
full rationale
The paper is mostly a direct simulation measurement: the 10-40% bias from turbulent pressure gradients and the failure of the standard surface-density proxy are read off from the FIRE-2 outputs without fitting parameters to the target result. However, the headline 'successful recovery' claim is framed as a demonstration but is in fact an identity: Eq. (9) follows by substituting the definition δf_g = f_g - GMenc/r^2 (Eq. 3) into the radial momentum balance (Eq. 4). The ΔMgrav term explicitly contains Menc, so comparing M_vφ + ΔMgrav + ΔMpress to Menc is a consistency check of the circular-equilibrium assumption, not a validation that an observer can recover the mass from observables. The paper itself limits the transfer to observations in Section 4.2, noting that the simulated velocity dispersions (100-150 km/s) are 'higher than typically expected from observations' and that all three quasi-observational estimators 'systematically under-predict' the true pressure support; those caveats are correctness concerns rather than circularity. There are no load-bearing self-citations, imported uniqueness theorems, or renamed empirical patterns in the derivation. The circularity is localized to the recovery demonstration, which is why the score is partial (6) rather than maximal.
Assumptions & free parameters
free parameters (4)
- Rotation-dominated disk threshold v_phi/sigma > 4 =
4
- Circularity criteria: |v_r| < 85 km/s, v_phi/sqrt(v_phi^2+v_r^2) > 0.9, sigma_vr,quad < 100 km/s =
85 km/s, 0.9, 100 km/s
- Cool gas temperature window =
10^3.5 K < T < 10^4.5 K
- Surface density profile fit parameters (double power law or exponential) =
inner slope 0 to -1, outer slope -2.5 to -4.5, break radius 2-6 kpc; exponential scale radius 1.5-5 kpc
assumptions (4)
- domain assumption FIRE-2 subgrid physics (star formation, stellar feedback) produces ISM turbulence and pressure structure representative of real high-z galaxies.
- domain assumption The absence of AGN feedback does not invalidate the outer-disk trends.
- domain assumption The cool gas phase (10^3.5-10^4.5 K) selected at plus or minus the scale height tracks the dynamically relevant disk.
- standard math Standard flat Lambda-CDM cosmology with Planck 2018 parameters.
Cite this review
Pith. "Pith review of Measuring dynamical masses from gas kinematics in simulated high-redshift galaxies." pith.science (2026). https://pith.science/paper/CMVHLSVY
@misc{pith2026190805274,
  author       = {Pith},
  title        = {Pith review of: Measuring dynamical masses from gas kinematics in simulated high-redshift galaxies},
  year         = {2026},
  howpublished = {\url{https://pith.science/paper/CMVHLSVY}},
  note         = {Machine review of arXiv:1908.05274}
}
read the original abstract
Advances in instrumentation have recently extended detailed measurements of gas kinematics to large samples of high-redshift galaxies. Relative to most nearby, thin disk galaxies, in which gas rotation accurately traces the gravitational potential, the interstellar medium (ISM) of z>1 galaxies is typically more dynamic and exhibits elevated turbulence. If not properly modeled, these effects can strongly bias dynamical mass measurements. We use high-resolution FIRE-2 cosmological zoom-in simulations to analyze the physical effects that must be considered to correctly infer dynamical masses from gas kinematics. Our analysis covers a range of galaxy properties from low-redshift Milky-Way-mass galaxies to massive high-redshift galaxies (M_* > 10^11 M_sun at z=1). Selecting only snapshots where a disk is present, we calculate the rotational profile v_phi(r) of the cool (10^3.5 K < T < 10^4.5 K) gas and compare it to the circular velocity v_c=sqrt(GM/r). In the simulated galaxies, the gas rotation traces the circular velocity at intermediate radii, but the two quantities diverge significantly in the center and in the outer disk. Our simulations appear to over-predict observed rotational velocities in the centers of massive galaxies (likely from a lack of black hole feedback), so we focus on larger radii. Gradients in the turbulent pressure at these radii can provide additional radial support and bias dynamical mass measurements low by up to 40%. In both the interior and exterior, the gas' motion can be significantly non-circular due to e.g. bars, satellites, and inflows/outflows. We discuss the accuracy of commonly-used analytic models for pressure gradients (or "asymmetric drift") in the ISM of high-redshift galaxies.
Figures


Figures from the paper (4 more)


Forward citations
Cited by 1 Pith paper
-
Vz-GAL Dusty Star-Forming Galaxies: Revisiting the CO-H2 Conversion Factor Tension
The CO-to-H2 conversion factor in high-z dusty star-forming galaxies is not required to be 0.8; intermediate to near-Galactic values (median ~4-5) remain dynamically viable.
Reference graph
Works this paper leans on
-
[1]
Angl \' e s-Alc \' a zar D., Faucher-Gigu \` e re C. A., Kere s D., Hopkins P. F., Quataert E., Murray N., 2017 a , Monthly Notices of the Royal Astronomical Society, 470, 4698
work page 2017
-
[2]
Angl \' e s-Alc \' a zar D., Faucher-Gigu \` e re C.-A., Quataert E., Hopkins P. F., Feldmann R., Torrey P., Wetzel A., Kere s D., 2017 b , Monthly Notices of the Royal Astronomical Society: Letters, Volume 472, Issue 1, p.L109-L114, 472, L109
work page 2017
-
[3]
Bacon R. et al. , 2010, in Proceedings of the SPIE, Volume 7735, id. 773508 (2010)., McLean I. S., Ramsay S. K., Takami H., eds., Vol. 7735, p. 773508
work page 2010
-
[4]
Belli S., Newman A. B., Ellis R. S., 2017, The Astrophysical Journal, Volume 834, Issue 1, article id. 18, 19 pp. (2017)., 834
work page 2017
-
[5]
Burkert A. et al. , 2016, The Astrophysical Journal, Volume 826, Issue 2, article id. 214, 21 pp. (2016)., 826
work page 2016
-
[6]
Burkert A. et al. , 2010, The Astrophysical Journal, Volume 725, Issue 2, pp. 2324-2332 (2010)., 725, 2324
work page 2010
-
[7]
Choi E., Somerville R. S., Ostriker J. P., Naab T., Hirschmann M., 2018, The Astrophysical Journal, 866, 91
work page 2018
-
[8]
Cochrane R. K. et al. , 2019, Monthly Notices of the Royal Astronomical Society, 488, 1779
work page 2019
Show all 66 references
-
[9]
M., Casey C
Drew P. M., Casey C. M., Burnham A. D., Hung C.-L., Kassin S. A., Simons R. C., Zavala J. A., 2018, The Astrophysical Journal, 869, 58
2018
-
[10]
Eisenhauer F. et al. , 2003, in , Vol. 4841, Instrument Design and Performance for Optical/Infrared Ground-based Telescopes, Iye M., Moorwood A. F. M., eds., pp. 1548--1561
2003
-
[11]
El-Badry K. et al. , 2018, , 477, 1536
2018
-
[12]
El-Badry K. et al. , 2018, Monthly Notices of the Royal Astronomical Society, Volume 473, Issue 2, p.1930-1955, 473, 1930
2018
-
[13]
F., 2013, , 433, 1970
Faucher-Gigu \`e re C.-A., Quataert E., Hopkins P. F., 2013, , 433, 1970
2013
-
[14]
F., Quataert E., Faucher-Gigu \` e re C
Feldmann R., Hopkins P. F., Quataert E., Faucher-Gigu \` e re C. A., Ker e s D., 2016, Monthly Notices of the Royal Astronomical Society: Letters, 458, L14
2016
-
[15]
F., Faucher-Gigu \` e re C.-A., Kere s D., 2017, Monthly Notices of the Royal Astronomical Society, Volume 470, Issue 1, p.1050-1072, 470, 1050
Feldmann R., Quataert E., Hopkins P. F., Faucher-Gigu \` e re C.-A., Kere s D., 2017, Monthly Notices of the Royal Astronomical Society, Volume 470, Issue 1, p.1050-1072, 470, 1050
2017
-
[16]
C., 1970, The Astrophysical Journal, 160, 811
Freeman K. C., 1970, The Astrophysical Journal, 160, 811
1970
-
[17]
Garrison-Kimmel S. et al. , 2017, Monthly Notices of the Royal Astronomical Society, 471, 1709
2017
-
[18]
Genzel R. et al. , 2017, Nature, Volume 543, Issue 7645, pp. 397-401 (2017)., 543, 397
2017
-
[19]
F., 2015, Monthly Notices of the Royal Astronomical Society, 450, 53
Hopkins P. F., 2015, Monthly Notices of the Royal Astronomical Society, 450, 53
2015
-
[20]
F., Kere D., Onorbe J., Faucher-Giguere C.-A., Quataert E., Murray N., Bullock J
Hopkins P. F., Kere D., Onorbe J., Faucher-Giguere C.-A., Quataert E., Murray N., Bullock J. S., 2014, Monthly Notices of the Royal Astronomical Society, 445, 581
2014
-
[21]
Hopkins P. F. et al. , 2018, Monthly Notices of the Royal Astronomical Society, Volume 480, Issue 1, p.800-863, 480, 800
2018
-
[22]
Johnson H. L. et al. , 2018, , 474, 5076
2018
-
[23]
Lang P. et al. , 2017, The Astrophysical Journal, Volume 840, Issue 2, article id. 92, 24 pp. (2017)., 840
2017
-
[24]
Larkin J. et al. , 2006, in Society of Photo-Optical Instrumentation Engineers (SPIE) Conference Series, Vol. 6269, p. 62691A
2006
-
[25]
R., Steidel C
Law D. R., Steidel C. C., Erb D. K., Larkin J. E., Pettini M., Shapley A. E., Wright S. A., 2009, , 697, 2057
2009
-
[26]
Lovell M. R. et al. , 2018, Monthly Notices of the Royal Astronomical Society, Volume 481, Issue 2, p.1950-1975, 481, 1950
2018
-
[27]
McLean I. S. et al. , 2012, in Society of Photo-Optical Instrumentation Engineers (SPIE) Conference Series, Vol. 8446, Ground-based and Airborne Instrumentation for Astronomy IV, p. 84460J
2012
-
[28]
M., Villard E., Escala A., Sobral D., Hughes T
Molina J., Ibar E., Smail I., Swinbank A. M., Villard E., Escala A., Sobral D., Hughes T. M., 2019, Monthly Notices of the Royal Astronomical Society, 487, 4856
2019
-
[29]
Morrissey P. et al. , 2018, , 864, 93
2018
-
[30]
Mowla L. A. et al. , 2019, The Astrophysical Journal, 880, 57
2019
-
[31]
L., Keres D., Faucher-Giguere C.-A., Hopkins P
Muratov A. L., Keres D., Faucher-Giguere C.-A., Hopkins P. F., Quataert E., Murray N., 2015, 23
2015
-
[32]
B., Belli S., Ellis R
Newman A. B., Belli S., Ellis R. S., 2015, The Astrophysical Journal Letters, Volume 813, Issue 1, article id. L7, 7 pp. (2015)., 813
2015
-
[33]
B., Belli S., Ellis R
Newman A. B., Belli S., Ellis R. S., Patel S. G., 2018, The Astrophysical Journal, Volume 862, Issue 2, article id. 126, 14 pp. (2018)., 862
2018
-
[34]
B., Ellis R
Newman A. B., Ellis R. S., Bundy K., Treu T., 2012, The Astrophysical Journal, 746, 162
2012
-
[35]
A., Marasco A., Navarro J
Oman K. A., Marasco A., Navarro J. F., Frenk C. S., Schaye J., Ben \' i tez-Llambay A., 2019, Monthly Notices of the Royal Astronomical Society, 482, 821
2019
-
[36]
Pineda J. C. B., Hayward C. C., Springel V., Mendes de Oliveira C., 2017, , 466, 63
2017
-
[37]
, 2018, arXiv e-prints, arXiv:1807.06209
Planck Collaboration et al. , 2018, arXiv e-prints, arXiv:1807.06209
2018 arXiv
-
[38]
Price S. H. et al. , 2019
2019
-
[39]
I., Iorio G., Agertz O., Fraternali F., 2016, Monthly Notices of the Royal Astronomical Society, Volume 462, Issue 4, p.3628-3645, 462, 3628
Read J. I., Iorio G., Agertz O., Fraternali F., 2016, Monthly Notices of the Royal Astronomical Society, Volume 462, Issue 4, p.3628-3645, 462, 3628
2016
-
[40]
E., Pizagno J., Lackner C
Reyes R., Mandelbaum R., Gunn J. E., Pizagno J., Lackner C. N., 2011, Monthly Notices of the Royal Astronomical Society, 417, 2347
2011
-
[41]
C., Thonnard N., Ford, W
Rubin V. C., Thonnard N., Ford, W. K. J., 1978, The Astrophysical Journal, 225, L107
1978
-
[42]
Sanderson R. E. et al. , 2018, The Astrophysical Journal, 869, 12
2018
-
[43]
Schreiber N. M. F. et al. , 2018, The Astrophysical Journal Supplement Series, 238, 21
2018
-
[44]
Sharples R. et al. , 2013, The Messenger, 151, 21
2013
-
[45]
Sofue Y., Rubin V., 2001, , 39, 137
2001
-
[46]
A., Kriek M., Price S
Suess K. A., Kriek M., Price S. H., Barro G., 2019 a , The Astrophysical Journal, 877, 103
2019
-
[47]
A., Kriek M., Price S
Suess K. A., Kriek M., Price S. H., Barro G., 2019 b , The Astrophysical Journal, 885, L22
2019
-
[48]
Szomoru D. et al. , 2010, The Astrophysical Journal, 714, L244
2010
-
[49]
Talia M. et al. , 2018, Monthly Notices of the Royal Astronomical Society, Volume 476, Issue 3, p.3956-3963, 476, 3956
2018
-
[50]
F., Remus R.-S., Dolag K., Arth A., Burkert A., Obreja A., Schulze F., 2017, The Astrophysical Journal Letters, Volume 854, Issue 2, article id
Teklu A. F., Remus R.-S., Dolag K., Arth A., Burkert A., Obreja A., Schulze F., 2017, The Astrophysical Journal Letters, Volume 854, Issue 2, article id. L28, 6 pp. (2018)., 854
2018
-
[51]
A., Quataert E., Murray N., 2005, , 630, 167
Thompson T. A., Quataert E., Murray N., 2005, , 630, 167
2005
-
[52]
J., Bundy K., Cooper M
Trujillo I., Conselice C. J., Bundy K., Cooper M. C., Eisenhardt P., Ellis R. S., 2007, Monthly Notices of the Royal Astronomical Society, 382, 109
2007
-
[53]
\" U bler H. et al. , 2017, The Astrophysical Journal, 842, 121
2017
-
[54]
\" U bler H. et al. , 2019, The Astrophysical Journal, 880, 48
2019
-
[55]
\" U bler H. D. N. et al. , 2018, The Astrophysical Journal Letters, Volume 854, Issue 2, article id. L24, 7 pp. (2018)., 854
2018
-
[56]
773-789., 657, 773
Valenzuela O., Rhee G., Klypin A., Governato F., Stinson G., Quinn T., Wadsley J., 2007, The Astrophysical Journal, Volume 657, Issue 2, pp. 773-789., 657, 773
2007
-
[57]
van der Wel A. et al. , 2014, The Astrophysical Journal, 788, 28
2014
-
[58]
van Dokkum P. G. et al. , 2008, The Astrophysical Journal, 677, L5
2008
-
[59]
G., Kriek M., Franx M., 2009, Nature, 460, 717
van Dokkum P. G., Kriek M., Franx M., 2009, Nature, 460, 717
2009
-
[60]
van Dokkum P. G. et al. , 2015, The Astrophysical Journal, 813, 23
2015
-
[61]
R., Hopkins P
Wetzel A. R., Hopkins P. F., Kim J.-h., Faucher-Giguere C.-A., Keres D., Quataert E., 2016, The Astrophysical Journal, 827, L23
2016
-
[62]
Wisnioski E. et al. , 2015, The Astrophysical Journal, Volume 799, Issue 2, article id. 209, 27 pp. (2015)., 799
2015
-
[63]
Wuyts S. et al. , 2016, The Astrophysical Journal, Volume 831, Issue 2, article id. 149, 22 pp. (2016)., 831
2016
-
[64]
Zwicky F., 1933, Helvetica physica acta. , Vol. 6. E. Birkhäuser, pp. 110--127
1933
-
[65]
, " * write output.state after.block = add.period write newline
ENTRY address author booktitle chapter edition editor howpublished institution journal key month note number organization pages publisher school series title type volume year label extra.label sort.label short.list INTEGERS output.state before.all mid.sentence after.sentence a...
-
[66]
write newline
" write newline "" before.all 'output.state := FUNCTION n.dashify 't := "" t empty not t #1 #1 substring "-" = t #1 #2 substring "--" = not "--" * t #2 global.max substring 't := t #1 #1 substring "-" = "-" * t #2 global.max substring 't := while if t #1 #1 substring * t #2 gl...
Reviewed August 14, 2026 · model on record in the stance chip above.
Discussion (0). Continue with ORCID to comment.