REVIEW 4 major objections 4 minor 27 references
A phylogenetic approach disentangles interlocus gene conversion tract length and initiation rate
T0 review · 4 major / 4 minor · reviewed 2026-08-14 · deepseek-v4-flash
Pith's one-line read Estimator splits gene-conversion tract length from initiation rate
desk verdict The paper's honest about its own limits, but the central two-parameter claim is never actually tested; the robust part is that IGC is common, not that tract lengths are short. read the letter →
The pith
A machine-rendered reading of the paper's core claim, the machinery that carries it, and where it could break.
The reading
What carries the argument
The pair-site (PS) composite likelihood: for two paralogs, the state of two sites in each paralog is a four-nucleotide joint state, giving a 256-state rate matrix whose off-diagonal entries add point-mutation rates and IGC rates that depend on the separation $n$ between sites. The IGC contribution decomposes as $\eta/p$ for events covering a site, $\eta/p [1-(1-p)^n]$ for events covering one of two sites but not the other, and $(\eta/p)(1-p)^n$ for events covering both; the geometric parameter $p$ thus controls how quickly IGC-induced correlation decays with sequence distance, which is what lets the procedure estimate tract length separately from initiation rate. This is a pairwise composite likelihood in the style of recombination-rate estimation, with uncertainty assessed by parametric bootstrap.
What would settle it
Simulate alignments under a model where the IGC initiation rate declines with donor-recipient divergence while the true mean tract length is held constant, then fit the PS model; if the estimated mean tract length shrinks as divergence increases, the claimed separation of tract length from initiation rate is refuted.
Extended reading notes
Core claim
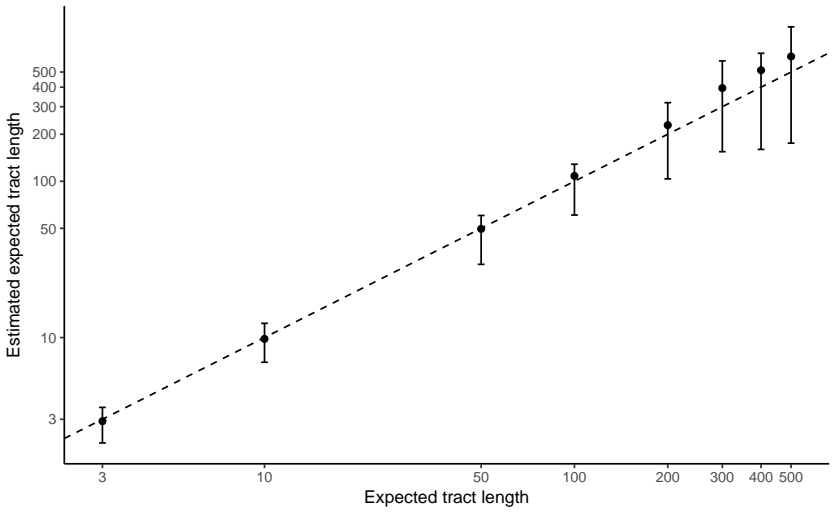
The central discovery is a statistical separation that previous phylogenetic IGC models could not achieve: the product of initiation rate and mean tract length ($\tau = \eta/p$) is replaced by two identifiable parameters, the fixed-tract initiation rate $\eta$ and the geometric tract-length parameter $p$, with mean fixed tract length $1/p$. The separation works by extending the independent-site (IS) model to pairs of sites: for two paralogs and two aligned positions separated by $n$ sites, IGC events that cover both positions occur at rate $(\eta/p)(1-p)^n$, and events covering only one position at rate $(\eta/p)[1-(1-p)^n]$, so the distance-dependence of the correlation carries the tract-length signal. The model is fitted by maximum composite likelihood over all pairs of alignment columns, using Felsenstein's pruning algorithm for each pairwise marginal likelihood. Analyses of simulated data show average estimates of mean tract length close to truth under short-tract conditions, with growing variability as true tracts lengthen. On real data, the procedure attributes roughly 9 to 43 percent of nucleotide change to IGC across datasets and yields estimated mean fixed tract lengths of about 1 to 100 nucleotides for exons and about 370 nucleotides for introns.
Load-bearing premise
The model assumes that gene conversion events occur and become fixed at a rate that does not depend on how different the two paralogs already are; if conversion actually slows as paralogs diverge, the procedure can mistake that slowdown for short tracts or low initiation rates.
Editorial extensions
If this is right
- If the PS separation is correct, estimates of $\tau$ alone are insufficient: evolutionary analyses of duplicated genes should report or model tract length and initiation rate separately.
- IGC should be included in studies of multigene family evolution, because ignoring it misattributes a substantial fraction of change to point substitution.
- Protein-coding exons may have fixed IGC tracts far shorter than IGC mutation tracts, implying that selection or subsequent homologous recombination trims converted segments before fixation.
- Primate intronic IGC tracts are long, on the order of hundreds of nucleotides, in line with mutation-level studies.
- The near-equality of $\tau$ estimates between IS and PS models indicates that the simpler IS model captures the overall IGC rate, while tract length information requires the pair-site extension.
Reading between the lines
- If the rate of IGC truly declines as paralogs diverge, current PS estimates of short exonic tracts may be inflated artifacts; a natural extension is a model where $\eta$ depends on divergence, which would let the procedure distinguish 'conversion stopped early' from 'conversion happened but was overwritten'.
- The same pair-site machinery could be applied to more than two paralogs by summing over pairs, although the paper leaves this as future work.
- A direct test of the exon-intron tract-length gap: analyze multi-exon protein-coding genes with long introns, where a single IGC event spanning an intron would create a distinctive correlation pattern across exon boundaries.
- Because the composite likelihood ignores correlation beyond pairs, the variance of tract-length estimates is likely understated; block-bootstrap or full-likelihood checks on short alignments would quantify this.
Signed reviews
Editorial analysis
A structured set of objections, weighed in public.
Referee Report
Summary. The paper introduces a pair-site (PS) composite-likelihood approach to estimating the parameters of interlocus gene conversion (IGC) from alignments of duplicated genes. The model extends the authors' earlier independent-site (IS) model by jointly considering pairs of sites in two paralogs, allowing a geometric distribution for the length of fixed IGC tracts (parameter p) and an initiation rate η, with τ = η/p. The authors derive the resulting 256-state rate matrix for pairs of sites, apply the method to simulated data and to yeast paralogs, primate EDN/ECP genes, and primate introns, and report estimates of mean fixed tract length (1/p) and the proportion of substitutions attributable to IGC. They conclude that IGC accounts for a substantial fraction of evolutionary change in duplicated regions, while acknowledging that the tract-length estimates from protein-coding data are short and uncertain.
Significance. If the central claim that the PS approach can separately estimate IGC tract-length distribution and initiation rate is supported, the paper provides a useful methodological advance over the IS model and over the binary-state approach of Harpak et al. (2017), because it works with full nucleotide states and does not require the HMM assumption that each site experiences at most one IGC event. The rate-matrix construction is explicit and the composite-likelihood framework is clearly connected to McVean et al. (2002). The paper also includes a valuable external control, the paralog-swapping experiment, which supports the reality of the detected IGC signal. Software and data are made available. However, the validation as presented does not actually exercise the claimed two-parameter separation, and several empirical estimates rest on acknowledged but potentially strong assumptions.
major comments (4)
- [§5.2 and §5.3] The validation protocol never estimates η and p jointly. In the simulation study, the composite likelihood is optimized only over p with τ fixed at the value used to simulate; in the parametric bootstrap, only p is estimated with all other parameters constrained to point estimates, in particular τ. Therefore the simulations and bootstrap do not test the central claim that the PS approach can separately estimate the tract-length parameter p and the initiation rate η. Because τ = η/p, any ridge or weak identifiability in the (η,p) plane would remain undetected, and the bootstrap intervals for 1/p reported in Table 2 are conditional on an estimated τ. I ask the authors to run full joint inference in at least a subset of simulation scenarios, or to provide a profile composite-likelihood or Godambe-information analysis demonstrating that (η,p) are separately identifiable.
- [§3.1 and Figure 1] The simulation summary discards estimates of 1/p that exceed the true value by a factor of 10 or more before computing sample means, while including those discarded values in the reported interquartile ranges. This asymmetric treatment can make the point estimates look better than the procedure actually is, especially at true lengths 200–500 where 3, 7, 6, and 7 estimates were discarded. Please report the full distribution of estimates, the proportion discarded under each condition, and whether the conclusions change when no values are discarded. If long-tailed estimates are inherent to the estimator, that property should be stated as a characteristic of the method rather than hidden by the mean calculation.
- [§5.6 and Table 2] The intron analysis is reported with parameter values shared across the five groups of introns, which the authors explicitly equate to assuming that the duplications generating all five groups occurred at the same time. The text also states that separately analyzing the groups gave substantially different maximum composite-likelihood estimates from different starting values, indicating numerical instability. The intron estimate of 1/p ≈ 370 and its bootstrap interval therefore rest on an assumption known to be violated and on an optimization landscape that is not stable. This limitation should be stated in the results or abstract, or the sensitivity of the intron estimate to the shared-duplication-time assumption should be quantified.
- [§4.1 and §2.1] The model assumes that IGC mutations occur and fix at a rate independent of the sequence divergence between donor and recipient paralogs, and the authors cite Chen et al. (2007) as evidence against this assumption. If IGC rates decline as paralogs diverge, the model could misattribute divergence-dependent declines in gene conversion to short tract lengths or low initiation rates, directly affecting the central estimates of p and η. A concrete check would be to fit a variant of the PS model with a divergence-dependent IGC rate, or to compare estimates on branch subsets with different divergence levels. Without such a check, the empirical tract-length estimates remain vulnerable to this known biological violation.
minor comments (4)
- [§5.3] In the parametric bootstrap description, the phrase 'constraining all other free parameters to their true values' is inaccurate: bootstrap replicates are simulated from the original point estimates, not from true values. Please say 'estimated values' or 'point estimates'.
- [Table 1 caption] The caption refers to the 'maximum log-likelihood value' of the HKY+IS-IGC model, but the procedure maximizes a composite likelihood, not a true likelihood. Please use 'maximum composite log-likelihood' to avoid confusion.
- [§5.2] The text says 'the actual YDR418W YER054C data has a gap' but the gene name is YEL054C everywhere else in the paper (e.g., Tables 1 and 2). Please correct this typo.
- [§5.6] The description of the intron filtering could be clearer about whether the 20 intron subsets are spread across 5 gene pairs with 4 introns each, or whether the distribution is uneven. A sentence specifying the number of introns per gene pair would help readers interpret the shared-parameter analysis.
Circularity Check
The PS decomposition τ = η/p is a modeling identity rather than a circular prediction; simulations and bootstrap fix τ for computational convenience, and the paper's central estimates are not equivalent to its inputs by construction.
full rationale
The central claim is that the pair-site composite likelihood can separately estimate the fixed IGC tract-length distribution (geometric parameter p) and the initiation rate η. The model defines τ = η/p and writes pairwise rates as η/p[1-(1-p)^n] and η/p(1-p)^n; these expressions depend on p through the distance decay (1-p)^n, so 1/p is not an input to the likelihood but is inferred from how pairwise correlation decays with site separation. The simulation study fixes τ at its true value and maximizes only over p, and the paper explicitly acknowledges this shortcut: 'Rather than finding the combination of parameter values that jointly maximize the composite likelihood, computational concerns and numerical optimization difficulties resulted in our instead optimizing the composite likelihood only over the tract length parameter p with all other free parameters constrained at the values that were used to simulate the data sets.' It adds, 'By constraining τ at its true value and then inferring p, a value for the IGC tract initiation parameter η is simultaneously inferred (i.e., η = τ/(1/p)).' This is a deliberate computational simplification, not a hidden reintroduction of the target estimate; the real-data analyses are described as jointly optimizing branch lengths, point-mutation parameters, and IGC-related parameters in Section 5.8. The bootstrap intervals condition on τ, and the paper explicitly warns that this 'will presumably cause the uncertainty in the tract length parameter p to be underestimated,' so the limitation is disclosed rather than disguised. Self-citations to Ji et al. (2016) are used to motivate the shortcut and to provide context, but the PS model's ability to recover known 1/p values is checked against simulations with known truth, and the paralog-swapping experiment provides an external control for the reality of the IGC signal. No step in the derivation reduces by construction to its own input; the observed reduction η = τ/(1/p) is just the definitional relation among η, τ, and p, stated openly. The correct finding is no significant circularity.
Assumptions & free parameters
free parameters (3)
- p =
per data set, e.g., 1/p estimates from 1.04 to 370.4 nucleotides in Table 2
- tau = eta/p =
per data set, e.g., 0.44 to 20.90 in Table 1 and Table 2
- r2, r3 =
per data set, e.g., r2 from 0.13 to 1.52, r3 from 1.56 to 19.60 in Table 1
assumptions (6)
- domain assumption Fixed IGC tract lengths follow a geometric distribution with parameter p, mean 1/p.
- domain assumption IGC initiation and fixation rate is independent of the sequence divergence between donor and recipient paralogs.
- domain assumption Edge effects are ignored: the expected IGC rate is identical at all sites.
- domain assumption Simultaneous point mutations at two sites are negligible, so changes that modify both sites are exclusively attributed to IGC.
- standard math Composite likelihood estimates are asymptotically unbiased.
- ad hoc to paper For the intron analysis, all five groups of introns share the same parameter values, equivalent to assuming the duplications occurred at the same time.
Cite this review
Pith. "Pith review of A phylogenetic approach disentangles interlocus gene conversion tract length and initiation rate." pith.science (2026). https://pith.science/paper/CMXL4CFB
@misc{pith2026190808608,
  author       = {Pith},
  title        = {Pith review of: A phylogenetic approach disentangles interlocus gene conversion tract length and initiation rate},
  year         = {2026},
  howpublished = {\url{https://pith.science/paper/CMXL4CFB}},
  note         = {Machine review of arXiv:1908.08608}
}
read the original abstract
Interlocus gene conversion (IGC) homogenizes paralogs. Little is known regarding the mutation events that cause IGC and even less is known about the IGC mutations that experience fixation. To disentangle the rates of fixed IGC mutations from the tract lengths of these fixed mutations, we employ a composite likelihood procedure. We characterize the procedure with simulations. We apply the procedure to duplicated primate introns and to protein-coding paralogs from both yeast and primates. Our estimates from protein-coding data concerning the mean length of fixed IGC tracts were unexpectedly low and are associated with high degrees of uncertainty. In contrast, our estimates from the primate intron data had lengths in the general range expected from IGC mutation studies. While it is challenging to separate the rate at which fixed IGC mutations initiate from the average number of nucleotide positions that these IGC events affect, all of our analyses indicate that IGC is responsible for a substantial proportion of evolutionary change in duplicated regions. Our results suggest that IGC should be considered whenever the evolution of multigene families is examined.
Figures
Figures from the paper (2 more)
Reference graph
Works this paper leans on
-
[1]
N., Chuzhanova, N., F´ erec, C., and Patrinos, G
Chen, J.-M., Cooper, D. N., Chuzhanova, N., F´ erec, C., and Patrinos, G. P. 2007. Gene conversion: mechanisms, evolution and human disease. Nature Reviews Genetics , 8(10): 762–775
work page 2007
-
[2]
Luedi, P., Choi, S., et al. 2004. The ashbya gossypii genome as a tool for mapping the ancient saccharomyces cerevisiae genome. Science, 304(5668): 304–307
work page 2004
-
[3]
Marck, C., Neuv´ eglise, C., Talla, E.,et al. 2004. Genome evolution in yeasts. Nature, 430(6995): 35–44
work page 2004
-
[4]
Felsenstein, J. 1981. Evolutionary trees from dna sequences: a maximum likelihood approach. Journal of molecular evolution , 17(6): 368–376
work page 1981
-
[5]
Goldman, N. 1993. Statistical tests of models of dna substitution. Journal of Molecular Evolution , 36: 182–198
work page 1993
-
[6]
Harpak, A., Lan, X., Gao, Z., and Pritchard, J. K. 2017. Frequent nonallelic gene conversion on the human lineage and its effect on the divergence of gene duplicates. Proceedings of the National Academy of Sciences , 114(48): 12779–12784
work page 2017
-
[7]
Hasegawa, M., Kishino, H., and Yano, T.-a. 1985. Dating of the human-ape splitting by a molecular clock of mitochondrial dna. Journal of molecular evolution , 22(2): 160–174
work page 1985
-
[8]
Ji, X. 2017. Phylogenetic approaches for quantifying interlocus gene conversion (doc- toral dissertation). North Carolina State University Theses and Dissertations Database. http://www.lib.ncsu.edu/resolver/1840.20/34873
work page 2017
Show all 27 references
-
[9]
Ji, X., Griffing, A., and Thorne, J. L. 2016. A phylogenetic approach finds abundant interlocus gene conversion in yeast. Molecular biology and evolution , 33(9): 2469–2476
2016
-
[10]
and Standley, D
Katoh, K. and Standley, D. M. 2013. Mafft multiple sequence alignment software version 7: im- provements in performance and usability. Molecular biology and evolution , 30(4): 772–780. 23
2013
-
[11]
W., and Lander, E
Kellis, M., Birren, B. W., and Lander, E. S. 2004. Proof and evolutionary analysis of ancient genome duplication in the yeast saccharomyces cerevisiae. Nature, 428(6983): 617–624
2004
-
[12]
Kent, J. T. 1982. Robust properties of likelihood ratio tests. Biometrika, 69(1): 19–27
1982
-
[13]
and Conery, J
Lynch, M. and Conery, J. S. 2000. The evolutionary fate and consequences of duplicate genes. Science, 290(5494): 1151–1155
2000
-
[14]
P., Kado, T., and Innan, H
Mansai, S. P., Kado, T., and Innan, H. 2011. The rate and tract length of gene conversion between duplicated genes. Genes, 2(2): 313–331
2011
-
[15]
McVean, G., Awadalla, P., and Fearnhead, P. 2002. A coalescent-based method for detecting and estimating recombination from gene sequences. Genetics, 160(3): 1231–1241
2002
-
[16]
Muse, S. V. and Gaut, B. S. 1994. A likelihood approach for comparing synonymous and nonsyn- onymous nucleotide substitution rates, with application to the chloroplast genome. Molecular biology and evolution , 11(5): 715–724
1994
-
[17]
A., Mathews, D
Nasrallah, C. A., Mathews, D. H., and Huelsenbeck, J. P. 2010. Quantifying the impact of dependent evolution among sites in phylogenetic inference. Systematic biology , 60(1): 60–73
2010
-
[18]
Oliphant, T. E. 2007. Python for scientific computing. Computing in Science & Engineering , 9(3)
2007
-
[19]
H., Ober- maier, B., Urrestarazu, L., Aert, R., Albermann, K., et al
Philippsen, P., Kleine, K., P¨ ohlmann, R., D¨ usterh¨ oft, A., Hamberg, K., Hegemann, J. H., Ober- maier, B., Urrestarazu, L., Aert, R., Albermann, K., et al. 1997. The nucleotide sequence of saccharomyces cerevisiae chromosome xiv and its evolutionary implications. Nature, 3...
1997
-
[20]
M., Jones, D
Robinson, D. M., Jones, D. T., Kishino, H., Goldman, N., and Thorne, J. L. 2003. Protein evolution with dependence among codons due to tertiary structure. Molecular Biology and Evolution , 20(10): 1692–1704
2003
-
[21]
F., Dyer, K
Rosenberg, H. F., Dyer, K. D., Tiffany, H. L., and Gonzalez, M. 1995. Rapid evolution of a unique family of primate ribonuclease genes. Nature genetics , 10(2): 219–223
1995
-
[22]
Teshima, K. M. and Innan, H. 2008. Neofunctionalization of duplicated genes under the pressure of gene conversion. Genetics, 178(3): 1385–1398. 24
2008
-
[23]
Varin, C., Reid, N., and Firth, D. 2011. An overview of composite likelihood methods. Statistica Sinica, 21: 5–42
2011
-
[24]
Walsh, B. 2003. Population-genetic models of the fates of duplicate genes. Genetica, 118(2-3): 279–294
2003
-
[25]
Walt, S. v. d., Colbert, S. C., and Varoquaux, G. 2011. The numpy array: a structure for efficient numerical computation. Computing in Science & Engineering , 13(2): 22–30
2011
-
[26]
Wolfe, K. H. and Shields, D. C. 1997. Molecular evidence for an ancient duplication of the entire yeast genome. Nature, 387(6634): 708–713
1997
-
[27]
EDN/ECP” row represents the primate EDN/ECP data set. The “Introns
Zhang, J., Rosenberg, H. F., and Nei, M. 1998. Positive darwinian selection after gene duplication in primate ribonuclease genes. Proceedings of the National Academy of Sciences , 95(7): 3708–3713. 25 Table 1: HKY+IS-IGC results. HKY MG94 Paralog Pair LnL Diff τ r 2 r3 Prop Pro...
1998
Reviewed August 14, 2026 · model on record in the stance chip above.
Discussion (0). Continue with ORCID to comment.