REVIEW 3 major objections 6 minor 66 references
Timing results of 22 years for PSR J0922+0638
T0 review · 3 major / 6 minor · reviewed 2026-08-06 · deepseek-v4-flash
Pith's one-line read Across 22 years of radio-timing data, PSR J0922+0638 shows a previously unreported small glitch about 1800 days before its known large glitch, plus ten quasi-periodic slow glitches that match the pulsar's spin-down oscillations.
desk verdict A solid single-pulsar timing paper with a credible new small glitch and five plausible new slow glitches, but the 553-day quasi-periodicity claim is softer than the abstract suggests because the event list rests on visual fits without an explicit red-noise-versus-events model comparison. read the letter →
The pith
A machine-rendered reading of the paper's core claim, the machinery that carries it, and where it could break.
The reading
What carries the argument
The analysis is carried by the standard Taylor-expansion model of the pulsar rotation phase, $\phi(t)=\phi_0+\nu(t-t_0)+\tfrac12\dot\nu(t-t_0)^2+\tfrac16\ddot\nu(t-t_0)^3$, corrected by glitch terms $\Delta\phi+\Delta\nu(t-t_g)+\tfrac12\Delta\dot\nu(t-t_g)^2$ that capture the permanent phase, frequency, and spin-down jumps at each glitch epoch. Slow glitches are identified by fitting the timing data in sliding 150–250 day windows to recover $\nu$ and $\dot\nu$ at successive epochs, and the sawtooth spin-frequency signatures of the slow glitches are read off from those window fits. The timing-noise spectrum is characterized by a power-law model $P(f)=A/[1+(f/f_c)^2]^{(\alpha/2)}$, whose spectral index $\alpha$ is measured separately before and after the large glitch.
What would settle it
Re-fit the full set of arrival times with a single model that simultaneously fits red noise and candidate slow-glitch events; if the best-fit solution needs no discrete spin-up events, or if the implied event spacing stops being quasi-periodic (for example, the 553(21) day interval is not recovered), then the central slow-glitch claim is refuted.
Extended reading notes
Core claim
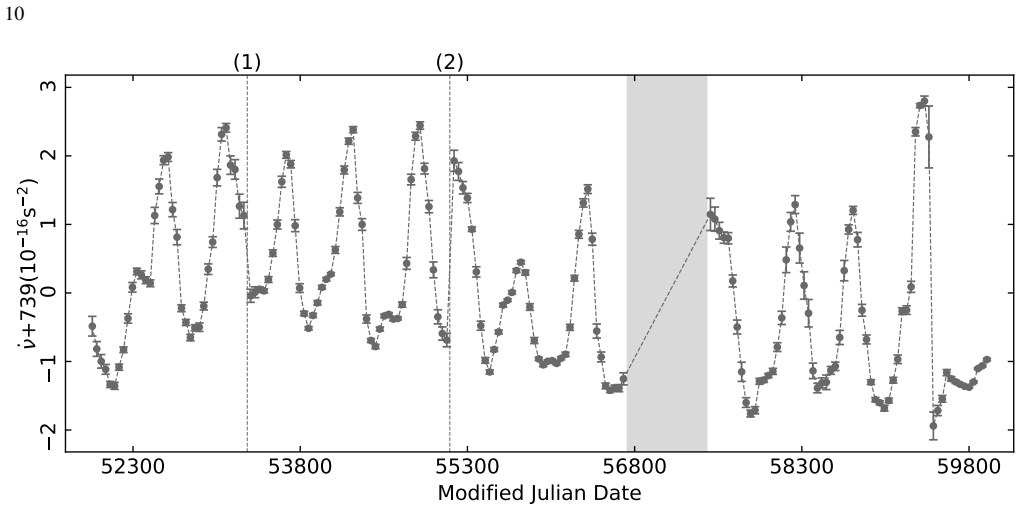
The central discovery is a previously unreported small glitch in PSR J0922+0638 at MJD $53325(3)$ with $\Delta\nu/\nu\sim0.79(6)\times10^{-9}$, followed by the known large glitch, plus a sequence of ten slow glitches—five new—with fractional frequency increases from $1.13(1)\times10^{-9}$ to $4.08(2)\times10^{-9}$ and a quasi-periodic spacing of $553(21)$ days. The same data show that the timing-noise spectral index steepens from $-6.0$ before the large glitch to $-5.3$ afterward and that the spin-down rate $\dot\nu$ oscillates with a modulation period of $537(24)$ days before the MJD 56716 data gap and $600(58)$ days after. The paper argues that these oscillations and the quasi-periodic slow glitches are connected, with the large glitch altering the spin-down behaviour and the magnetosphere possibly switching between two stable states.
Load-bearing premise
The catalogue of ten slow glitches assumes that the sawtooth spin-frequency features recovered by the 150–250 day window fits are discrete spin-up events, not products of the strong red noise that dominates the residuals; if a red-noise-only model could reproduce those features, the event count and the 553-day periodicity would not stand.
Editorial extensions
If this is right
- The discovered small glitch means the large glitch at MJD 55142(7) was not an isolated event but was preceded by a smaller spin-up roughly 1800 days earlier, so the pulsar's glitch history contains at least two normal glitches in 22 years.
- The ten slow glitches extend the known slow-glitch record of this pulsar from five previously reported events (glitches 8–12) to ten complete events (through 17), with five new detections spanning the pre- and post-large-glitch eras.
- The quasi-periodic spacing of $553(21)$ days between slow glitches matches the roughly 500–600 day oscillations in $\dot\nu$, supporting the paper's proposal that slow glitches drive the periodic spin-down modulation.
- The change in timing-noise spectral index from $-6.0$ to $-5.3$ across the large glitch indicates the glitch altered the noise process, moving it from a pure spin-down (torque) random walk toward a mixed angular-velocity and torque random walk.
Reading between the lines
- If the 553-day quasi-periodic slow-glitch cadence holds, the next slow glitch after MJD 60034 should begin around MJD 60850–61100; a targeted search in newer high-cadence data could test this prediction directly.
- The paper's proposal that magnetospheric state switching produces both slow glitches and $\dot\nu$ oscillations implies that the largest slow glitches should be accompanied by measurable changes in pulse profile or polarisation; the paper notes profile variations in this pulsar but does not measure them in this work.
- Because the slow-glitch catalogue is derived from window fits that are sensitive to red noise, re-analyzing the same arrival times with an explicit red-noise-plus-events model would either confirm the ten events or reduce them to fewer genuine discontinuities; the paper's own power spectrum shows no significant peaks, so this test remains open.
Editorial analysis
A structured set of objections, weighed in public.
Referee Report
Summary. The paper presents a 22-year timing analysis of PSR J0922+0638 using Nanshan 26 m and MeerKAT data. It reports a previously unknown small glitch (glitch 1) at MJD 53325(3) with fractional frequency jump 0.79(6) x 10^-9, a reanalysis of the known large glitch (glitch 2), ten slow glitches (five new) with a claimed mean interval of 553(21) days, a change in timing-noise spectral index from -6.0 before glitch 2 to -5.3 afterward, and quasi-periodic modulation of nu-dot with periods of 537(24) d and 600(58) d before and after the data gap. The central new claims are the small glitch and the slow-glitch catalog with its quasi-periodicity.
Significance. If the detections are robust, the paper adds a useful data point to the sparse slow-glitch population and strengthens the evidence that PSR J0922+0638 exhibits quasi-periodic slow glitches that may be connected to its spin-down-rate modulation. The paper has notable strengths: a long, mostly homogeneous Nanshan data set supplemented by MeerKAT, standard TEMPO2-based timing fits, a quoted detectability criterion for the small glitch, and consistency with previously reported glitch parameters. However, the slow-glitch catalog and the 553-day periodicity rest on visual classification of sliding-window fits in the presence of strong red noise, and the paper itself reports a smooth power spectrum with no significant peaks. That tension makes the central new claims not yet fully established; they require a quantitative red-noise-plus-events analysis before publication.
major comments (3)
- [Sec. 3.2 / Table 4] The identification of the ten slow glitches and the derived mean interval of 553(21) days rests on visual classification of sawtooth-like features in sliding-window fits of nu and nu-dot over 150-250 day windows. No detection statistic, false-alarm probability, or model comparison is given, and the quoted parameter uncertainties in Table 4 are least-squares errors that do not include the red-noise variability that the authors themselves describe as strong in Sec. 3.3. Because a steep red-noise process can produce apparent quasi-regular jumps in nu-dot, the event catalog and the quasi-periodicity claim need support from an explicit model that includes both red noise and candidate glitch events, for example via likelihood-ratio tests or injection-recovery simulations, reporting the false-alarm rate for each of events 8-17. This is load-bearing for the abstract's headline claims.
- [Sec. 3.3 / Table 4] The spectral indices -6.0 and -5.3 are quoted without uncertainties, and the two fitted segments differ in length, cadence, and contain different glitch activity. A difference of 0.7 may not be significant once realistic uncertainties are propagated. Please provide confidence intervals or a formal model-selection comparison (e.g., a single power-law index for the whole span versus two segments) before claiming that glitch 2 changed the timing-noise spectral index. In addition, if slow glitches are genuine discrete events, their power is included in the same PSD fits; the potential bias from unmodeled events should be assessed.
- [Sec. 3.1 / Eq. (4)] The small glitch is more defensible than the slow glitches because the post-fit residuals in Fig. 2(d) appear white locally, but its significance should still be quantified in a red-noise framework. Equation (4) uses sigma_phi = 0.01 rotations as the relevant phase scatter, yet the fitting span shows strong red noise, and the detectability limit and quoted uncertainty do not account for covariance between the glitch parameters and the red-noise realization. A local comparison of models with and without a glitch, with red noise included, would make the new small-glitch claim robust and would also justify the claimed 0.79(6) x 10^-9 amplitude.
minor comments (6)
- [Sec. 3.2 / Table 4] The text states that Delta-nu_max for slow glitch 12 is 4.97(3) nHz, but Table 4 lists 4.79(3) nHz; please reconcile the discrepancy.
- [Sec. 1 / Sec. 3.2] The Introduction says Shabanova (2010) reported twelve slow glitch events, while Sec. 3.2 and Table 4 treat only slow glitches 8-12 as previously reported and note that slow glitches 1-7 came from Shabanova (2010). The total number and numbering of previously reported slow glitches should be clarified.
- [Sec. 4 / Fig. 8(d)] The cumulative quantities Sum Delta-nu_max, Sum T_rise, and Sum T_inter are trivially correlated by construction because they are cumulative sums of the same event sequence; the linear fits in Fig. 8(d) should not be presented as independent evidence of a physical correlation unless the analysis is performed on detrended or independent quantities.
- [Sec. 3.1 / Eq. (4)] Equation (4) introduces Delta T, Delta nu-dot, and sigma_phi only in the surrounding text; please define all symbols and state their units explicitly, and justify the choice sigma_phi = 0.01 rotations for a data set with strong red noise.
- [Sec. 3.2 / Table 4] The claim that Delta-nu-dot/nu-dot is nearly constant at about -4.6 x 10^-3 is not well supported by Table 4, which shows values ranging from about -4.0 to -5.4 x 10^-3 with a -1.7 x 10^-3 outlier; please report a weighted mean and scatter or describe the range more carefully.
- [Sec. 3.4] The statement that the Lomb-Scargle and autocorrelation results together offer evidence for a period change should be tempered, because the post-gap period of 600(58) days is within roughly one sigma of the pre-gap value of 537(24) days; a proper significance test of the period change should be reported.
Circularity Check
No load-bearing circularity in the main glitch and period measurements; one self-referential cumulative-sum correlation in Fig. 8(d) is used as physical evidence but does not support the central detections.
-
other
[Sec. 4 (Discussion), Fig. 8(d)]
"Interestingly, in panel (d) of Fig. 8, we observed clear linear correlations between P ∆νmax and P Trise, as well as between P ∆νmax and P Tinter, confirmed through linear fitting (grey curve). ... Given the linear correlation between P ∆νmax, P Tinter, and P Trise, the slow glitches in PSR J0922+0638 may originate from a similar superfluid process."
The plotted variables are cumulative sums over the same ordered list of slow glitches: ΣΔνmax, ΣTrise, and ΣTinter are all monotonically non-decreasing functions of event number. For any positive sequences a_i and b_i, the cumulative sums A_k = Σ_{i≤k} a_i and B_k = Σ_{i≤k} b_i will produce a rising, approximately linear scatter regardless of whether a_i and b_i are correlated. The reported linear correlation is therefore an arithmetic property of summation, not independent evidence linking glitch amplitude to rise time or interval, and it cannot by itself support the superfluid-origin conclusion. This panel is interpretive, not load-bearing for the main glitch detections or period measurements.
full rationale
The paper's central results are obtained from direct timing fits: glitch 1 is fitted from local residuals around MJD 53325 (Sec. 3.1, Table 3); the ten slow glitches are parameterized from 150-250 day sliding-window fits (Sec. 3.2, Table 4); the timing-noise spectral indices and the 537/600 day modulation periods are measured from the same data but are not used as inputs to one another. No equation reduces to another by construction, and no load-bearing claim rests on a self-citation chain. The slow-glitch catalog does rely on visual classification of features against red noise, but that is a model-comparison/correctness concern, not circularity. The only self-referential element is the cumulative-sum correlation in Fig. 8(d), which is a spurious-correlation artifact rather than a prediction. Because it is an interpretive side-plot and the main detections stand independently, the circularity score is low.
Assumptions & free parameters
free parameters (3)
- Slow-glitch fitting window length =
150-250 days
- Timing-noise spectral indices =
alpha = -6.0 and -5.3
- nu-dot modulation periods before and after the gap =
537(24) d and 600(58) d
assumptions (7)
- standard math Pulse phase is expanded as a Taylor series with spin frequency and its derivatives (Eq. 1).
- domain assumption Glitch-induced permanent changes enter the phase as Delta phi + Delta nu (t - tg) + 0.5 Delta nu-dot (t - tg)^2 (Eq. 2).
- domain assumption Timing noise PSD has the power-law form P(f) = A / (1 + (f/fc)^2)^(alpha/2) (Eq. 3).
- ad hoc to paper Minimum detectable glitch size follows Delta nu_lim = max(Delta T |Delta nu-dot| / 2, (2 |Delta nu-dot| sigma_phi)^(1/2)) with inputs Delta T = 6 d, |Delta nu-dot| = 3.3e-17 s^-2, sigma_phi = 0.01 rotations (Eq. 4).
- ad hoc to paper Slow glitches are identified by fitting nu and nu-dot in sliding 150-250 day windows and visually classifying sawtooth features as distinct events (Sec 3.2).
- domain assumption The roughly 700-day data gap at MJD 56716 is treated as non-informative, and periods are estimated separately before and after the gap (Sec 3.4).
- domain assumption Barycentric arrival-time conversion uses the DE440 ephemeris and TCB timescale (Sec 2.2).
Cite this review
Pith. "Pith review of Timing results of 22 years for PSR J0922+0638." pith.science (2026). https://pith.science/paper/CO4JDIPO
@misc{pith2026250622765,
  author       = {Pith},
  title        = {Pith review of: Timing results of 22 years for PSR J0922+0638},
  year         = {2026},
  howpublished = {\url{https://pith.science/paper/CO4JDIPO}},
  note         = {Machine review of arXiv:2506.22765}
}
abstract
We conducted a timing analysis of PSR J0922+0638 (B0919+06) using data from the Nanshan 26 m radio telescope and the MeerKAT telescope, spanning from January 2001 to March 2023. During this 22-year period, we discovered a previously unreported small glitch (glitch 1) before the well-known large glitch (glitch 2), occurring at ${\rm MJD} \sim 53325(3)$, with a frequency jump amplitude of $\Delta \nu/\nu \sim 0.79(6) \times 10^{-9}$. We also identified ten slow glitch events, half of which were newly detected. These slow glitches occurred quasi-periodically, with an average interval of approximately 553(21) days, fractional frequency changes ranging from $\Delta \nu/\nu \sim 1.13(1) \times 10^{-9}$ to $4.08(5) \times 10^{-9}$, and a maximum fractional change in the first derivative of the frequency of $\Delta \dot{\nu}/\dot{\nu} \sim -4.6 \times 10^{-3}$. Additionally, our timing noise analysis reveals a change in the spectral index for noise power before and after glitch 2, with values of $-6.0$ and $-5.3$, respectively, likely due to this large glitch. Throughout the entire observation period, the first derivative of the spin frequency ($\dot{\nu}$) showed a periodic structure. The possible modulation period was estimated to be 537(24) days before the 700-day data gap at MJD 56716 and 600(58) days afterward. We discuss the periodic oscillations in pulsar rotation as a possible manifestation of spin-down noise and quasi-periodic slow glitches.
Figures


Figures from the paper (5 more)



Reference graph
Works this paper leans on
-
[1]
2006, MNRAS, 365, 653, doi: 10.1111/j.1365-2966.2005.09745.x
Akgün, T., Link, B., & Wasserman, I. 2006, MNRAS, 365, 653, doi: 10.1111/j.1365-2966.2005.09745.x
arXiv 2006
-
[2]
Alpar, M. A., Cheng, K. S., & Pines, D. 1989, ApJ, 346, 823, doi: 10.1086/168063
-
[3]
2023, MNRAS, 520, 2813, doi: 10.1093/mnras/stad256
Antonelli, M., Basu, A., & Haskell, B. 2023, MNRAS, 520, 2813, doi: 10.1093/mnras/stad256
-
[4]
Antonopoulou, D., Haskell, B., & Espinoza, C. M. 2022, Reports on Progress in Physics, 85, 126901, doi: 10.1088/1361-6633/ac9ced
-
[5]
Archibald, R. F., Kaspi, V . M., Ng, C. Y ., et al. 2013, Nature, 497, 591, doi: 10.1038/nature12159
-
[6]
2020, PASA, 37, e028, doi: 10.1017/pasa.2020.19
Bailes, M., Jameson, A., Abbate, F., et al. 2020, PASA, 37, e028, doi: 10.1017/pasa.2020.19
-
[7]
2022, MNRAS, 510, 4049, doi: 10.1093/mnras/stab3336
Basu, A., Shaw, B., Antonopoulou, D., et al. 2022, MNRAS, 510, 4049, doi: 10.1093/mnras/stab3336
-
[8]
Boynton, P. E., Groth, E. J., Hutchinson, D. P., et al. 1972, ApJ, 175, 217, doi: 10.1086/151550
Show all 66 references
-
[9]
Thorsett, S. E. 2003, AJ, 126, 3090, doi: 10.1086/379559
2003 doi
-
[10]
W., et al
Carli, E., Levin, L., Stappers, B. W., et al. 2024, MNRAS, 531, 2835, doi: 10.1093/mnras/stae1310
2024 doi
-
[11]
Verbiest, J. P. W. 2011, MNRAS, 418, 561, doi: 10.1111/j.1365-2966.2011.19505.x
2011
- [12]
-
[14]
2021, A&A, 647, A25, doi: 10.1051/0004-6361/202039044
Scherer, A. 2021, A&A, 647, A25, doi: 10.1051/0004-6361/202039044
2021 doi
-
[15]
Lyne, A. G. 2014, MNRAS, 440, 2755, doi: 10.1093/mnras/stu395
2014 doi
-
[16]
L., Peng, L.-X., et al
Han, J., Han, J. L., Peng, L.-X., et al. 2016, MNRAS, 456, 3413, doi: 10.1093/mnras/stv2891
2016 doi
-
[17]
2015, International Journal of Modern Physics D, 24, 1530008, doi: 10.1142/S0218271815300086
Haskell, B., & Melatos, A. 2015, International Journal of Modern Physics D, 24, 1530008, doi: 10.1142/S0218271815300086
2015 doi
-
[18]
G., & Kramer, M
Hobbs, G., Lyne, A. G., & Kramer, M. 2010, MNRAS, 402, 1027, doi: 10.1111/j.1365-2966.2009.15938.x
2010
-
[21]
W., van Straten, W., & Manchester, R
Hotan, A. W., van Straten, W., & Manchester, R. N. 2004, PASA, 21, 302, doi: 10.1071/AS04022
2004 doi
-
[22]
N., & Shabanova, T
Istomin, Y . N., & Shabanova, T. V . 2007, in WE-Heraeus Seminar on Neutron Stars and Pulsars 40 years after the Discovery, ed. W. Becker & H. H. Huang, 153
2007
-
[23]
J., et al
Johnston, S., Karastergiou, A., Keith, M. J., et al. 2020, MNRAS, 493, 3608, doi: 10.1093/mnras/staa516
2020 doi
-
[24]
J., Shannon, R
Keith, M. J., Shannon, R. M., & Johnston, S. 2013, MNRAS, 432, 3080, doi: 10.1093/mnras/stt660
2013 doi
-
[25]
J., Johnston, S., Karastergiou, A., et al
Keith, M. J., Johnston, S., Karastergiou, A., et al. 2024, MNRAS, 530, 1581, doi: 10.1093/mnras/stae937
2024 doi
-
[26]
Kerr, M., Hobbs, G., Johnston, S., & Shannon, R. M. 2016, MNRAS, 455, 1845, doi: 10.1093/mnras/stv2457
2016 doi
-
[27]
F., Yuan, J
Kou, F. F., Yuan, J. P., Wang, N., Yan, W. M., & Dang, S. J. 2018, MNRAS, 478, L24, doi: 10.1093/mnrasl/sly068
2018 doi
-
[28]
P., et al
Lentati, L., Alexander, P., Hobson, M. P., et al. 2014, MNRAS, 437, 3004, doi: 10.1093/mnras/stt2122
2014 doi
-
[29]
2022, ApJ, 931, 103, doi: 10.3847/1538-4357/ac6bf7
Liu, J., Wang, H.-G., Shen, Z.-Q., et al. 2022, ApJ, 931, 103, doi: 10.3847/1538-4357/ac6bf7
2022 doi
-
[30]
2021, ApJ, 912, 58, doi: 10.3847/1538-4357/abf140
Liu, J., Wang, H.-G., Yan, Z., et al. 2021, ApJ, 912, 58, doi: 10.3847/1538-4357/abf140
2021 doi
-
[31]
P., Ge, M
Liu, P., Yuan, J. P., Ge, M. Y ., et al. 2024, MNRAS, 533, 4274, doi: 10.1093/mnras/stae1973 —. 2025, MNRAS, 537, 1720, doi: 10.1093/mnras/staf101
2024 doi
-
[32]
2010, Science, 329, 408, doi: 10.1126/science.1186683
Lyne, A., Hobbs, G., Kramer, M., Stairs, I., & Stappers, B. 2010, Science, 329, 408, doi: 10.1126/science.1186683
2010 doi
-
[33]
N., Lyne, A
Manchester, R. N., Lyne, A. G., Taylor, J. H., et al. 1978, MNRAS, 185, 409, doi: 10.1093/mnras/185.2.409
1978 doi
-
[34]
N., Hobbs, G., Bailes, M., et al
Manchester, R. N., Hobbs, G., Bailes, M., et al. 2013, PASA, 30, e017, doi: 10.1017/pasa.2012.017
2013 doi
-
[35]
S., Folkner, W
Park, R. S., Folkner, W. M., Williams, J. G., & Boggs, D. H. 2021, AJ, 161, 105, doi: 10.3847/1538-3881/abd414
2021 doi
-
[36]
M., Johnston, S., et al
Parthasarathy, A., Shannon, R. M., Johnston, S., et al. 2019, MNRAS, 489, 3810, doi: 10.1093/mnras/stz2383
2019 doi
-
[37]
Peng, C., & Xu, R. X. 2008, MNRAS, 384, 1034, doi: 10.1111/j.1365-2966.2007.12575.x
2008
-
[38]
Bassa, C. G. 2015, MNRAS, 446, 1380, doi: 10.1093/mnras/stu2187
2015 doi
- [39]
-
[40]
Radhakrishnan, V ., & Manchester, R. N. 1969, Nature, 222, 228, doi: 10.1038/222228a0
1969 doi
-
[41]
M., Perera, B
Rajwade, K. M., Perera, B. B. P., Stappers, B. W., et al. 2021, MNRAS, 506, 5836, doi: 10.1093/mnras/stab1942
2021 doi
-
[42]
M., Rodriguez, C., & Wright, G
Rankin, J. M., Rodriguez, C., & Wright, G. A. E. 2006, MNRAS, 370, 673, doi: 10.1111/j.1365-2966.2006.10512.x
2006
-
[43]
E., & Downs, G
Reichley, P. E., & Downs, G. S. 1969, Nature, 222, 229, doi: 10.1038/222229a0
1969 doi
-
[44]
2018, A&A, 615, A73, doi: 10.1051/0004-6361/201732408 14
Rigoselli, M., & Mereghetti, S. 2018, A&A, 615, A73, doi: 10.1051/0004-6361/201732408 14
2018 doi
-
[45]
Scargle, J. D. 1982, ApJ, 263, 835, doi: 10.1086/160554
1982 doi
-
[46]
D., & Lorimer, D
Seymour, A. D., & Lorimer, D. R. 2013, MNRAS, 428, 983, doi: 10.1093/mnras/sts060
2013 doi
-
[47]
Shabanova, T. V . 1998, A&A, 337, 723 —. 2007, Ap&SS, 308, 591, doi: 10.1007/s10509-007-9302-5 —. 2009, ApJ, 700, 1009, doi: 10.1088/0004-637X/700/2/1009 —. 2010, ApJ, 721, 251, doi: 10.1088/0004-637X/721/1/251
1998 doi
-
[48]
V ., Pugachev, V
Shabanova, T. V ., Pugachev, V . D., & Lapaev, K. A. 2013, ApJ, 775, 2, doi: 10.1088/0004-637X/775/1/2
2013 doi
-
[49]
2018, MNRAS, 477, L25, doi: 10.1093/mnrasl/sly049
Shaifullah, G., Tiburzi, C., Osłowski, S., et al. 2018, MNRAS, 477, L25, doi: 10.1093/mnrasl/sly049
2018 doi
-
[50]
M., Lentati, L
Shannon, R. M., Lentati, L. T., Kerr, M., et al. 2016, MNRAS, 459, 3104, doi: 10.1093/mnras/stw842
2016 doi
-
[51]
J., Lyne, A
Shaw, B., Keith, M. J., Lyne, A. G., et al. 2021, MNRAS, 505, L6, doi: 10.1093/mnrasl/slab038
2021 doi
-
[52]
W., Weltevrede, P., et al
Shaw, B., Stappers, B. W., Weltevrede, P., et al. 2022, MNRAS, 513, 5861, doi: 10.1093/mnras/stac1156
2022 doi
-
[53]
J., et al
Song, X., Weltevrede, P., Keith, M. J., et al. 2021, MNRAS, 505, 4456, doi: 10.1093/mnras/staa3805
2021 doi
-
[54]
H., Lyne, A
Stairs, I. H., Lyne, A. G., & Shemar, S. L. 2000, Nature, 406, 484, doi: 10.1038/35020010
2000 doi
-
[55]
H., Lyne, A
Stairs, I. H., Lyne, A. G., Kramer, M., et al. 2019, MNRAS, 485, 3230, doi: 10.1093/mnras/stz647
2019 doi
- [56]
-
[57]
M., Orfeo, D
Wahl, H. M., Orfeo, D. J., Rankin, J. M., & Weisberg, J. M. 2016, MNRAS, 461, 3740, doi: 10.1093/mnras/stw1589
2016 doi
-
[58]
N., Zhang, J., et al
Wang, N., Manchester, R. N., Zhang, J., et al. 2001, MNRAS, 328, 855, doi: 10.1046/j.1365-8711.2001.04926.x
2001
-
[59]
G., Yuan, J
Wang, Z., Wen, Z. G., Yuan, J. P., et al. 2024, ApJ, 968, 109, doi: 10.3847/1538-4357/ad46f4
2024 doi
-
[60]
Weltevrede, P., Johnston, S., & Espinoza, C. M. 2011, MNRAS, 411, 1917, doi: 10.1111/j.1365-2966.2010.17821.x
2011
-
[61]
N., Hobbs, G., et al
Yu, M., Manchester, R. N., Hobbs, G., et al. 2013, MNRAS, 429, 688, doi: 10.1093/mnras/sts366
2013 doi
-
[62]
2019, Science China Physics, Mechanics, and Astronomy, 62, 959504, doi: 10.1007/s11433-018-9358-8
Yu, Y .-Z., Peng, B., Liu, K., et al. 2019, Science China Physics, Mechanics, and Astronomy, 62, 959504, doi: 10.1007/s11433-018-9358-8
2019 doi
-
[63]
2024, Universe, 10, 105, doi: 10.3390/universe10030105
Yuan, J., Wang, N., Dang, S., et al. 2024, Universe, 10, 105, doi: 10.3390/universe10030105
2024 doi
-
[64]
P., Wang, N., Liu, Z
Yuan, J. P., Wang, N., Liu, Z. Y ., & Wang, J. B. 2013, in Neutron Stars and Pulsars: Challenges and Opportunities after 80 years, ed. J. van Leeuwen, V ol. 291, 574–576, doi: 10.1017/S1743921312024921
2013 doi
-
[65]
2022, Universe, 8, 641, doi: 10.3390/universe8120641
Zhou, S., Gügercino˘glu, E., Yuan, J., Ge, M., & Yu, C. 2022, Universe, 8, 641, doi: 10.3390/universe8120641
2022 doi
-
[66]
Q., Zhou, A
Zhou, S. Q., Zhou, A. A., Zhang, J., et al. 2019, Ap&SS, 364, 173, doi: 10.1007/s10509-019-3660-7
2019 doi
-
[67]
Q., Gügercino˘glu, E., Yuan, J
Zhou, S. Q., Gügercino˘glu, E., Yuan, J. P., et al. 2023, MNRAS, 519, 74, doi: 10.1093/mnras/stac3355
2023 doi
-
[68]
Z., Wang, N., Wang, H
Zou, W. Z., Wang, N., Wang, H. X., et al. 2004, MNRAS, 354, 811, doi: 10.1111/j.1365-2966.2004.08241.x
2004
- [69]
Reviewed August 6, 2026 · model on record in the stance chip above.
Discussion (0). Continue with ORCID to comment.