REVIEW 4 major objections 4 minor 24 references
Route Identification in the National Football League
T0 review · 4 major / 4 minor · reviewed 2026-08-14 · deepseek-v4-flash
Pith's one-line read Unsupervised clustering of NFL tracking data can automatically label the routes receivers run, with cluster centers that match the standard route tree.
desk verdict A transparent but unvalidated application of existing curve-clustering methods to NFL routes; the authors know the central claim is unproven. read the letter →
The pith
A machine-rendered reading of the paper's core claim, the machinery that carries it, and where it could break.
The reading
What carries the argument
The central object is a Gaussian mixture of Bézier curves. Each cluster mean is a parametric curve $B(t;\theta)=\sum_{p=0}^{P}\theta_p b_p^P(t)$ written in a Bernstein polynomial basis, so a route is summarized by a small set of control points rather than by a raw time series of coordinates. This representation is what makes trajectories of different durations comparable: every observation is evaluated on a common time scale $t\in[0,1]$. The Expectation-Maximization algorithm carries the estimation: the E-step computes each trajectory's posterior probability of belonging to each cluster, and the M-step updates the Bézier control points, noise variances, and mixing weights by weighted least squares. Preprocessing standardizes every route to a common line of scrimmage, direction, and side, so the clustering sees shape rather than field position.
What would settle it
Take a few hundred passing plays with independently verified human route tags, run the same preprocessing and 30-cluster EM fit, map the clusters to the twelve route labels, and count how often the automatic label agrees with the human tag, with special attention to the comeback-versus-go pair; if agreement on that pair is at or below chance, the claim that the clusters recover true routes is refuted.
Extended reading notes
Core claim
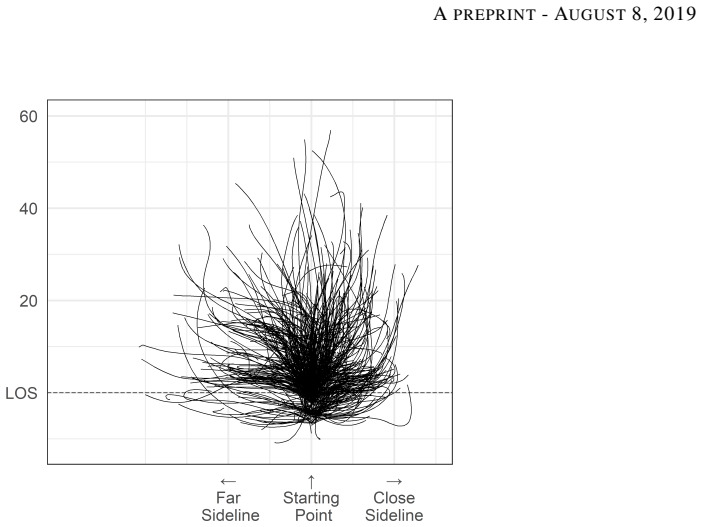
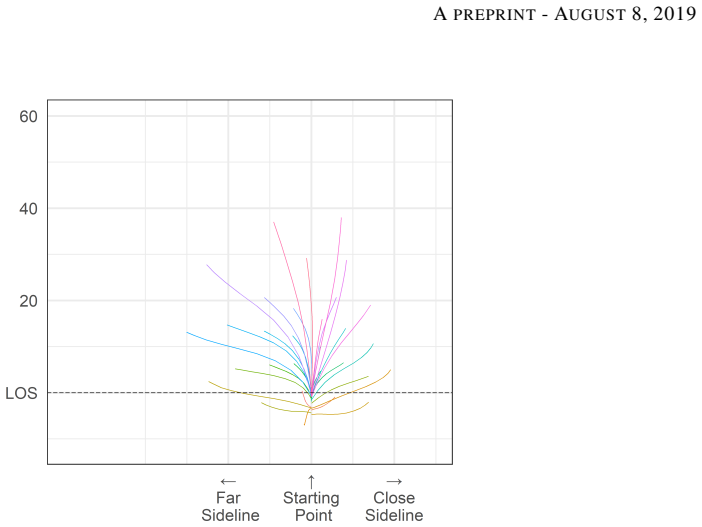
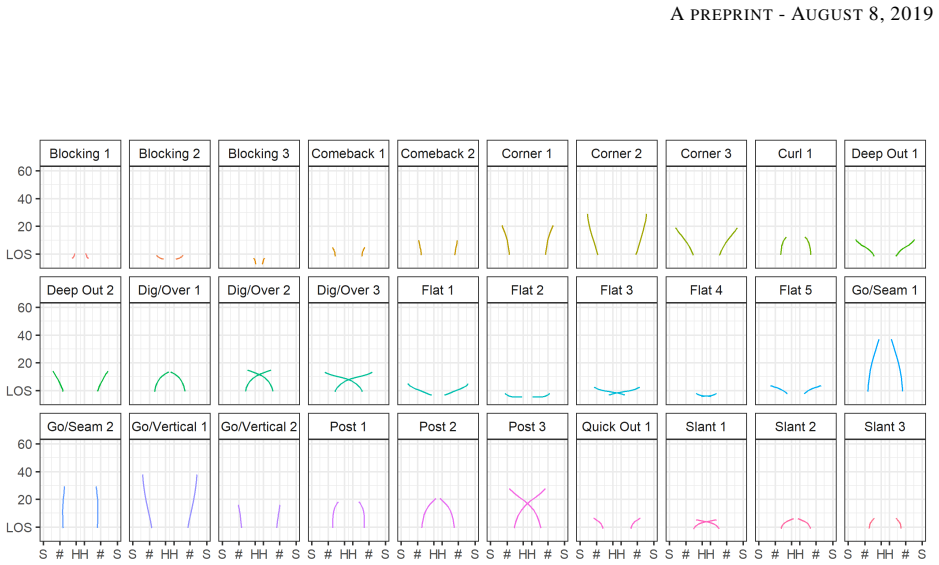
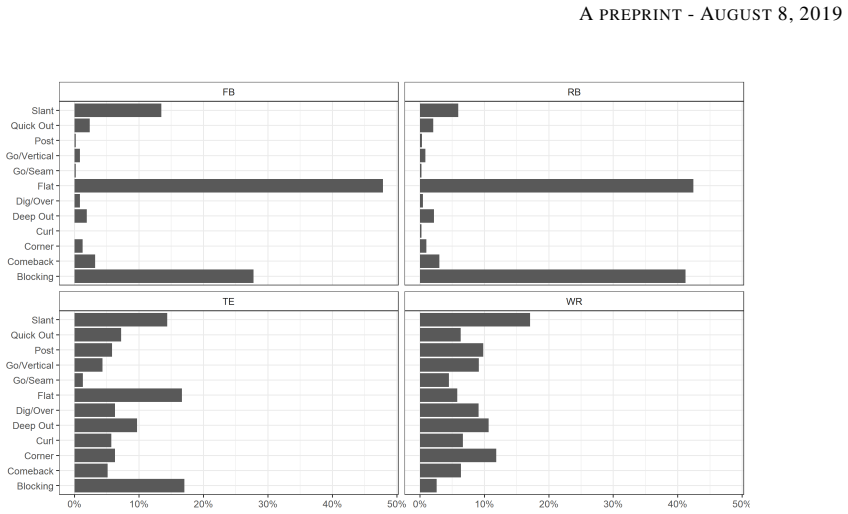
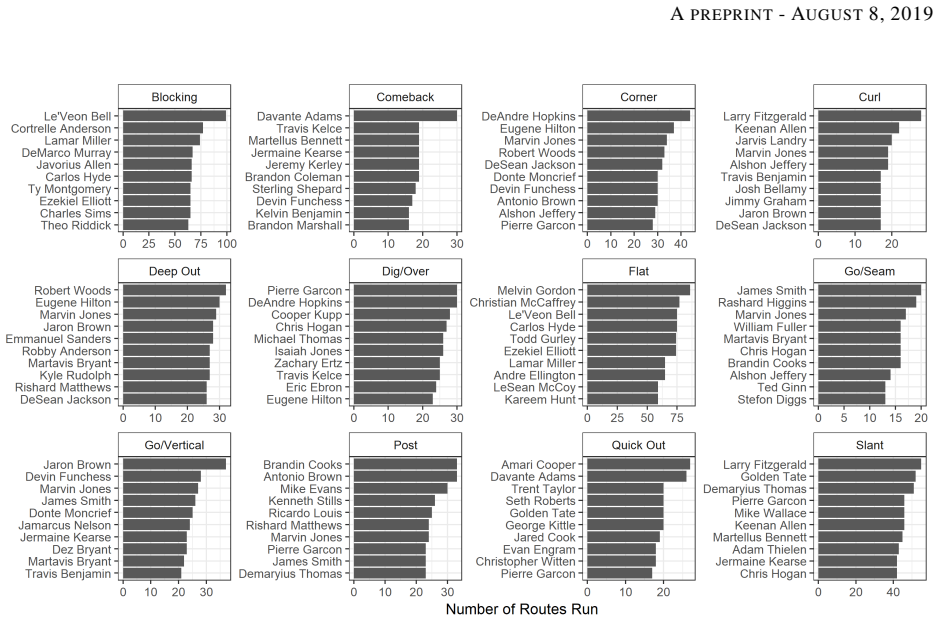
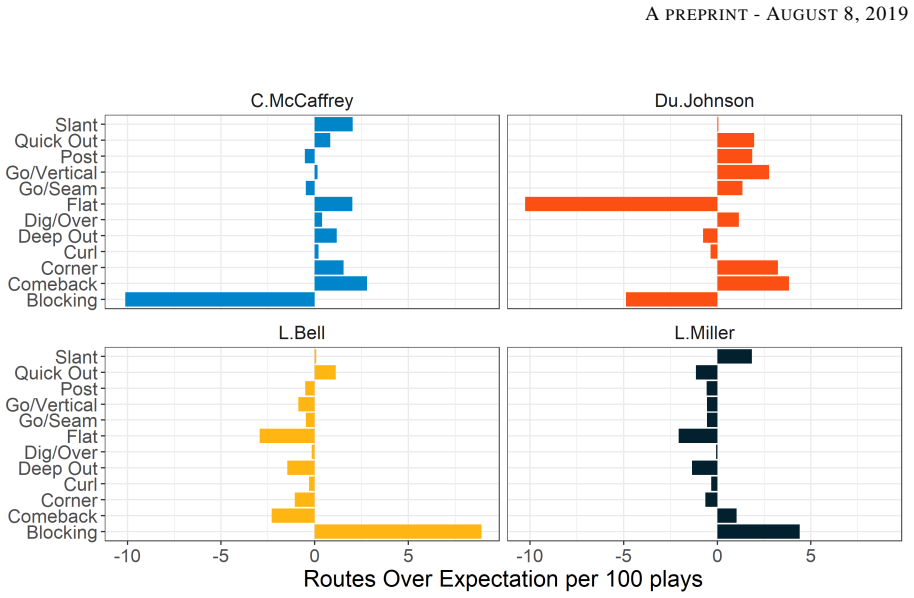
On the paper's own terms, the central discovery is that an unsupervised model-based clustering, in which each cluster mean is a Bézier curve and each observed trajectory is a noisy realization of one of those curves, recovers recognizable route structure from NFL tracking data. The EM algorithm estimates the control points, variances, and mixing weights for 30 clusters; after manual inspection, those clusters are condensed into 12 route groups resembling the standard route tree. The resulting labels show position-appropriate route usage and feed new deployment-aware statistics, including routes run over expectation, targets over expectation, and air yards over expectation. The paper also shows the labels enable film queries by route combination. Because the data set has no ground-truth route names, the authors rely on the match between cluster centers and the route tree plus qualitative football-sense checks rather than a quantitative accuracy measure.
Load-bearing premise
The load-bearing premise is that after standardization the geometric shape of a receiver's path carries enough information to distinguish the intended route, even though the data contain no verified route labels and the authors note that comeback and go routes look nearly identical to the fitted curves.
Editorial extensions
If this is right
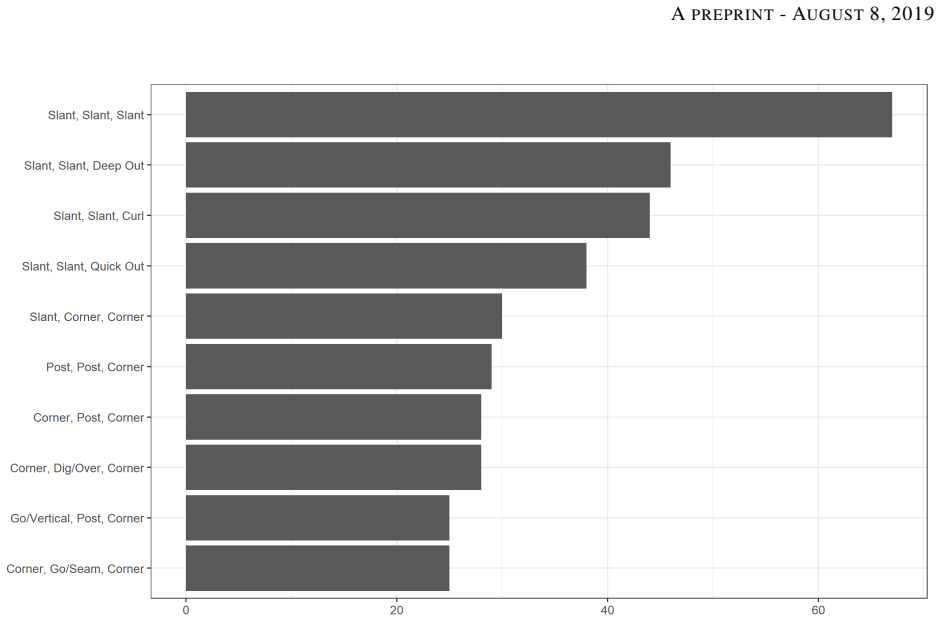
- Route labels can be paired with game film, allowing coaches and analysts to query plays by route combination, such as a flat, in, and post run together.
- Receiver statistics like targets over expectation and air yards over expectation become route-specific, so a player's production can be judged against what is expected given how he is deployed.
- The route distribution by position emerges without position as an input, suggesting the clusters capture real football behavior rather than arbitrary geometric partitions.
- If the fitting is made faster, more than 30 clusters could be estimated, potentially isolating route variants that the coarse grouping merges.
- The labels can support defensive evaluation by identifying which routes a defensive back is asked to cover on each play.
Reading between the lines
- A direct test the authors do not run: fit the same model to a subset of plays with independently verified human route tags and compute the confusion matrix, especially for the comeback-versus-go pair they flag as nearly identical.
- The preprocessing flips mirror-image routes to a common side, so the labels cannot distinguish whether a route was run from the left or right of the formation; side-specific splits would require storing the original orientation.
- The method is mostly sport-agnostic beyond the preprocessing choices, so the same Bézier-mixture EM approach could be applied to movement classification in other sports or to defensive and special-teams trajectories.
Signed reviews
Editorial analysis
A structured set of objections, weighed in public.
Referee Report
Summary. The paper proposes an unsupervised model-based curve clustering method for identifying pass routes run by eligible receivers in NFL tracking data. Each receiver trajectory is represented as a two-dimensional Bézier curve via Bernstein basis polynomials, and a Gaussian mixture model is fit with the Expectation Maximization algorithm. The data consist of 6,963 passing plays and about 34,000 receiver trajectories from the NFL Big Data Bowl. After fitting K=30 clusters, the authors manually label the cluster means with standard football route names and condense them into 12 route groups. They then present descriptive checks such as route frequencies by position and preliminary metrics such as routes run over expectation and targets over expectation. The central claim is that the learned route labels align with the standard route tree and can be used for downstream receiver analytics.
Significance. If the central claim were established, the paper would make a useful contribution to sports analytics by automating a labor-intensive film-tagging task and enabling deployment-adjusted receiver metrics. The paper has several strengths: it works with public NFL tracking data, uses a principled functional-data representation that handles variable route durations, reports implementation details and log-likelihood values transparently, and discusses concrete downstream applications. However, the significance is currently limited because the route-identification claim is not validated against ground truth: the paper explicitly concedes in Section 6 that the results cannot be proven to work without the true route names, and it identifies a concrete failure to separate comeback from go routes. The manuscript therefore demonstrates a clustering procedure with visually interpretable centers, but not a verified route-identification method.
major comments (4)
- [§5.4 and §4.2] The EM algorithm is run for only four iterations, with log-likelihood values -6,090,879, -6,077,207, -6,069,274 and -6,064,259. The increments are roughly 13,672, 7,933, and 5,015, which are far from the declared stopping tolerance of 10^-6 stated in Section 4.2. The reported clusters are thus not maximum-likelihood estimates under the stated model, and the route labels are derived from an incompletely converged fit. The authors should either run the algorithm to convergence or explicitly present the analysis as based on an interim solution, and they should assess sensitivity to the number of iterations and to the initialization.
- [§5.5 and §6] The central claim that the clustering identifies routes is unvalidated. Section 5.5 states that cluster means are manually labeled by a football expert after the clustering was performed, and Section 6 concedes that 'the results obtained thus far cannot be proven to work without knowing the true route name for each of the passing plays in our data set.' Visual resemblance of cluster means to a route tree (Figure 4) and position-level rate sanity checks (Figure 6) cannot establish the claim because the labels were assigned after inspecting the cluster means. A labeled subset of plays with film-derived route names, together with a confusion matrix or per-route accuracy, is needed to support the abstract's claim of route identification.
- [§6] The paper itself identifies a major drawback: 'the ability to identify a comeback vs. a go route as the functions look nearly identical to our clustering algorithm.' Comeback and go routes are distinct, common route types in the standard route tree used for validation, so the method is already known to fail on at least some route distinctions. The manuscript should quantify how often such confusions occur, state how the 12 route groups handle them, or substantially narrow the claims about agreement with the route tree.
- [§3 and §5.3] The degree P of the Bernstein basis is never reported, even though it determines the class of shapes the cluster centers can represent and is directly relevant to the paper's concern that sharp route cuts may not be captured. In addition, the choices K=30 and the final set of 12 route groups are presented without a model-selection or stability justification. These details are needed for reproducibility and for assessing whether the function class and cluster count are adequate for the route identification task.
minor comments (4)
- [Abstract and §5.4] The abstract reports 34,698 routes on 6,963 passing plays, while Section 5.4 reports 33,967 routes from 6,963 passing plays; these counts should be reconciled.
- [§4.2 and §5.3] Section 4.2 says the E- and M-steps are repeated until the change in log-likelihood reaches a tolerance of 10^-6, but Section 5.3 says the EM algorithm is run for four steps; the inconsistency should be clarified.
- [§5.2] The sentence 'After the clustering process we use the features of the non-transformed data for further investigation' is vague; the authors should explain how cluster memberships are mapped back to the original field coordinates in Figure 5.
- [Acknowledgements] There is a typo: 'algoirthm' should be 'algorithm.'
Circularity Check
No circular derivation: the clustering is unsupervised and the route tree enters only in post-hoc labeling, not as a model input.
full rationale
The paper's derivation chain is self-contained. The model is a Gaussian mixture of Bézier curves (Eqs. 5-6), fit to observed receiver trajectories by EM (Eqs. 10-14). The route tree plays no role in the fitting: the only initialization is k-means on the last observed point (Section 5.3), which is a feature of the trajectory, not a route label. Clustering is unsupervised; the 34,698 trajectories are never paired with true route names, so no parameter is fitted to a label and then 'predicted.' The manual labelling in Section 5.5 is a post-hoc interpretation of cluster means by a football expert; because those labels are not used to compute cluster centers, the later descriptions of cluster content are not a self-definitional reduction. The paper explicitly disclaims verification: 'the results obtained thus far cannot be proven to work without knowing the true route name' (Section 6). That is a validation gap, not circularity. There are no load-bearing self-citations: references to Gaffney (2004), Miller and Bornn (2017), and Dempster et al. (1977) are standard external methodology. Thus the central claim, while unverified against ground truth, is not forced by construction.
Assumptions & free parameters
free parameters (4)
- K (number of clusters) =
30
- Degree P of Bernstein basis
- Number of EM iterations =
4
- Number of final route groups =
12
assumptions (4)
- domain assumption Receiver trajectories can be represented as Bézier curves plus isotropic Gaussian noise.
- domain assumption After preprocessing, standardizing to line of scrimmage and flipping, routes of the same type have similar shapes.
- domain assumption The last observed point of a trajectory is informative for cluster initialization.
- ad hoc to paper Manual labels assigned by a football expert are correct.
Cite this review
Pith. "Pith review of Route Identification in the National Football League." pith.science (2026). https://pith.science/paper/CR2SNJEO
@misc{pith2026190802423,
  author       = {Pith},
  title        = {Pith review of: Route Identification in the National Football League},
  year         = {2026},
  howpublished = {\url{https://pith.science/paper/CR2SNJEO}},
  note         = {Machine review of arXiv:1908.02423}
}
read the original abstract
Tracking data in the NFL is a sequence of spatial-temporal measurements that vary in length depending on the duration of the play. In this paper, we demonstrate how model-based curve clustering of observed player trajectories can be used to identify the routes run by eligible receivers on offensive passing plays. We use a Bernstein polynomial basis function to represent cluster centers, and the Expectation Maximization algorithm to learn the route labels for each of the 34,698 routes run on the 6,963 passing plays in the data set. We go on to suggest ideas for new potential receiver metrics that account for receiver deployment. The resulting route labels can also be paired with film to enable streamlined queries of game film.
Figures

Figures from the paper (8 more)



Reference graph
Works this paper leans on
-
[1]
Aghabozorgi, S., Shirkhorshidi, A. S., and Wah, T. Y. (2015). Time-series clustering – a decade review. Information Systems , 53:16--38
work page 2015
-
[2]
Ajmeri, O. and Shah, A. (2012). Using computer vision and machine learning to automatically classify nfl game film and develop a player tracking system. In Proceedings of the 2012 MIT Sloan Sports Analytics Conference
work page 2012
-
[3]
AlShaher, A. A. (2018). Arabic character recognition using regression curves with the expectation maximization algorithm. International Journal of Computer, Electrical, Automation, Control and Information Engineering , 12(12):1087--1091
work page 2018
-
[4]
Baumer, B., Jensen, S., and Matthews, G. (2013). Openwar: An open source system for evaluating overall player performance in major league baseball. Journal of Quantitative Analysis in Sports , 11
work page 2013
-
[5]
Bouveyron, C. and Jacques, J. (2011). Model-based clustering of time series in group-specific functional subspaces. Advances in Data Analysis and Classification , 5(4):281--300
work page 2011
-
[6]
Broadie, M. (2011). Assessing golfer performance on the pga tour. Interfaces , 42
work page 2011
-
[7]
Red chalk talk: Route tree (3 of 4)
Buccaneers.com (2015). Red chalk talk: Route tree (3 of 4). [Online; posted 30-August-2015]
work page 2015
-
[8]
Chamroukhi , F. (2013). Robust em algorithm for model-based curve clustering. arXiv e-prints , page arXiv:1312.7022
work page Pith review arXiv 2013
Show all 24 references
-
[9]
P., Laird, N
Dempster, A. P., Laird, N. M., and Rubin, D. B. (1977). Maximum likelihood from incomplete data via the em algorithm. Journal of the Royal Statistical Society. Series B (Methodological) , 39(1):1--38
1977
-
[10]
J., Wang, L., Gill, J., and Cao, J
Dong, J. J., Wang, L., Gill, J., and Cao, J. (2018). F unctional principal component analysis of glomerular filtration rate curves after kidney transplant . Stat Methods Med Res , 27(12):3785--3796
2018
-
[11]
and Soromenho, G
Faria, S. and Soromenho, G. (2010). Fitting mixtures of linear regressions. Journal of Statistical Computation and Simulation , 80(2):201--225
2010
-
[12]
Gaffney, S. (2004). Probabilistic Curve-Aligned Clustering and Prediction with Mixture Models . PhD thesis, University of California, Irvine
2004
-
[13]
and Gagnon, P
Hochstedler, J. and Gagnon, P. T. (2017). American football route identification using supervised machine learning. In Proceedings of the 2017 MIT Sloan Sports Analytics Conference
2017
-
[14]
Horowitz, M., Yurko, R., and Ventura, S. (2018). nflscrapR: Compiling the NFL Play-by-Play API for easy use in R . R package version 1.8.1
2018
-
[15]
L., and Gey, S
Leroy, A., MARC, A., DUPAS, O., REY, J. L., and Gey, S. (2018). Functional data analysis in sport science: Example of swimmers' progression curves clustering. Applied Sciences , 8(10):1766
2018
-
[16]
McNicholas, P. D. and Murphy, T. B. (2010). Model-based clustering of microarray expression data via latent gaussian mixture models. Bioinformatics , 26(21):2705--2712
2010
-
[17]
Miller, A. C. and Bornn, L. (2017). Possession sketches : Mapping nba strategies. In Proceedings of the 2017 MIT Sloan Sports Analytics Conference
2017
-
[18]
Bernstein, S
N. Bernstein, S. (1911). D\' e monstration du th\' e or\` e me de weierstrass fond\' e e sur le calcul des probabilit\' e s. Communications de la Soci\' e t\' e Math\' e matique de Kharkov 2 , 13
1911
-
[19]
Nba partners with stats llc for tracking technology
Nba (2013). Nba partners with stats llc for tracking technology. [Online; posted Sep 5, 2013]
2013
-
[20]
Nfl next gen stats
Nfl (2019). Nfl next gen stats. https://operations.nfl.com/the-game/technology/nfl-next-gen-stats/. Accessed: 2019-04-23
2019
-
[21]
Rossler, B. (2019). Introducing targets above expectation
2019
-
[22]
Stern, H. S. (1994). A brownian motion model for the progress of sports scores. Journal of the American Statistical Association , 89(427):1128--1134
1994
-
[23]
Wickham, H. (2017). tidyverse: Easily Install and Load the 'Tidyverse' . R package version 1.2.1
2017
-
[24]
Yurko, R., Ventura, S., and Horowitz, M. (2019). nflwar: a reproducible method for offensive player evaluation in football. Journal of Quantitative Analysis in Sports
2019
Reviewed August 14, 2026 · model on record in the stance chip above.
Discussion (0). Continue with ORCID to comment.