REVIEW 3 major objections 5 minor 1 cited by
Plasmonic Heterodyne Spectrometry for Resolving the Spectral Signatures of Ammonia over a 1-5 THz Frequency Range
T0 review · 3 major / 5 minor · reviewed 2026-08-14 · deepseek-v4-flash
Pith's one-line read A room-temperature terahertz spectrometer that replaces mixers and local oscillators with two tunable lasers resolves ammonia absorption lines across 1-5 THz.
desk verdict A real but incremental gas-sensing demonstration whose key evidence depends on an unvalidated polynomial background subtraction; worth refereeing with a demand for controls. read the letter →
The pith
A machine-rendered reading of the paper's core claim, the machinery that carries it, and where it could break.
The reading
What carries the argument
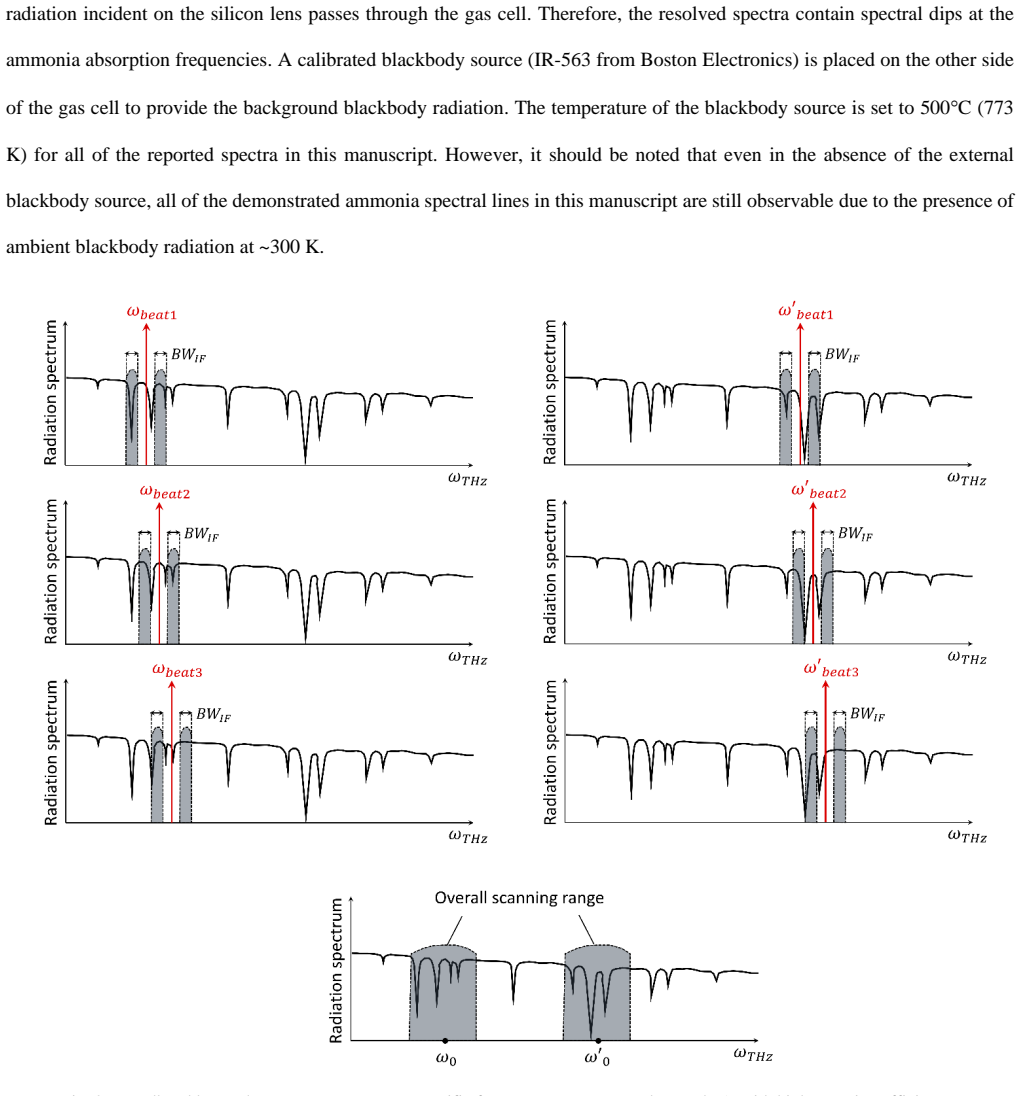
The central mechanism is the plasmonic photomixer, a photoconductive device in which metal nanostructures enhance conversion of the optical pump and incoming terahertz radiation into an intermediate-frequency electrical signal. The local oscillator is replaced by a heterodyning optical pump beam: two continuous-wave, wavelength-tunable lasers whose beat frequency is scanned across the terahertz band. Each recorded power reading corresponds to the received spectral content around the current beat frequency within the roughly 15 MHz bandwidth of the backend intermediate-frequency electronics. Because the beat frequency can be set directly to a target line, scanning can be confined to narrow windows around known molecular lines rather than sweeping the whole band. A high-order polynomial fit with least-squares error is then used to extract and subtract the sinusoidal standing-wave background caused by reflections in the gas cell, leaving the ammonia absorption dips in the resolved spectrum.
What would settle it
Scan the same frequency windows with the gas cell evacuated or filled with a non-absorbing gas, apply the same polynomial background subtraction, and check whether dips of similar depth and shape appear; if they do, the claimed ammonia signatures are artifacts of the subtraction.
Extended reading notes
Core claim
The central claim is that a single plasmonic photomixer, pumped by a heterodyning optical beam formed from two tunable diode lasers, can resolve narrow rotational absorption lines of ammonia across a 1-5 THz span by changing only the optical beat frequency. At each beat frequency, the photomixer downconverts the blackbody radiation transmitted through the gas cell to an intermediate frequency near 1 GHz, and the detected IF power is recorded as a function of beat frequency. Absorption by ammonia reduces the received power, producing dips at the expected line positions taken from the ammonia absorption spectrum. All of the targeted ammonia lines in the 1-5 THz range are reported as resolved, which the paper presents as evidence that the operation bandwidth is set by the tunability of the optical pump beat frequency rather than by the bandwidth of a mixer and local oscillator.
Load-bearing premise
The load-bearing premise is that the high-order polynomial used to subtract the standing-wave background leaves the true ammonia absorption dips intact; the paper does not test this against an ammonia-free spectrum or synthetic data.
Editorial extensions
If this is right
- A terahertz gas spectrometer can cover a broad band at room temperature by tuning the beat frequency of two optical lasers, without fabricating or tuning a separate terahertz local oscillator for each frequency.
- Targeted gas sensing can be performed efficiently by setting the beat frequency to known line centers and scanning only short windows around them, keeping measurement time roughly independent of line position.
- The same platform can work with ambient blackbody radiation at roughly 300 K as the source, since the paper reports that all demonstrated ammonia lines remain observable without the external blackbody source.
- Combining the photomixer with backend electronics of wider instantaneous bandwidth or with an optical comb pump would trade some sensitivity for faster scanning.
Reading between the lines
- If the polynomial background subtraction is validated against an ammonia-free spectrum, the platform could be pushed toward quantitative concentration measurements, because the depth of each resolved dip should follow the known line strength and path length.
- The beat-frequency scanning principle is not specific to ammonia; any polar molecule with rotational lines inside the photomixer's band should show similar resolved dips, so a natural next test is a gas with a dense spectrum, such as water vapor or methanol, to probe the achieved resolution.
- The Allan variance result, which shows drift dominating for integration times beyond about 3 s, implies that frequency-stabilizing the two pump lasers should directly improve both signal-to-noise ratio and line-position accuracy; this could be tested by comparing stabilized and free-running lasers on the same ammonia line.
- Because the backend IF bandwidth currently sets the resolved spectral resolution, swapping in higher-resolution IF electronics should allow the same photomixer to distinguish narrower lines than the present 15 MHz window.
Signed reviews
Editorial analysis
A structured set of objections, weighed in public.
Referee Report
Summary. The manuscript reports a terahertz heterodyne spectrometry platform based on a plasmonic photomixer pumped by two tunable continuous-wave lasers. The optical beat frequency acts as a broadly tunable terahertz local oscillator, replacing the mixer and local oscillator of conventional heterodyne spectrometers. The authors use the platform to detect ammonia gas in a room-temperature cell placed between a blackbody source and the photomixer. Power spectra are acquired by scanning the beat frequency around selected ammonia lines, and a post-processing algorithm using a high-order polynomial fit is used to remove a sinusoidal standing-wave background. The paper presents resolved spectra around six ammonia absorption lines between 1.215 THz and 4.125 THz, together with an Allan-variance analysis at 2 THz showing white-noise-limited behavior for short integration times and laser-drift-limited behavior for integration times beyond about 3 s.
Significance. If the reported spectral dips are genuine, the platform is significant because it demonstrates room-temperature heterodyne gas spectrometry over a 1-5 THz range without conventional terahertz mixers or local oscillators, with the capability to target narrow spectral windows by tuning the optical beat frequency. The paper has several notable strengths: it checks the measured line positions against an external ammonia reference [27], it covers a broad bandwidth with six lines, and it includes a quantitative Allan-variance characterization of the stability limits. However, the central claim that all targeted ammonia lines are resolved rests on post-processed spectra whose background-subtraction procedure is not validated, and the manuscript provides no error bars, SNR values, or quantitative comparison to reference spectra. These gaps currently prevent the central claim from being fully supported.
major comments (3)
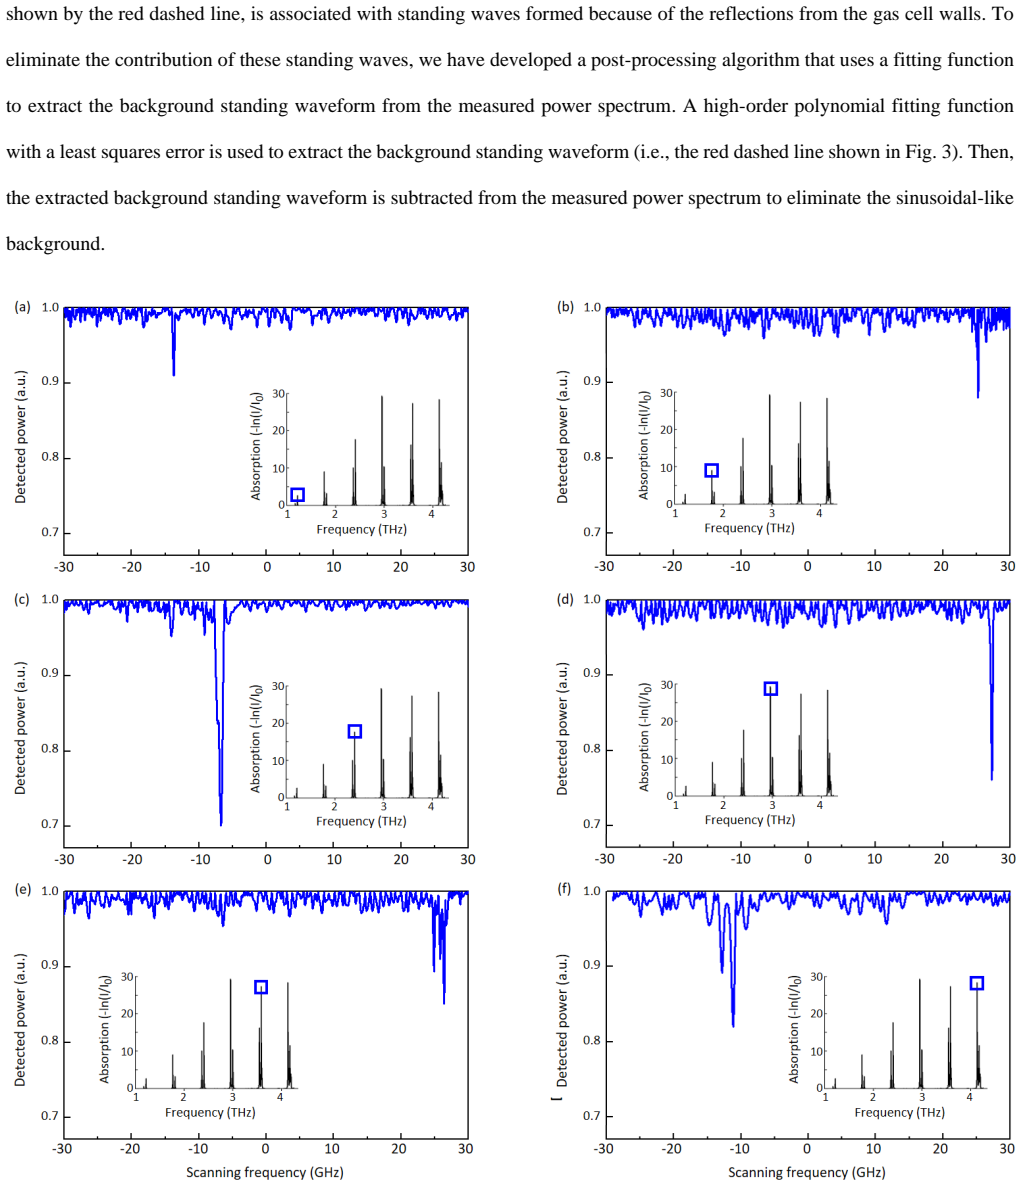
- [Post-processing near Fig. 3, page 5] The central evidence for resolved ammonia lines consists of the post-processed spectra in Fig. 4, obtained after subtracting a 'high-order polynomial fitting function with a least squares error' from the measured power spectrum. The polynomial order is not stated, no ammonia-free or evacuated-cell control is presented, and no synthetic spectrum is passed through the same subtraction pipeline. Because a high-order polynomial can fit narrow spectral features, the dips in Fig. 4 could be artifacts of the subtraction, and real dips could also be suppressed by it. Please add a control measurement (for example, a cell filled with a non-absorbing gas or an evacuated cell) and/or a synthetic-data validation, state the polynomial order and the residuals, and show that the ammonia dips are preserved by the subtraction.
- [Fig. 4 and text following it, pages 6-7] The claim that 'all of the targeted ammonia spectral lines in the 1-5 THz frequency range are resolved' is supported only by visual inspection of Fig. 4. The paper reports no error bars, no signal-to-noise ratios, no line-center offsets relative to the reference lines [27], no line depths or widths, and no statement of the ammonia pressure or concentration in the cell. Given the manuscript's own caveats about low SNR and about laser drift limiting frequency accuracy, quantitative metrics and a stated detection criterion are needed to substantiate the claim for each of the six lines.
- [Fig. 5 and scanning description, pages 6-7] The Allan-variance analysis shows that laser drift dominates for integration times longer than about 3 s, yet each 60 GHz spectral scan takes approximately one hour, and the paper does not explain how laser drift over the scan duration affects the accuracy of the frequency axis or the measured line centers. Please provide a drift-error budget for the beat frequency over the scanning period and state the scan step size, so that the effective frequency uncertainty of the line positions in Fig. 4 can be assessed against the reported spectral resolution.
minor comments (5)
- [Fig. 3 caption and text] The absorbance spectrum of ammonia shown on the right of Fig. 3 has no axis labels or units in the manuscript text; please add them or describe the reference spectrum clearly.
- [Experimental setup, page 2] Please state the ammonia gas pressure, concentration, and temperature inside the gas cell, as these determine the expected line widths and depths and are needed to interpret the 'resolved' dips.
- [Scanning method, page 4] Please clarify what determines the spectral resolution in practice: the IF filter bandwidth (15 MHz), the optical beat-frequency step size, or the pump laser linewidth, and report the step size used for the spectra in Fig. 4.
- [Page 3, blackbody statement] The statement that all demonstrated ammonia lines are observable without the external blackbody due to ambient ~300 K radiation is not supported by any measurement shown in the paper; if this claim is retained, it should be demonstrated by blocking the external blackbody.
- [Fig. 5] The Allan-variance curve is presented without error bars or details on how many points were averaged at each integration time; adding this information would strengthen the stability analysis.
Circularity Check
No circularity found: the spectral dips are compared against an external ammonia reference, not derived from the same fit.
full rationale
This paper is an experimental demonstration, not a derivation, and its central claim is the resolution of ammonia spectral signatures measured against an independent external benchmark. The measured dip positions (e.g., approximately 2.359 THz and 2.402 THz) are explicitly compared with the ammonia absorbance spectrum of reference [27], which is an external published dataset. The post-processing step that fits and subtracts a high-order polynomial to remove the standing-wave background is a data-reduction procedure, not an input that is later relabeled as a prediction: the extracted background is subtracted from the measured spectrum, and the residual dips are then checked against the known ammonia line positions. There is no equation in the paper that defines an output quantity in terms of the same output, and no fitted parameter is renamed as a prediction. The paper's use of the authors' prior work on plasmonic photomixers (e.g., reference [21]) provides the device platform, but the spectrometry result itself is not derived from that prior work by construction; the ammonia line positions are not taken from the authors' own fitted values. Concerns about whether the polynomial background subtraction could create or suppress dips are legitimate experimental-validation issues (an ammonia-free control could strengthen the claim), but they are not circularity: a data-processing artifact risk is not the same as a claim that reduces to its own input by definition. Therefore the circularity score is 0.
Assumptions & free parameters
free parameters (1)
- Standing-wave background polynomial coefficients
assumptions (3)
- domain assumption The measured IF output at a given optical beat frequency corresponds to the terahertz transmission at the beat frequency plus the IF filter center frequency.
- domain assumption Ammonia line positions and intensities from [27] are accurate and used to set the scan windows and assign observed dips.
- domain assumption The room-temperature blackbody source and ambient radiation provide sufficiently broadband and incoherent THz radiation for absorption measurement.
Cite this review
Pith. "Pith review of Plasmonic Heterodyne Spectrometry for Resolving the Spectral Signatures of Ammonia over a 1-5 THz Frequency Range." pith.science (2026). https://pith.science/paper/CSSP2GWA
@misc{pith2026190804016,
  author       = {Pith},
  title        = {Pith review of: Plasmonic Heterodyne Spectrometry for Resolving the Spectral Signatures of Ammonia over a 1-5 THz Frequency Range},
  year         = {2026},
  howpublished = {\url{https://pith.science/paper/CSSP2GWA}},
  note         = {Machine review of arXiv:1908.04016}
}
read the original abstract
We present a heterodyne terahertz spectrometry platform based on plasmonic photomixing, which enables the resolution of narrow spectral signatures of gases over a broad terahertz frequency range. This plasmonic heterodyne spectrometer replaces the terahertz mixer and local oscillator of conventional heterodyne spectrometers with a plasmonic photomixer and a heterodyning optical pump beam, respectively. The heterodyning optical pump beam is formed by two continuous-wave, wavelength-tunable lasers with a broadly tunable terahertz beat frequency. This broadly tunable terahertz beat frequency enables spectrometry over a broad bandwidth, which is not restricted by the bandwidth limitations of conventional terahertz mixers and local oscillators. We use this plasmonic heterodyne spectrometry platform to resolve the spectral signatures of ammonia over a 1-5 THz frequency range.
Figures


Figures from the paper (2 more)

Forward citations
Cited by 1 Pith paper
-
Response to 'Room Temperature, Quantum-Limited THz Heterodyne Detection? Not Yet'
The authors defend their earlier room-temperature THz heterodyne detection result against a critique, arguing that impedance matching and Y-factor methods were mischaracterized.
Reference graph
Works this paper leans on
-
[27]
C. S. Goldenst ein, V. A. Miller, R. M. Spearrin, and C. L. Strand, J. Quantitative Spectroscopy and Radiative Transfer 200, 249-257 (2017)
work page 2017
-
[1]
H. W. Hubers, J. Sel. Topic. Quantum Electron. 14, 378-391 (2008)
work page 2008
-
[2]
G. L. Manney, et al., Nat. 478, 469-475 (2011)
work page 2011
- [3]
- [4]
-
[5]
T. G. Phillips and J. Keene, Proc. IEEE 80, 1662-1678 (1992)
work page 1992
-
[6]
J. L. Kloosterman, et al., Appl. Phys. Lett. 102, 011123 (2013)
work page 2013
-
[7]
M. J. Wengler, Proc. IEEE 80, 1810-1826 (1992)
work page 1992
Show all 40 references
-
[8]
A. D. Semenov, et al., Trans. Appl. Superconduct. 13, 168-171 (2003)
2003
-
[9]
J. R. Gao, et al., IEEE Trans. Appl. Superconduct. 17, 252-258 (2007)
2007
-
[10]
T. W. Crowe, et al., Proc. IEEE 80, 1827-1841 (1992). 8
1992
-
[11]
Zmuidzinas and P
J. Zmuidzinas and P. L. Richards, Proc. IEEE 92, 1597-1616 (2004)
2004
-
[12]
Putz, et al., Astronomy & Astrophysics 542, L2 (2012)
P. Putz, et al., Astronomy & Astrophysics 542, L2 (2012)
2012
-
[13]
N. T. Yardimci, and M. Jarrahi, Small 14, 1802437 (2018)
2018
-
[14]
Huang, et al., Phys
S.-W. Huang, et al., Phys. Rev. X 7, 041002 (2017)
2017
-
[15]
S.-H. Yang, R. Salas, Erica M. Krivoy, Hari P. Nair, S. R. Bank, and M. Jarrahi, J. Infrared Millimeter Terahertz Waves 37, 640–648 (2016)
2016
-
[16]
S.-H. Yang, R. Watts, X. Li, N. Wang, V. Cojocaru, J. O'Gorman, L. P. Barry, and M. Jarrahi, Opt. Express 23, 31206- 31215 (2015)
2015
-
[17]
Yang and M
S.-H. Yang and M. Jarrahi, Opt. Express 23, 28522-28530 (2015)
2015
-
[18]
Yang and M
S.-H. Yang and M. Jarrahi, Appl. Phys. Lett. 107, 131111 (2015)
2015
-
[19]
Jarrahi, IEEE Trans
M. Jarrahi, IEEE Trans. THz Sci. Technol. 5, 391-397 (2015)
2015
-
[20]
C. W. Berry, N. Wang, M. R. Hashemi, M. Unlu, and M. Jarrahi Nat. Commun. 4, 1622 (2013)
2013
-
[21]
N. Wang, S. Cakmakyapan, Y.-J. Lin, H. Javadi, and M. Jarrahi, Nat. Astronomy, doi:10.1038/s41550-019-0828-6 (2019)
2019 doi
-
[22]
Timmer et al., Sensors and Actuators B: Chem
B. Timmer et al., Sensors and Actuators B: Chem. 107, 666-677 (2005)
2005
-
[23]
W. Y. Peng et al., App. Physics B 122, 188 (2016)
2016
-
[24]
Owen and A
K. Owen and A. Farooq, App. Phys B 116, 371-383 (2013)
2013
-
[25]
J. D. Whitehead et al., Water Air Soil Pollut. 183, 317-329 (2007)
2007
-
[26]
M. B. Pushkarsky et al., App. Phys. B 75, 391-396 (2002)
2002
-
[28]
De Graauw, et al., Astronomy & Astrophysics 518, L6 (2010)
T. De Graauw, et al., Astronomy & Astrophysics 518, L6 (2010)
2010
-
[29]
Heyminck, et al., Astronomy & Astrophysics 542, L1 (2012)
S. Heyminck, et al., Astronomy & Astrophysics 542, L1 (2012)
2012
-
[30]
Wootten and A
A. Wootten and A. R. Thompson, Proc. IEEE 97, 1463-1471 (2009)
2009
-
[31]
D. R. Higgins, PhD thesis, National Univ. Ireland Maynooth (2011)
2011
-
[32]
Quraishi, et al., Opt
Q. Quraishi, et al., Opt. Lett. 30, 3231-3233 (2005)
2005
-
[33]
Yasui, et al., J
T. Yasui, et al., J. Appl. Phys. 107, 033111 (2010)
2010
-
[34]
Horn, et al., Exp
J. Horn, et al., Exp. Astronomy 9, 17-38 (1999)
1999
-
[35]
Villanueva and P
G. Villanueva and P. Hartogh, Exp. Astronomy 18, 77-91 (2004)
2004
-
[36]
Yasui, et al., J
T. Yasui, et al., J. Sel. Top. Quantum Electron. 17, 191-201 (2011). 9
2011
-
[37]
Y. D. Hsieh, et al., IEEE Trans. THz Sci. Technol. 3, 322-330 (2013)
2013
-
[38]
Y. D. Hsieh, et al., Sci. Rep. 4, 3816 (2014)
2014
-
[39]
Yasui, et al., Sci
T. Yasui, et al., Sci. Rep. 5, 10786 (2015)
2015
-
[40]
Wang and M
N. Wang and M. Jarrahi, J. Infrared Millimeter Terahertz Waves 34, 519-528 (2013)
2013
Reviewed August 14, 2026 · model on record in the stance chip above.
Discussion (0). Continue with ORCID to comment.