REVIEW 2 major objections 4 minor 26 references
The census of non-radial pulsation in first-overtone RR Lyrae stars of the OGLE Galactic bulge collection
T0 review · 2 major / 4 minor · reviewed 2026-08-14 · deepseek-v4-flash
Pith's one-line read This paper finds that the most common extra pulsation in first-overtone RR Lyrae stars is a harmonic of a high-degree non-radial mode, and quantifies two families from a census of 11,563 stars.
desk verdict A large, carefully done census of RR0.61 and RR0.68 stars whose interpretive claims are mostly sound, except the three-sequence combination test in §4.2 is weaker than the paper suggests. read the letter →
The pith
A machine-rendered reading of the paper's core claim, the machinery that carries it, and where it could break.
The reading
What carries the argument
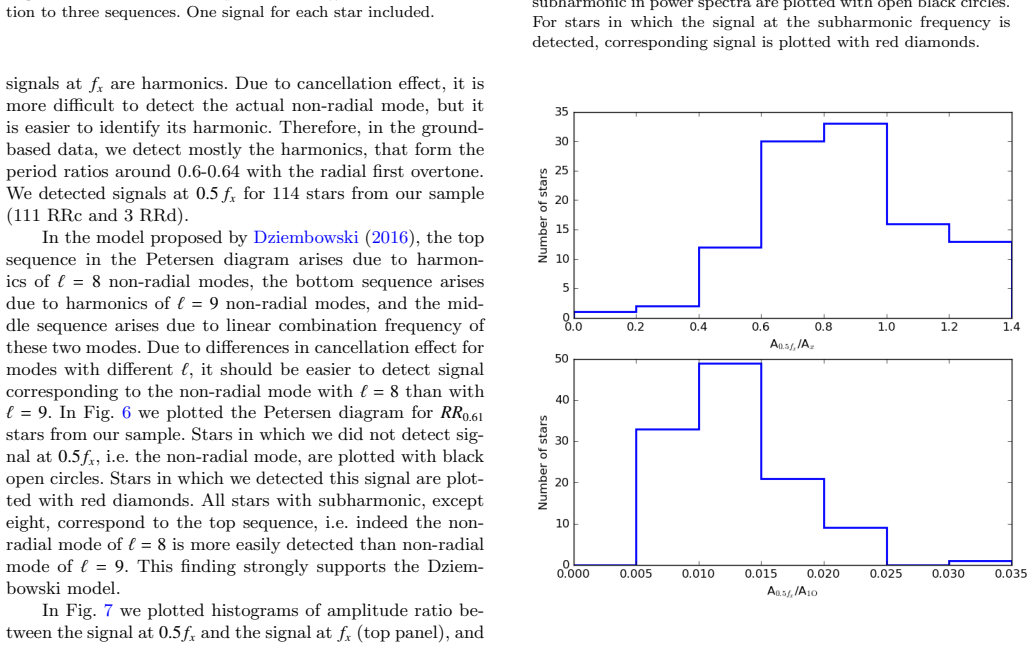
The load-bearing device is the pair of signals at fx and 0.5 fx in the Fourier spectrum of each star. Under the adopted theory, the 0.5 fx signal is the non-radial mode itself, with degree l=8 for the top period-ratio sequence and l=9 for the bottom sequence, while the stronger fx signal is its harmonic; geometric cancellation suppresses the parent mode far more than the harmonic, so ground-based data predominantly see harmonics. The paper detects subharmonics in 114 stars, finds they sit almost exclusively on the top sequence, and uses Gaussian fitting of broad power excesses to test the prediction that the middle sequence frequency equals half the sum of the top and bottom frequencies, confirming the relation within the measured line widths.
What would settle it
Look at the 114 stars with detected 0.5 fx signals: the geometric-cancellation model predicts that these subharmonics should cluster on the top degree-8 sequence, as observed, and that the amplitude ratio between the 0.5 fx and fx signals should follow a predictable distribution set by spherical-harmonic cancellation. A falsifying observation would be a substantial population of subharmonic detections on the bottom sequence, or an amplitude-ratio distribution that is independent of sequence placement and too broad to match the predicted geometry; either would break the l=8/l=9 harmonic assignment.
Extended reading notes
Core claim
The central claim is that the RR0.61 phenomenon in first-overtone RR Lyrae stars is non-radial pulsation of very high angular degree, not an unknown radial mode. In this interpretation, the low-amplitude signal detected at frequency fx is not the mode itself but its harmonic; the true mode sits at 0.5 fx, where the paper detects a broader, lower-amplitude power excess in 114 stars. Because the harmonic suffers less geometric cancellation than the parent mode, ground-based surveys see mostly harmonics, which explains why the signals are weak and why almost all stars with a detected 0.5 fx signal fall on the top sequence of the period-ratio diagram, the sequence that the proposed model predicts should be easier to observe than the degree-9 one. In 34 stars with three simultaneous signals, the middle frequency equals the mean of the bottom and top frequencies, exactly what a combination frequency of the two proposed modes would produce. The census therefore turns the previously sparse RR0.61 detections into a statistical confirmation of the mode-degree identification, and separately establishes the RR0.68 group as a coherent-signal class whose physical origin is still unexplained.
Load-bearing premise
The case stands or falls on the imported identification that a signal at 0.5 fx is a high-degree non-radial mode of degree 8 or 9 and that the signal at fx is its harmonic; if that mapping is mistaken, the mode-degree attribution and the three-sequence combination test lose physical meaning, although the measured periods, amplitudes, and counts would remain valid.
Editorial extensions
If this is right
- The RR0.61 phenomenon is not rare: 8.3 per cent of the surveyed RRc stars show it, and earlier analysis of high-cadence fields points to a true incidence up to 27 per cent, consistent with space photometry finding the signal in nearly all such stars.
- The three sequences in the period-ratio diagram now map onto specific modes: harmonics of l=9, harmonics of l=8, and a combination frequency of the two.
- Stars that show the 0.5 fx subharmonic almost all belong to the top sequence, matching the predicted detection asymmetry between l=8 and l=9.
- The RR0.68 group, with 147 new members and 1.3 per cent incidence, is a distinct class of coherent long-period extra signals with no accepted explanation.
- The two V37-like stars suggest a possible new class of double-mode pulsators, with beating between two close frequencies and light curves unlike typical RRc stars.
Reading between the lines
- A direct test of the geometric-cancellation story would be to measure, in space photometry with high signal-to-noise, how the amplitude ratio of the 0.5 fx signal to the fx signal depends on the star's orientation; a spread too large to explain by mode geometry would weaken the l=8/l=9 assignment.
- The combination-frequency interpretation predicts that the middle-sequence signal should share a fixed phase relation with the bottom and top signals; checking this phase coherence on the 34 three-signal stars would independently confirm or refute the non-linear coupling.
- If the mode identification holds, the near-universality of RR0.61 signals in space data implies that the excitation mechanism must be efficient across the whole RRc instability strip, which could be tested by computing non-adiabatic models of high-degree modes in these stars.
- The RR0.68 signal's coherence and its period longer than the fundamental could be a signature of a different physical process; searching for the same period-ratio feature in RRd and RRab stars would test whether it is tied to the first-overtone pulsation itself.
Signed reviews
Editorial analysis
A structured set of objections, weighed in public.
Referee Report
Summary. The paper presents a systematic search for low-amplitude additional periodicities in 11,415 first-overtone RR Lyrae (RRc) stars and 148 double-mode RR Lyrae (RRd) stars toward the Galactic bulge using OGLE-IV photometry. The analysis pipeline is a Fourier-transform-based consecutive prewhitening procedure with time-dependent prewhitening, an S/N>4 detection threshold, rejection of diurnal aliases, and visual inspection of selected power spectra. The authors report 949 RRc and 11 RRd stars in the RR0.61 group and 147 RRc stars in the RR0.68 group, corresponding to incidence rates of 8.3% and 1.3% of the RRc sample, respectively. They analyze the three sequences in the Petersen diagram, the detection of subharmonics at 0.5 fx, and a three-sequence combination test; they also report two stars similar to V37 in NGC 6362. The paper concludes that the RR0.61 periodicities are 'strongly' supported as non-radial modes of degree l=8 and l=9 in the Dziembowski (2016) framework.
Significance. If the census and the mode interpretation are accepted, this is the largest and most complete sample of RR0.61 and RR0.68 stars to date, nearly doubling the known population of these objects and providing the first large statistical sample with which to test the Dziembowski non-radial-mode scenario. The detection pipeline is described in sufficient detail to be reproduced, the candidate lists and period-amplitude tables are provided in full, and the subharmonic-sequence correlation is a genuinely falsifiable model prediction that is tested against a large sample. These strengths make the paper a valuable reference dataset even if some of the interpretive conclusions need to be softened.
major comments (2)
- [§4.2, Fig. 9, and §7] The three-sequence combination test is presented as confirming that the middle sequence is a linear combination frequency ('another point in favor of the Dziembowski model', §7), but as constructed it has little statistical power. The test compares Δ = |f_middle − 0.5(f_bottom + f_top)| with the FWHM of Gaussian fits to broad power excesses; the paper reports that in all 34 stars Δ is smaller than the FWHM. Because the sequence boundary values (0.613, 0.622, 0.631) were chosen from minima in the same period-ratio distribution and are nearly equally spaced, an independent set of three frequencies drawn from within those broad excesses would frequently satisfy the arithmetic-mean relation at the FWHM level. The manuscript does not report how often a null model of independent frequencies would pass this test, so the claim that the middle signal is a combination is not statistically established. I recommend either adding a Monte Carlo estimate of the false-positive rate (drawing frequencies from the fitted Gaussian widths) or explicitly downgrading this item to a consistency check. The subharmonic-sequence correlation in §4.1 is the stronger support and should be the primary quantitative argument.
- [Abstract and §7 (mode-degree attribution)] The abstract and conclusions state 'strong arguments' that the additional periodicities are non-radial modes of degree l=8 and l=9, but this identification is imported from Dziembowski (2016) and the internal evidence is indirect: the 0.5 fx signals are detected almost exclusively in the top sequence (106 of 114, §4.1), which is consistent with the predicted easier detectability of l=8, but the paper measures no mode degree directly. If the external mapping of 0.5 fx to l=8/l=9 is incorrect, the three-sequence interpretation loses its physical meaning even though the measured periods, amplitudes, and counts remain valid. The conclusions should be rephrased to say the results are consistent with, and statistically favor, the Dziembowski identification, rather than that the identification is established by this paper; a quantitative comparison of the observed sequence populations and amplitude ratios with the model's predictions would strengthen the claim.
minor comments (4)
- [Table A1 and Table A2] The column headers in the appendix tables appear interchanged: Table A1 lists 'P1O/PX' but the values are PX/P1O ≈ 0.61, while Table A2 lists 'PX/P1O' but the values are P1O/PX ≈ 0.686. The headers should be checked against Tables 1 and 2 and corrected.
- [§4.2 and Fig. 9] The green dashed line in Fig. 9 is described as the 'adopted resolution of the power spectrum'; please state explicitly how this resolution was computed and whether it varies among the stars, since time base differences could affect individual Δ values.
- [Abstract and §3] The abstract reports '960 and 147 RR Lyrae stars' for the two groups; the body gives 949 RRc plus 11 RRd for RR0.61. Spelling out the RRc/RRd split in the abstract would avoid apparent inconsistency.
- [§4.1] The sentence 'The fact, that in 31 per cent of RR0.61 stars in which both signals are detected (35 out of 114) we observe higher amplitude of the signal at 0.5 fx than of the signal at fx' is slightly confusing because the seven stars in Table 3 are a separate subset; consider restructuring to clarify the relationship between the 35 stars and the seven stars.
Circularity Check
No significant circularity: the census is a direct measurement on OGLE data, and the Dziembowski model is an external framework whose predictions are tested, not assumed.
full rationale
The paper's central results—949 RRc RR0.61 stars, 147 RRc RR0.68 stars, incidence rates 8.3% and 1.3%—are produced by a documented frequency-analysis pipeline (S/N>4, prewhitening, visual inspection) applied to external OGLE photometry. No parameter is fitted to the claimed output, and the counts and incidence rates do not depend on the Dziembowski model. The interpretive claim that the additional signals are l=8/l=9 non-radial modes is explicitly attributed to Dziembowski (2016), an external source, and the paper tests two model predictions: (1) subharmonic detections should preferentially fall in the top sequence because l=8 suffers less geometric cancellation, and (2) for stars with three signals, the middle-sequence frequency should equal the average of the bottom- and top-sequence frequencies. Both are genuine, falsifiable tests: the sequence boundaries are defined from period-ratio minima in the data, and the arithmetic-mean relation is not forced by the selection intervals. The three-sequence test's statistical power may be limited (comparing deviations to Gaussian FWHM rather than to a null distribution), but that is a correctness or significance concern, not circularity. The paper also cites prior work by the same authors for group definitions, previous detections, and the time-dependent prewhitening technique, but none of these citations replaces an independent measurement or constitutes the load-bearing evidence for the paper's main census numbers. The measured periods, amplitudes, and counts would remain valid even if the Dziembowski mode identification were wrong. Therefore the derivation chain is self-contained with respect to its observational claims, and the interpretive step rests on an external model rather than on a self-citation or a definitional equivalence.
Assumptions & free parameters
free parameters (2)
- S/N detection threshold =
4
- Sequence boundary period ratios =
0.62 and 0.625
assumptions (5)
- domain assumption OGLE-IV I-band photometry and the frequency-analysis pipeline recover genuine astrophysical signals at the S/N greater than 4 level.
- domain assumption Dziembowski's model maps period-ratio sequences to l=8 and l=9 non-radial modes, with 0.5 fx as the mode and fx as its harmonic.
- domain assumption The middle Petersen sequence arises as a linear combination of the bottom and top sequence frequencies, so fmiddle should equal 0.5(f_bottom + f_top).
- domain assumption Signals very close to integer frequencies of 1, 2, and 3 cycles per day are diurnal artifacts.
- domain assumption Time-dependent prewhitening removes non-stationary pulsation without creating or destroying the searched low-amplitude signals.
Cite this review
Pith. "Pith review of The census of non-radial pulsation in first-overtone RR Lyrae stars of the OGLE Galactic bulge collection." pith.science (2026). https://pith.science/paper/CVYL7R5Y
@misc{pith2026190807251,
  author       = {Pith},
  title        = {Pith review of: The census of non-radial pulsation in first-overtone RR Lyrae stars of the OGLE Galactic bulge collection},
  year         = {2026},
  howpublished = {\url{https://pith.science/paper/CVYL7R5Y}},
  note         = {Machine review of arXiv:1908.07251}
}
abstract
We analyzed photometry for the up-to-date collection of the first-overtone RR Lyrae stars (RRc; 11415 stars) and double-mode RR Lyrae stars (RRd; 148 stars) towards the Galactic bulge from the Optical Gravitational Lensing Experiment. We analyzed frequency spectra of these stars in search for additional, low-amplitude signals, beyond the radial modes. We focused on stars from two groups: $RR_{0.61}$ and $RR_{0.68}$. In the first group, additional low-amplitude signals have periods shorter than the first-overtone period; period ratios fall in the 0.60-0.64 range. In the second group, additional low-amplitude signals have periods longer than the first-overtone period; period ratios tightly cluster around 0.68. Altogether we have detected 960 and 147 RR Lyrae stars that belong to $RR_{0.61}$ and $RR_{0.68}$ groups, respectively, which yield the incidence rates of 8.3 and 1.3 per cent of the considered sample. We discuss statistical properties of RR Lyrae stars with additional periodicities. For $RR_{0.61}$ group we provide strong arguments that additional periodicities are connected to non-radial pulsation modes of degrees $\ell=8$ and $\ell=9$, as proposed by Dziembowski. We have also detected two double-periodic variables, with two close periodicities, similar to RR Lyrae variable V37 in NGC 6362. Properties of these peculiar variables, which may form a new group of double-mode pulsators, are discussed.
Figures


Figures from the paper (9 more)




Reference graph
Works this paper leans on
-
[1]
write newline
" write newline "" before.all 'output.state := FUNCTION fin.entry write newline FUNCTION new.block output.state before.all = 'skip after.block 'output.state := if FUNCTION new.sentence output.state after.block = 'skip output.state before.all = 'skip after.sentence 'output.state := if if FUNCTION not #0 #1 if FUNCTION and 'skip pop #0 if FUNCTION or pop #1...
-
[2]
write newline
" write newline "" before.all 'output.state := FUNCTION fin.entry write newline FUNCTION new.block output.state before.all = 'skip after.block 'output.state := if FUNCTION new.sentence output.state after.block = 'skip output.state before.all = 'skip after.sentence 'output.state := if if FUNCTION not #0 #1 if FUNCTION and 'skip pop #0 if FUNCTION or pop #1...
-
[3]
Benk o J. M., et al., 2010, @doi [ ] 10.1111/j.1365-2966.2010.17401.x , http://adsabs.harvard.edu/abs/2010MNRAS.409.1585B 409, 1585
-
[4]
Benk o J. M., Plachy E., Szab \'o R., Moln \'a r L., Koll \'a th Z., 2014, @doi [ ] 10.1088/0067-0049/213/2/31 , http://adsabs.harvard.edu/abs/2014ApJS..213...31B 213, 31
-
[5]
Dziembowski W. A., 2016, Commmunications of the Konkoly Observatory Hungary, http://adsabs.harvard.edu/abs/2016CoKon.105...23D 105, 23
work page 2016
- [6]
-
[7]
Jurcsik J., Smitola P., Hajdu G., Nuspl J., 2014, @doi [ ] 10.1088/2041-8205/797/1/L3 , http://adsabs.harvard.edu/abs/2014ApJ...797L...3J 797, L3
-
[8]
Jurcsik J., et al., 2015, @doi [ ] 10.1088/0067-0049/219/2/25 , http://adsabs.harvard.edu/abs/2015ApJS..219...25J 219, 25
Show all 26 references
-
[9]
W., Bowman D
Kurtz D. W., Bowman D. M., Ebo S. J., Moskalik P., Handberg R., Lund M. N., 2016, @doi [ ] 10.1093/mnras/stv2377 , http://adsabs.harvard.edu/abs/2016MNRAS.455.1237K 455, 1237
2016 doi
-
[10]
Moln \'a r L., et al., 2015, @doi [ ] 10.1093/mnras/stv1638 , http://adsabs.harvard.edu/abs/2015MNRAS.452.4283M 452, 4283
2015 doi
-
[11]
Moskalik P., et al., 2015, @doi [ ] 10.1093/mnras/stu2561 , http://adsabs.harvard.edu/abs/2015MNRAS.447.2348M 447, 2348
2015 doi
-
[12]
3, 37th Meeting of the Polish Astronomical Society
Netzel H., Smolec R., 2016, in R \'o \.z a \'n ska A., Bejger M., eds, Vol. 3, 37th Meeting of the Polish Astronomical Society. pp 36--39 ( @eprint arXiv 1603.05389 )
2016 arXiv
-
[13]
Netzel H., Smolec R., Moskalik P., 2015a, @doi [ ] 10.1093/mnras/stu2409 , http://adsabs.harvard.edu/abs/2015MNRAS.447.1173N 447, 1173
-
[14]
Netzel H., Smolec R., Dziembowski W., 2015b, @doi [ ] 10.1093/mnrasl/slv062 , http://adsabs.harvard.edu/abs/2015MNRAS.451L..25N 451, L25
-
[15]
Netzel H., Smolec R., Moskalik P., 2015c, @doi [ ] 10.1093/mnras/stv1758 , http://adsabs.harvard.edu/abs/2015MNRAS.453.2022N 453, 2022
2022 doi
-
[16]
Netzel H., Smolec R., Soszy \'n ski I., Udalski A., 2018, @doi [ ] 10.1093/mnras/sty1883 , http://adsabs.harvard.edu/abs/2018MNRAS.480.1229N 480, 1229
2018 doi
-
[17]
Olech A., Moskalik P., 2009, @doi [ ] 10.1051/0004-6361:200811441 , http://adsabs.harvard.edu/abs/2009A
2009 doi
-
[18]
Prudil Z., Smolec R., Skarka M., Netzel H., 2017, @doi [ ] 10.1093/mnras/stw3010 , http://adsabs.harvard.edu/abs/2017MNRAS.465.4074P 465, 4074
2017 doi
-
[19]
Smolec R., et al., 2015, @doi [ ] 10.1093/mnras/stu2684 , http://adsabs.harvard.edu/abs/2015MNRAS.447.3756S 447, 3756
2015 doi
-
[20]
B., 2017, @doi [ ] 10.1093/mnras/stx088 , http://adsabs.harvard.edu/abs/2017MNRAS.467.2349S 467, 2349
Smolec R., Moskalik P., Ka u \.z ny J., Pych W., R \'o \.z yczka M., Thompson I. B., 2017, @doi [ ] 10.1093/mnras/stx088 , http://adsabs.harvard.edu/abs/2017MNRAS.467.2349S 467, 2349
2017 doi
-
[21]
Soszy \'n ski I., et al., 2014, , http://adsabs.harvard.edu/abs/2014AcA....64..177S 64, 177
2014
-
[22]
Soszy \'n ski I., et al., 2016, @doi [ ] 10.1093/mnras/stw1933 , http://adsabs.harvard.edu/abs/2016MNRAS.463.1332S 463, 1332
2016 doi
-
[23]
Soszy \'n ski I., et al., 2017, , http://adsabs.harvard.edu/abs/2017AcA....67..297S 67, 297
2017
-
[24]
I., 2018, @doi [ ] 10.1093/mnras/sty891 , http://adsabs.harvard.edu/abs/2018MNRAS.478.1425S 478, 1425
S \"u veges M., Anderson R. I., 2018, @doi [ ] 10.1093/mnras/sty891 , http://adsabs.harvard.edu/abs/2018MNRAS.478.1425S 478, 1425
2018 doi
-
[25]
Udalski A., Szymanski M., Kaluzny J., Kubiak M., Mateo M., 1992, , http://adsabs.harvard.edu/abs/1992AcA....42..253U 42, 253
1992
-
[26]
K., Szyma \'n ski G., 2015, , http://adsabs.harvard.edu/abs/2015AcA....65....1U 65, 1
Udalski A., Szyma \'n ski M. K., Szyma \'n ski G., 2015, , http://adsabs.harvard.edu/abs/2015AcA....65....1U 65, 1
2015
Reviewed August 14, 2026 · model on record in the stance chip above.
Discussion (0). Continue with ORCID to comment.