REVIEW 3 major objections 4 minor 59 references
Second-order Control of Complex Systems with Correlated Synthetic Data
T0 review · 3 major / 4 minor · reviewed 2026-08-14 · deepseek-v4-flash
Pith's one-line read Correlated synthetic data can be generated for cities and markets alike.
desk verdict A competent feasibility exploration of correlated synthetic spatial data is being sold as "control" of second-order statistics; the financial application is genuinely controlled, and the paper deserves revision rather than rejection. read the letter →
The pith
A machine-rendered reading of the paper's core claim, the machinery that carries it, and where it could break.
The reading
What carries the argument
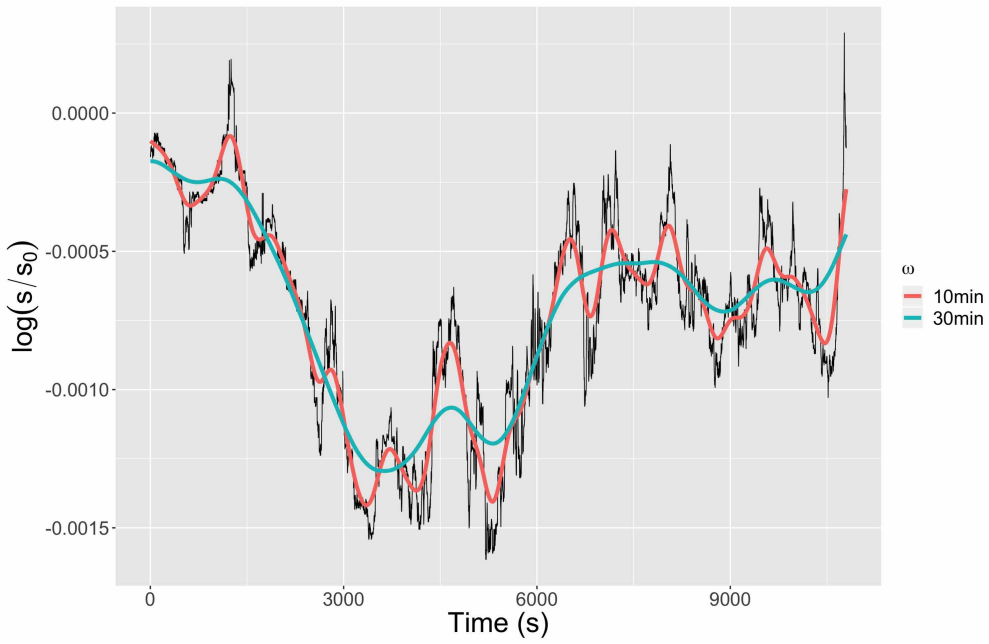
The central object is the covariance-control identity $\widehat{\mathrm{Cov}}[\tilde{X}]=\Sigma^\top R\Sigma$, which reduces second-order generation to choosing a target correlation matrix $R$ and estimating standard deviations $\Sigma$ on the synthetic population. In the territorial implementation, the machinery is the sequential coupling of an aggregation-diffusion density model with a network morphogenesis model whose links are added according to a gravity potential $V_{ij}(d)=[(1-k_h)+k_h(P_iP_j/P^2)^\gamma]\,\exp(-d/(r_g(1+d/d_0)))$; Latin Hypercube sampling of its parameters produces the feasible correlation space. In the financial implementation, the machinery is the construction of correlated Wiener processes via $W_2=\rho_{12}W_1+\sqrt{1-\sigma_1^2/\sigma_2^2\,\rho_{12}^2}\,W_1^\perp$, followed by low-pass filtering and superposition on real low-frequency components, together with the effective-correlation formula that corrects for interference between frequency bands.
What would settle it
Run the same parameter exploration with substantially wider bounds, for example $\alpha$ up to 5, $N_c$ up to 300, and $\gamma$ up to 10, and check whether the set of reachable correlations expands beyond the original cloud. If the point cloud in the principal-component plane does not grow, or if the null model's correlation cloud covers the same region, the claimed broad feasibility of correlated synthetic data would be an artifact of the chosen exploration range.
Extended reading notes
Core claim
The central claim is that second-order statistical control of synthetic data is feasible for complex systems even when only macroscopic, aggregated data is available. Formally, the paper introduces a generation pipeline in which a synthetic population $\tilde{X}$ must satisfy $\|\vec{f}(X)-\vec{f}(\tilde{X})\|<\varepsilon$ for aggregated indicators $\vec{f}$, and $\widehat{\mathrm{Cov}}[\tilde{X}]=\Sigma^\top R\Sigma$ for a prescribed correlation matrix $R$. In the socio-spatial case, coupling a reaction-diffusion density model with a network morphogenesis model yields cross-correlations between urban-form indicators and network measures that span a wide range, with maximal absolute correlations roughly between 0.6 and 0.9; some correlation coefficients are bimodally distributed, revealing distinct regimes. The financial case constructs hybrid signals $X_i=T_i^{\omega_0}+\tilde{X}_i^{\omega_1}$ that keep the real low-frequency trend and add correlated Brownian components, with an analytical first-order correction $\rho_e=[\varepsilon_1\varepsilon_2\rho_0+\rho]\,[1-\tfrac{1}{2}(\varepsilon_1^2+\varepsilon_2^2)]$ for the effective correlation. The paper argues these results establish genericity: the same abstract method controls correlation structure in two very different complex systems.
Load-bearing premise
The claim that a broad range of correlations is reachable rests on the hand-chosen Latin Hypercube bounds for the coupled model's parameters; if those bounds do not span the model's behavioural space, the observed correlation range could be an artifact of the exploration domain rather than a property of the method.
Editorial extensions
If this is right
- Sensitivity analyses of simulation models can now vary the spatial initial configuration while keeping first-order indicators fixed and imposing a chosen second-order correlation structure, extending the sensitivity-analysis approach to initial spatial conditions.
- Synthetic territorial datasets with controlled correlations can serve as benchmarks for urban models, helping to separate effects caused by intrinsic dynamics from effects caused by particular geographical configurations.
- For financial data, synthetic high-frequency series with a fixed correlation level between assets can be generated from real low-frequency components, allowing estimator performance to be tested in controlled settings.
- The feasibility map of correlations (amplitude roughly 0.9 to 1.6 and maximal absolute correlation 0.6 to 0.9 in the studied case) provides an empirical guide to which correlation patterns a coupled generation model can express before adding more mechanisms.
Reading between the lines
- Because feasibility is demonstrated inside hand-chosen parameter bounds, the true reachable correlation space is likely wider than reported; extending the bounds, or adding a feedback loop between network and density, would probably enlarge the amplitude range and fill gaps in the principal-component plane.
- The observation that high-correlation configurations sit closest to real morphological data suggests a testable hypothesis the paper leaves implicit: real territorial systems occupy a high-correlation regime, and calibrating the network-generation component could estimate an intrinsic correlation for a given real configuration.
- A natural generalization is to control lagged or higher-order dependence, for example fixing lagged cross-correlations in the spatial case; the paper notes the difficulty but does not attempt it, so its claim of second-order control does not extend to third-order statistics.
Signed reviews
Editorial analysis
A structured set of objections, weighed in public.
Referee Report
Summary. The paper proposes a generic framework, formalized in Eqs. (1)-(2), for generating synthetic data that (i) matches real data on aggregated indicators and (ii) controls the second-order correlation structure via a prescribed matrix R. The approach is implemented in two settings: territorial systems, where a population-density model is coupled with a transportation-network model and Latin Hypercube Sampling is used to explore cross-correlations between morphological and network indicators; and financial time-series, where hybrid signals are built by superimposing correlated Wiener-type noise on a real low-frequency component, with an analytical correction (Eq. 11) for the effective correlation. The paper reports a broad range of achievable correlations in the territorial case, good agreement between predicted and observed effective correlations in the financial case for moderate correlations, and an illustrative application to a toy ARMA forecasting task.
Significance. If the claims are substantiated, the paper would provide a useful and generic tool for generating correlated synthetic data at aggregated scales, with potential applications to sensitivity analysis of geosimulation models, benchmarking of multivariate estimators, and construction of testbeds for complex-systems models. The financial application is the stronger part: it implements the formal control condition by construction, gives a testable analytical correction for effective correlations, and validates it on data. The paper also ships open code and data repositories, which is a concrete strength. The territorial application, however, currently demonstrates exploration of feasible correlations rather than a procedure for realizing a user-specified correlation matrix, and this gap directly affects the paper's central 'control' claim.
major comments (3)
- [Results, 'Correlated population density and road network'] The territorial application does not implement the control condition in Eq. (2). No target correlation matrix R is prescribed; instead, parameters are sampled with Latin Hypercube Sampling and the resulting correlation matrices are collected and projected by PCA. This is an exploration of the output space, not a control loop. The paper itself acknowledges this in the Method Formalization ('the control is in this case indirect') and in Future work, but the abstract and title still claim 'second-order control' and 'a new methodology to generate such correlated synthetic data.' As it stands, a user who wants a territorial synthetic dataset with a specified correlation structure has no procedure to obtain it. I recommend either adding an inverse calibration step (e.g., an optimization loop that tunes model parameters to reach a target R, with a demonstration of convergence) or substantially rephrasing the territorial contribution as an exploration of feasible correlations rather than a control method.
- [Correlated financial time-series, Eq. (11)] The correction formula for the effective correlation is central to the financial control claim, but its derivation is not provided and the assumptions are only listed informally ('σ1≫σ0', zero cross-covariance, centered returns). The coefficients ε_i are not defined in the text before Eq. (11), making the formula difficult to reproduce. Please give a complete derivation in an appendix, define ε_i explicitly in terms of the variances of the components, state the order of the approximation, and discuss quantitatively why the deviations seen in Fig. 4 for |ρ|>0.5 and small ω1 are attributable to failure of the stated assumptions.
- [Correlated financial time-series, Eq. (8)] Equation (8) is malformed as printed: the term involving σ1/σ2 does not yield a valid correlation-1 Wiener process unless the variances are handled correctly, and the notation 'W|=1' is garbled. Since this equation is the constructive step for generating two assets with prescribed correlation, please rewrite it in a correct and unambiguous form (e.g., the Cholesky construction W2 = ρ12 W1 + sqrt(1-ρ12^2) W1_perp for equal variances, or the general variance-adjusted version) and state the required variance condition.
minor comments (4)
- [Global] There are several typographical issues, including 'dependancy' in the Introduction and the mixed use of 'Cov' and 'covariance' in Eqs. (2) and (5)-(7); a careful proofread would improve readability.
- [Parameter space] The claim of a 'broad range' of feasible correlations depends on the hand-chosen LHS bounds for α, Nc, rg, d0, kh, γ, and NL. A brief sensitivity check of the correlation range to these bounds, or at least an explicit statement that the range is conditional on the exploration domain, would strengthen the interpretation.
- [Results, Fig. 2] In the bottom-right panel, the color scale is defined as 1 − min_r ‖M − M_r‖, but the index r and the set of real morphological measures are not defined in the figure caption; please specify the reference dataset.
- [Method Formalization, Eq. (2)] The notation Σ^T · R · Σ is confusing when Σ is described as a diagonal matrix; writing Σ R Σ and stating the dimensions of all quantities would remove ambiguity.
Circularity Check
No significant circularity: the financial example uses explicit construction with an independently derived correction, and the territorial part is an emergent-range exploration rather than a fitted prediction.
full rationale
The paper's formal method (Eqs. 1-2) defines a target correlation matrix R, but the territorial application does not fit R and then re-predict it; instead, it samples model parameters with Latin Hypercube Sampling, computes the resulting cross-correlations, and reports the empirically covered range. This is exploration, not a fit disguised as prediction, so the 'broad range of correlations' claim is not circular. The financial application constructs Wiener processes with a prescribed correlation via Eq. 8, which is a direct construction rather than a derived prediction; however, the paper does not stop at that tautology. It derives an effective-correlation correction (Eq. 11) from stated independence and small-ratio assumptions, estimates the correction inputs (rho0 and epsilon_i) from real-data components, and compares the resulting prediction against correlations measured on independently generated synthetic data. The observed deviations for large |rho| show that the test is not vacuous. The paper's self-citations to the author's earlier density-model calibration [36] and network-generation model [38] are used as component inputs, but the coupled model's correlation outputs are computed in this paper against real morphological measures and a null model, so the central feasibility claim does not reduce to those citations. The citation [46] for real effective correlations is ancillary support, not the load-bearing step. Finally, the paper explicitly admits that territorial control is 'indirect and the feasible space of correlations is empirically determined,' which is a limitation or overclaim relative to the title, but an admitted limitation is not circular reasoning. The LHS-bound concern is a robustness issue, not a circularity, because nothing is fitted to those bounds and then renamed as a prediction. Overall, the derivation chain is not circular; the score of 1 reflects only the presence of several self-citations and the gap between the 'control' label and the exploratory territorial demonstration, neither of which makes the argument feed on its own outputs.
Assumptions & free parameters
free parameters (3)
- LHS parameter bounds for density and network models =
α∈[0.5,2], Nc∈[50,120], rg∈[1,100], d0∈[0.1,10], kh∈[0,1], γ∈[0.1,4], NL∈[4,20]
- K (number of potential links in network heuristic) =
5
- Sampling frequencies for financial example =
ω0=24h; ω1∈{30min,1h,2h}
assumptions (5)
- domain assumption The aggregation-diffusion density model calibrated in [36] can reproduce realistic urban morphologies.
- domain assumption The network generation heuristic produces networks whose aggregate indicators are meaningful for correlation analysis.
- domain assumption In the financial part, returns are centered at any scale and Cov[ΔX̃_i^{ω1}, ΔX_j^{ω}] = 0 for all i,j, ω1>ω.
- domain assumption Black-Scholes dynamics with correlated Wiener processes are a sufficient model for the high-frequency component of financial time-series.
- standard math The cross-correlation estimator (Eqs. 5-7) is unbiased and consistent for the generated processes.
Cite this review
Pith. "Pith review of Second-order Control of Complex Systems with Correlated Synthetic Data." pith.science (2026). https://pith.science/paper/CWYC5H2T
@misc{pith2026190802034,
  author       = {Pith},
  title        = {Pith review of: Second-order Control of Complex Systems with Correlated Synthetic Data},
  year         = {2026},
  howpublished = {\url{https://pith.science/paper/CWYC5H2T}},
  note         = {Machine review of arXiv:1908.02034}
}
read the original abstract
The generation of synthetic data is an essential tool to study complex systems, allowing for example to test models of these in precisely controlled settings, or to parametrize simulation models when data is missing. This paper focuses on the generation of synthetic data with an emphasis on correlation structure. We introduce a new methodology to generate such correlated synthetic data. It is implemented in the field of socio-spatial systems, more precisely by coupling an urban growth model with a transportation network generation model. We also show the genericity of the method with an application on financial time-series. The simulation results show that the generation of correlated synthetic data for such systems is indeed feasible within a broad range of correlations, and suggest applications of such synthetic datasets.
Figures


Figures from the paper (2 more)


Reference graph
Works this paper leans on
-
[1]
Journal of the American Statistical Association 105(490) (2010)
Abadie, A., Diamond, A., Hainmueller, J.: Synthetic control methods for comparative case studies: Estimating the effect of california’s tobacco control program. Journal of the American Statistical Association 105(490) (2010)
work page 2010
-
[2]
Moeckel, R., Spiekermann, K., Wegener, M.: Creating a synthetic population. In: Proceedings of the 8th International Conference on Computers in Urban Planning and Urban Management (CUPUM) (2003)
work page 2003
-
[3]
In: Transportation Research Board 88th Annual Meeting (2009)
Pritchard, D.R., Miller, E.J.: Advances in agent population synthesis and application in an integrated land use and transportation model. In: Transportation Research Board 88th Annual Meeting (2009)
work page 2009
-
[4]
Knowledge and information systems 34(3), 483–519 (2013) 15
Bol´ on-Canedo, V., S´ anchez-Maro˜ no, N., Alonso-Betanzos, A.: A review of feature selection methods on synthetic data. Knowledge and information systems 34(3), 483–519 (2013) 15
work page 2013
-
[5]
BMC bioinformatics 7(1), 43 (2006)
Van den Bulcke, T., Van Leemput, K., Naudts, B., van Remortel, P., Ma, H., Verschoren, A., De Moor, B., Marchal, K.: Syntren: a generator of synthetic gene expression data for design and analysis of structure learning algorithms. BMC bioinformatics 7(1), 43 (2006)
work page 2006
-
[6]
Transportation Research Part A: Policy and Practice 30(6), 415–429 (1996)
Beckman, R.J., Baggerly, K.A., McKay, M.D.: Creating synthetic baseline populations. Transportation Research Part A: Policy and Practice 30(6), 415–429 (1996)
work page 1996
-
[7]
Arbeitsberichte Verkehrs-und Raumplanung 638 (2010)
M¨ uller, K., Axhausen, K.W.: Population synthesis for microsimulation: State of the art. Arbeitsberichte Verkehrs-und Raumplanung 638 (2010)
work page 2010
-
[8]
Transportation Science 47(2), 266–279 (2013)
Barthelemy, J., Toint, P.L.: Synthetic population generation without a sample. Transportation Science 47(2), 266–279 (2013)
work page 2013
Show all 59 references
-
[9]
University of Arkansas, Ann Arbor (2008)
Hoag, J.E.: Synthetic Data Generation: Theory, Techniques and Applications. University of Arkansas, Ann Arbor (2008)
2008
-
[10]
IEEE Internet Computing 12(3), 78–82 (2008)
Eno, J., Thompson, C.W.: Generating synthetic data to match data mining patterns. IEEE Internet Computing 12(3), 78–82 (2008)
2008
-
[11]
Conference on Complex Systems, Tempe, Arizona (2015)
Arthur, W.B.: Complexity and the Shift in Modern Science. Conference on Complex Systems, Tempe, Arizona (2015)
2015
-
[12]
Transportation Research Record: Journal of the Transportation Research Board (2254), 36–43 (2011)
Ye, X.: Investigation of underlying distributional assumption in nested logit model using copula-based simulation and numerical approximation. Transportation Research Record: Journal of the Transportation Research Board (2254), 36–43 (2011)
2011
-
[13]
Environment and planning A 20(12), 1645–1671 (1988)
Birkin, M., Clarke, M.: Synthesis—a synthetic spatial information system for urban and regional analysis: methods and examples. Environment and planning A 20(12), 1645–1671 (1988)
1988
-
[14]
In: Advances in Database Technology: Proceedings
Li, H., Xiong, L., Jiang, X.: Differentially private synthesization of multi-dimensional data using copula functions. In: Advances in Database Technology: Proceedings. International Conference on Extending Database Technology, vol. 2014, p. 475 (2014). NIH Public Access
2014
-
[15]
SIAM review 45(2), 167–256 (2003)
Newman, M.E.: The structure and function of complex networks. SIAM review 45(2), 167–256 (2003)
2003
-
[16]
Water Resources Research 29(7), 2385–2397 (1993)
Robin, M., Gutjahr, A., Sudicky, E., Wilson, J.: Cross-correlated random field generation with the direct fourier transform method. Water Resources Research 29(7), 2385–2397 (1993)
1993
-
[17]
SIAM Journal on Scientific Computing 39(5), 543–562 (2017)
Osborn, S., Vassilevski, P.S., Villa, U.: A multilevel, hierarchical sampling technique for spatially correlated random fields. SIAM Journal on Scientific Computing 39(5), 543–562 (2017)
2017
-
[18]
Atmospheric Chemistry and Physics 10(13), 6151–6167 (2010)
Gourdji, S., Hirsch, A., Mueller, K., Yadav, V., Andrews, A., Michalak, A.: Regional-scale geostatistical inverse modeling of north american co 2 fluxes: a synthetic data study. Atmospheric Chemistry and Physics 10(13), 6151–6167 (2010)
2010
-
[19]
Mechanical Systems and Signal Processing 112, 384–400 (2018)
Zhao, T., Wang, Y.: Simulation of cross-correlated random field samples from sparse measurements using bayesian compressive sensing. Mechanical Systems and Signal Processing 112, 384–400 (2018)
2018
-
[20]
John Wiley & Sons, Chichester (2004)
Benenson, I., Torrens, P.: Geosimulation: Automata-based Modeling of Urban Phenomena. John Wiley & Sons, Chichester (2004)
2004
-
[21]
MIT Press, Cambridge (2013)
Batty, M.: The New Science of Cities. MIT Press, Cambridge (2013)
2013
-
[22]
In: International and Transnational Perspectives on Urban Systems, pp
Pumain, D.: An evolutionary theory of urban systems. In: International and Transnational Perspectives on Urban Systems, pp. 3–18. Springer, Singapore (2018)
2018
-
[23]
In: Proceedings of the 9th International Conference on Computers in Urban Planning and Urban Management, pp
Banos, A., Chardonnel, S., Lang, C., Marilleau, N., Th´ evenin, T.: Simulating the swarming city: a mas approach. In: Proceedings of the 9th International Conference on Computers in Urban Planning and Urban Management, pp. 29–30 (2005)
2005
-
[24]
Journal of the Royal Statistical Society: Series D (The Statistician) 47(3), 431–443 (1998) 16
Brunsdon, C., Fotheringham, S., Charlton, M.: Geographically weighted regression. Journal of the Royal Statistical Society: Series D (The Statistician) 47(3), 431–443 (1998) 16
1998
-
[25]
Environment and Planning B 24, 287–306 (1997)
Sanders, L., Pumain, D., Mathian, H., Gu´ erin-Pace, F., Bura, S.: Simpop: a multiagent system for the study of urbanism. Environment and Planning B 24, 287–306 (1997)
1997
-
[26]
PhD thesis, Paris 1 (2014)
Schmitt, C.: Mod´ elisation de la dynamique des syst` emes de peuplement: de simpoplocal ` a simpopnet. PhD thesis, Paris 1 (2014)
2014
-
[27]
Journal of Artificial Societies and Social Simulation 22(4) (2019)
Raimbault, J., Cottineau, C., Le Texier, M., Le N´ echet, F.L., Reuillon, R.: Space matters: extending sensitivity analysis to initial spatial conditions in geosimulation models. Journal of Artificial Societies and Social Simulation 22(4) (2019)
2019
-
[28]
Environment and Planning A 44(5), 1101–1120 (2012)
Arentze, T., van den Berg, P., Timmermans, H.: Modeling social networks in geographic space: approach and empirical application. Environment and Planning A 44(5), 1101–1120 (2012)
2012
-
[29]
Geographical Analysis 12(4), 340–352 (1980)
Pigozzi, B.W.: Interurban linkages through polynomially constrained distributed lags. Geographical Analysis 12(4), 340–352 (1980)
1980
-
[30]
Chaos, Solitons & Fractals 41(2), 603–614 (2009)
Chen, Y.: Urban gravity model based on cross-correlation function and fourier analyses of spatio-temporal process. Chaos, Solitons & Fractals 41(2), 603–614 (2009)
2009
-
[31]
Offner, J.-M., Pumain, D.: R´ eseaux et territoires-significations crois´ ees (1996)
1996
-
[32]
Espace g´ eographique22(3), 233–242 (1993)
Offner, J.-M.: Les ”effets structurants” du transport: mythe politique, mystification scientifique. Espace g´ eographique22(3), 233–242 (1993)
1993
-
[33]
Hdr, Universit´ e Panth´ eon-Sorbonne - Paris I (June 2009)
Bretagnolle, A.: Villes et r´ eseaux de transport : des interactions dans la longue dur´ ee, France, Europe, ´Etats-Unis. Hdr, Universit´ e Panth´ eon-Sorbonne - Paris I (June 2009)
2009
-
[34]
PhD thesis, Universit´ e Paris 7 Denis Diderot (2018)
Raimbault, J.: Caract´ erisation et mod´ elisation de la co-´ evolution des r´ eseaux de transport et des territoires. PhD thesis, Universit´ e Paris 7 Denis Diderot (2018)
2018
-
[35]
In: Hierarchy in Natural and Social Sciences, pp
Batty, M.: Hierarchy in cities and city systems. In: Hierarchy in Natural and Social Sciences, pp. 143–168. Springer, Dordrecht (2006)
2006
-
[36]
PloS one 13(9), 0203516 (2018)
Raimbault, J.: Calibration of a density-based model of urban morphogenesis. PloS one 13(9), 0203516 (2018)
2018
-
[37]
http://ec.europa.eu/eurostat/web/gisco (2014)
EUROSTAT: Eurostat Geographical Data. http://ec.europa.eu/eurostat/web/gisco (2014)
2014
-
[38]
In: Artificial Life Conference Proceedings, pp
Raimbault, J.: Multi-modeling the morphogenesis of transportation networks. In: Artificial Life Conference Proceedings, pp. 382–383 (2018). MIT Press
2018
-
[39]
Science 327(5964), 439–442 (2010)
Tero, A., Takagi, S., Saigusa, T., Ito, K., Bebber, D.P., Fricker, M.D., Yumiki, K., Kobayashi, R., Nakagaki, T.: Rules for biologically inspired adaptive network design. Science 327(5964), 439–442 (2010)
2010
-
[40]
Physical Review E 83(3), 036106 (2011)
Courtat, T., Gloaguen, C., Douady, S.: Mathematics and morphogenesis of cities: A geometrical approach. Physical Review E 83(3), 036106 (2011)
2011
-
[41]
Journal of Interdisciplinary Methods and Issues in Science
Raimbault, J.: Multi-dimensional urban network percolation. Journal of Interdisciplinary Methods and Issues in Science. In press (2019)
2019
-
[42]
Cybergeo: European Journal of Geography (2015)
Le N´ echet, F.: De la forme urbaine ` a la structure m´ etropolitaine: une typologie de la configuration interne des densit´ es pour les principales m´ etropoles europ´ eennes de l’audit urbain. Cybergeo: European Journal of Geography (2015)
2015
-
[43]
In: Agent-based Models of Geographical Systems, pp
Banos, A., Genre-Grandpierre, C.: Towards new metrics for urban road networks: Some preliminary evidence from agent-based simulations. In: Agent-based Models of Geographical Systems, pp. 627–641. Springer, Dordrecht (2012)
2012
-
[44]
Future Generation Computer Systems 29(8), 1981–1990 (2013)
Reuillon, R., Leclaire, M., Rey-Coyrehourcq, S.: Openmole, a workflow engine specifically tailored for the distributed exploration of simulation models. Future Generation Computer Systems 29(8), 1981–1990 (2013)
2013
-
[45]
Wilensky, U.: Netlogo (1999)
1999
-
[46]
In: The Mathematics of Urban Morphology, pp
Raimbault, J.: An urban morphogenesis model capturing interactions between networks and territories. In: The Mathematics of Urban Morphology, pp. 383–409. Springer, Cham (2019) 17
2019
-
[47]
Cambridge university press, Cambridge (2000)
Mantegna, R.N., Stanley, H.E.: An Introduction to Econophysics: Correlations and Complexity in Finance. Cambridge university press, Cambridge (2000)
2000
-
[48]
ArXiv e-prints (2009)
Bouchaud, J.P., Potters, M.: Financial Applications of Random Matrix Theory: a short review. ArXiv e-prints (2009). 0910.1205
2009 arXiv
-
[49]
Physica A Statistical Mechanics and its Applications 299, 16–27 (2001)
Bonanno, G., Lillo, F., Mantegna, R.N.: Levels of complexity in financial markets. Physica A Statistical Mechanics and its Applications 299, 16–27 (2001). cond-mat/0104369
2001 arXiv
-
[50]
Proceedings of the National Academy of Sciences of the United States of America 102, 10421–10426 (2005)
Tumminello, M., Aste, T., Di Matteo, T., Mantegna, R.N.: A tool for filtering information in complex systems. Proceedings of the National Academy of Sciences of the United States of America 102, 10421–10426 (2005)
2005
-
[51]
Journal of Econometrics 162, 149–169 (2011)
Barndorff-Nielsen, O.E., Hansen, P.R., Lunde, A., Shephard, N.: Multivariate realised kernels: consistent positive semi-definite estimators of the covariation of equity prices with noise and non-synchronous trading. Journal of Econometrics 162, 149–169 (2011)
2011
-
[52]
Studies in Nonlinear Dynamics & Econo- metrics 6 (2002)
Ramsey, J.B.: Wavelets in economics and finance: Past and future. Studies in Nonlinear Dynamics & Econo- metrics 6 (2002)
2002
-
[53]
The European Physical Journal B-Condensed Matter and Complex Systems 13(3), 595–599 (2000)
Bouchaud, J.-P., Potters, M., Meyer, M.: Apparent multifractality in financial time series. The European Physical Journal B-Condensed Matter and Complex Systems 13(3), 595–599 (2000)
2000
-
[54]
merton and myron s
Jarrow, R.A.: In honor of the nobel laureates robert c. merton and myron s. scholes: A partial differential equation that changed the world. The Journal of Economic Perspectives, 229–248 (1999)
1999
-
[55]
Tsay, R.S.: MTS: All-Purpose Toolkit for Analyzing Multivariate Time Series (MTS) and Estimating Multivariate Volatility Models. (2015). R package version 0.33. http://CRAN.R-project.org/package=MTS
2015
-
[56]
Transactions in GIS 14(4), 435–459 (2010)
Girres, J.-F., Touya, G.: Quality assessment of the french openstreetmap dataset. Transactions in GIS 14(4), 435–459 (2010)
2010
-
[57]
Quantitative Finance 15(11), 1789–1804 (2015)
Chicheportiche, R., Bouchaud, J.-P.: A nested factor model for non-linear dependencies in stock returns. Quantitative Finance 15(11), 1789–1804 (2015)
2015
-
[58]
PLoS ONE 10(9), 0138212 (2015)
Ch´ erel, G., Cottineau, C., Reuillon, R.: Beyond corroboration: Strengthening model validation by looking for unexpected patterns. PLoS ONE 10(9), 0138212 (2015)
2015
-
[59]
arXiv preprint arXiv:0907.2221 (2009) 18
Bourgine, P., Chavalarias, D., al.: French Roadmap for complex Systems 2008-2009. arXiv preprint arXiv:0907.2221 (2009) 18
2009 arXiv
Reviewed August 14, 2026 · model on record in the stance chip above.
Discussion (0). Continue with ORCID to comment.