NO molecule in massive star forming regions
Pith reviewed 2026-06-26 04:18 UTC · model grok-4.3
The pith
NO emission in massive star-forming regions shows intensities and widths matching non-shock molecules rather than SiO, indicating shocks are not required for its formation.
A machine-rendered reading of the paper's core claim, the machinery that carries it, and where it could break.
Core claim
In a sample of 36 massive star-forming regions spanning infrared dark clouds, protostars, and H II regions, the integrated intensities and relative abundances of NO track those of c-C3H2 while remaining dissimilar to SiO; line widths of NO likewise remain closer to c-C3H2 than to SiO, leading to the claim that shock chemistry is not a dominant formation route for NO in the observed sources.
What carries the argument
Direct comparison of NO integrated intensities, beam-averaged column densities, H2-relative abundances, and line widths against the shock tracer SiO and the non-shock tracer c-C3H2 across the 28 detections.
If this is right
- NO can form efficiently through routes that operate in the absence of strong shocks.
- Chemical networks for nitrogen-bearing species in star-forming gas must include significant non-shock pathways to NO.
- NO is unlikely to serve as a reliable shock indicator in massive star-forming regions.
- Abundance estimates for NO derived from single-dish observations can be used without large shock corrections in these environments.
Where Pith is reading between the lines
- If NO formation is largely independent of shocks, its abundance may trace total nitrogen chemistry or UV processing in more quiescent gas.
- Multi-transition mapping of NO together with c-C3H2 and SiO could test whether the similarity holds at higher spatial resolution.
- Extending the survey to low-mass star-forming regions would show whether the same lack of shock dependence appears outside massive environments.
Load-bearing premise
That matching NO properties to those of c-C3H2 while differing from SiO is enough to rule out significant shock-driven NO production.
What would settle it
A clear positive correlation between NO abundance and SiO abundance (or line width) across a larger sample, or direct detection of elevated NO only in the strongest SiO-emitting shocks.
Figures


read the original abstract
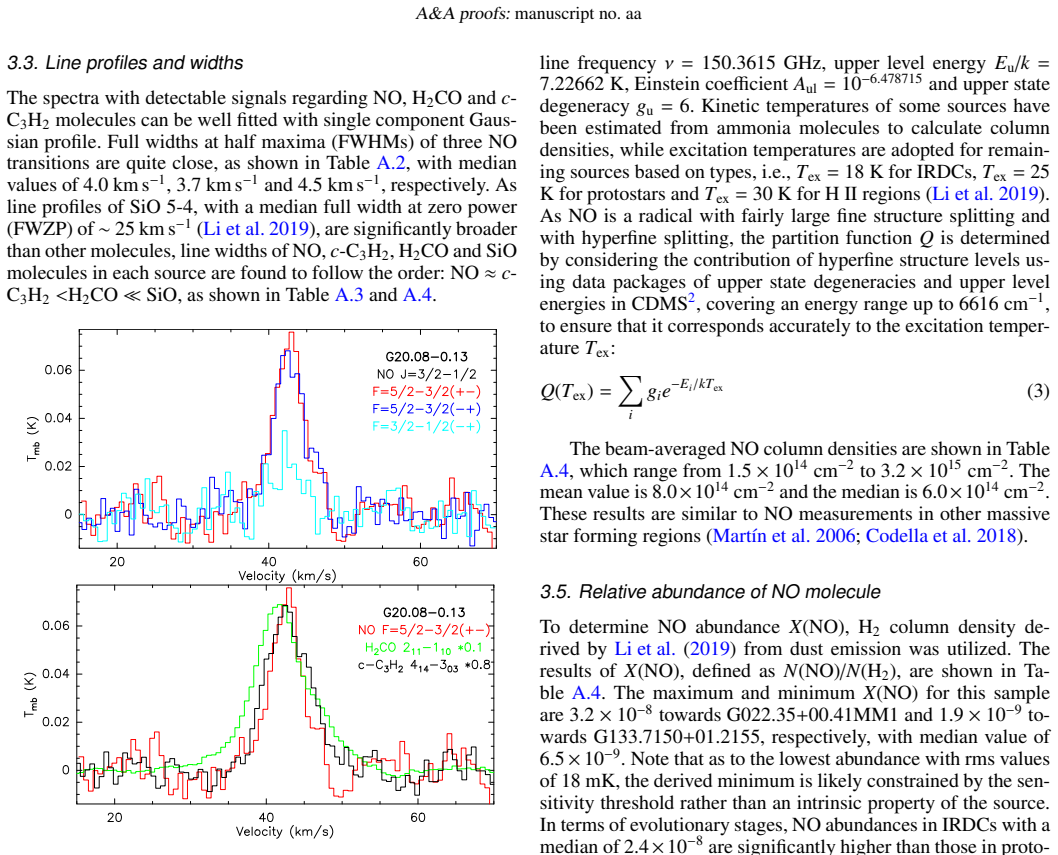
Context. Among diatomic molecules composed of the abundant elements C, N and O, NO has been detected far less than the well studied CN and CO, making it a crucial yet under-observed component in nitrogen-containing chemical networks. NO was thought to serve as a potential tracer of shocks, as evidenced with orders abundance enhancements reported in literature. Aims. Large-sample observations for NO molecule in widespread interstellar environments are needed to confirm if the enhancement of NO is due to shock chemistry or not. Methods. Single-point survey for NO lines around 150 GHz was carried out by Arizona Radio Observatory 12-meter telescope towards a sample of 36 massive star forming regions containing SiO emission, which include three evolutionary stages: 4 IRDCs, 6 protostars and 26 H II regions. Results. The NO emission was detected in 28 sources with a detection rate of 78%. Beam-averaged NO column densities and abundances relative to H2 were derived from integrated intensities of two main hyperfine lines. Correlations between NO and SiO in integrated intensity and relative abundance are similar to the corresponding correlations of c-C3H2, indicating that NO enrichment may not significantly involve pronounced shock activities, which coincides with the trend in line widths: NO is close to c-C3H2, both smaller than H2CO and far smaller than SiO. Conclusions. Observational evidence does not strongly support significant NO enhancement by shock chemistry in the observed sources, indicating that the formation of NO does not necessarily require shocks.
Editorial analysis
A structured set of objections, weighed in public.
Referee Report
Summary. The manuscript reports single-dish observations of NO lines near 150 GHz toward 36 massive star-forming regions selected for the presence of SiO emission (4 IRDCs, 6 protostars, 26 H II regions). NO is detected in 28 sources (78% detection rate). Beam-averaged column densities and H2 abundances are derived from the two main hyperfine components. Integrated-intensity and abundance correlations of NO with SiO are reported to be similar to those with the non-shock tracer c-C3H2; line widths of NO are also stated to be similar to c-C3H2 and smaller than those of SiO (and H2CO). The central conclusion is that the observations do not strongly support significant NO enhancement by shock chemistry and that NO formation does not necessarily require shocks.
Significance. If the interpretive conclusion holds, the work supplies a substantial new observational sample constraining nitrogen chemistry in massive star-forming regions and weakens the case for NO as a reliable shock tracer. The sample size, use of two hyperfine lines for column-density estimates, and direct multi-tracer comparison (SiO, c-C3H2, H2CO) are positive features that allow a falsifiable test of the shock hypothesis within the selected sources.
major comments (2)
- [Results] Results section (paragraph on correlations): the statement that 'correlations between NO and SiO in integrated intensity and relative abundance are similar to the corresponding correlations of c-C3H2' is presented without any quantitative statistic (Pearson/Spearman coefficient, p-value, or slope comparison). Because this similarity is the primary evidence offered against dominant shock chemistry, the absence of a numerical test makes the central claim difficult to evaluate.
- [Results] Column-density derivation (Results/Methods): no uncertainties, error bars, or propagation details are given for the beam-averaged NO column densities or abundances, and the excitation-temperature or optical-depth assumptions used with the hyperfine lines are not stated. These omissions directly affect the reliability of the abundance comparisons and line-width trends that support the conclusion.
minor comments (1)
- [Abstract] Abstract: H2CO is invoked in the line-width comparison without identifying its chemical role or why it is included alongside c-C3H2 and SiO; a single clarifying phrase would improve clarity.
Simulated Author's Rebuttal
We thank the referee for the constructive comments on our manuscript. We address each major comment below and will revise the manuscript to incorporate the suggested improvements for greater rigor and clarity.
read point-by-point responses
-
Referee: [Results] Results section (paragraph on correlations): the statement that 'correlations between NO and SiO in integrated intensity and relative abundance are similar to the corresponding correlations of c-C3H2' is presented without any quantitative statistic (Pearson/Spearman coefficient, p-value, or slope comparison). Because this similarity is the primary evidence offered against dominant shock chemistry, the absence of a numerical test makes the central claim difficult to evaluate.
Authors: We agree that the absence of quantitative correlation statistics limits the strength of the comparison. In the revised manuscript we will compute and report Pearson and Spearman rank correlation coefficients (with associated p-values) for the integrated-intensity and abundance relations between NO and SiO, and between NO and c-C3H2. We will also include the best-fit slopes for direct numerical comparison. These additions will allow readers to evaluate the degree of similarity objectively. revision: yes
-
Referee: [Results] Column-density derivation (Results/Methods): no uncertainties, error bars, or propagation details are given for the beam-averaged NO column densities or abundances, and the excitation-temperature or optical-depth assumptions used with the hyperfine lines are not stated. These omissions directly affect the reliability of the abundance comparisons and line-width trends that support the conclusion.
Authors: We acknowledge these omissions. The revised Methods section will explicitly state the excitation-temperature assumption (LTE at a fixed T_ex derived from the hyperfine intensity ratio), the treatment of optical depth, and the full error-propagation procedure (including calibration, baseline, and fitting uncertainties). Error bars will be added to the column-density and abundance values in tables and figures, and the line-width comparisons will be presented with the corresponding uncertainties. revision: yes
Circularity Check
No significant circularity identified
full rationale
The paper presents new single-point observations of NO lines toward 36 massive star-forming regions, reports detections in 28 sources, derives beam-averaged column densities directly from integrated intensities of two hyperfine lines, and compares those intensities, abundances, and line widths to the non-shock tracer c-C3H2 and the shock tracer SiO. No equations, fitted parameters, or self-citations are invoked that reduce the central claim (shock chemistry not required) to a quantity defined by the authors' own inputs or prior work. The derivation chain is therefore self-contained observational comparison.
Axiom & Free-Parameter Ledger
axioms (1)
- domain assumption Standard assumptions for converting integrated line intensity to beam-averaged column density (excitation temperature, optical depth, partition function) are valid for the observed NO hyperfine lines.
Reference graph
Works this paper leans on
-
[1]
R., Hily-Blant, P., Pineau Des Forêts, G., & Walmsley, C
Akyilmaz, M., Flower, D. R., Hily-Blant, P., Pineau Des Forêts, G., & Walmsley, C. M. 2007, A&A, 462, 221 Ben Khalifa, M. & Loreau, J. 2021, MNRAS, 508, 1908
2007
-
[2]
A., Sutton, E
Blake, G. A., Sutton, E. C., Masson, C. R., & Phillips, T. G. 1986, ApJS, 60, 357
1986
-
[3]
2018, MNRAS, 474, 5694
Codella, C., Viti, S., Lefloch, B., et al. 2018, MNRAS, 474, 5694
2018
-
[4]
2011, Science, 334, 1538
Daranlot, J., Jorfi, M., Xie, C., et al. 2011, Science, 334, 1538
2011
-
[5]
1993, A&A, 276, 473
Fuente, A., Martin-Pintado, J., Cernicharo, J., & Bachiller, R. 1993, A&A, 276, 473
1993
-
[6]
1993, A&A, 268, 212
Gerin, M., Viala, Y ., & Casoli, F. 1993, A&A, 268, 212
1993
-
[7]
1992, A&A, 266, 463
Gerin, M., Viala, Y ., Pauzat, F., & Ellinger, Y . 1992, A&A, 266, 463
1992
-
[8]
1988, Exploration of Halley’s Comet
Grewing, M., Praderie, F., & Reinhard, R., eds. 1988, Exploration of Halley’s Comet
1988
-
[9]
& Klemperer, W
Herbst, E. & Klemperer, W. 1973, ApJ, 185, 505
1973
-
[10]
2010, A&A, 513, A41
Hily-Blant, P., Walmsley, M., Pineau Des Forêts, G., & Flower, D. 2010, A&A, 513, A41
2010
-
[11]
Howard, M. J. & Smith, I. W. M. 1980, Chemical Physics Letters, 69, 40
1980
-
[12]
J., Spaans, M., Hogerheijde, M
Jansen, D. J., Spaans, M., Hogerheijde, M. R., & van Dishoeck, E. F. 1995, A&A, 303, 541
1995
-
[13]
B., Penzias, A
Jefferts, K. B., Penzias, A. A., & Wilson, R. W. 1970, ApJ, 161, L87
1970
-
[14]
Koelemay, L. A. & Ziurys, L. M. 2025, ApJ, 986, 122
2025
-
[15]
2019, ApJ, 878, 29
Li, S., Wang, J., Fang, M., et al. 2019, ApJ, 878, 29
2019
-
[16]
Lique, F., van der Tak, F. F. S., Kłos, J., Bulthuis, J., & Alexander, M. H. 2009, A&A, 493, 557
2009
-
[17]
Liszt, H. S. & Turner, B. E. 1978, ApJ, 224, L73 Martín, S., Mauersberger, R., Martín-Pintado, J., García-Burillo, S., & Henkel, C. 2003, A&A, 411, L465 Martín, S., Mauersberger, R., Martín-Pintado, J., Henkel, C., & García-Burillo, S. 2006, ApJS, 164, 450
1978
-
[18]
1992, A&A, 254, 315
Martin-Pintado, J., Bachiller, R., & Fuente, A. 1992, A&A, 254, 315
1992
-
[19]
M., Irvine, W
McGonagle, D., Ziurys, L. M., Irvine, W. M., & Minh, Y . C. 1990, ApJ, 359, 121
1990
-
[20]
2001, ApJS, 132, 127
Nummelin, A., Bergman, P., Hjalmarson, Å., et al. 2001, ApJS, 132, 127
2001
-
[21]
1993, Chemical Physics, 174, 71
Pauzat, F., Ellinger, Y ., Berthier, G., Gerin, M., & Viala, Y . 1993, Chemical Physics, 174, 71
1993
-
[22]
2013, A&A, 560, L2
Quintana-Lacaci, G., Agúndez, M., Cernicharo, J., et al. 2013, A&A, 560, L2
2013
-
[23]
D., Jones, P
Tremblay, C. D., Jones, P. A., Cunningham, M., et al. 2018, ApJ, 860, 145 Velilla Prieto, L., Sánchez Contreras, C., Cernicharo, J., et al. 2015, A&A, 575, A84
2018
-
[24]
W., Jefferts, K
Wilson, R. W., Jefferts, K. B., & Penzias, A. A. 1970, ApJ, 161, L43
1970
-
[25]
M., McGonagle, D., Minh, Y ., & Irvine, W
Ziurys, L. M., McGonagle, D., Minh, Y ., & Irvine, W. M. 1991, ApJ, 373, 535 Article number, page 6 Su et al.: NO molecule in massive star forming regions Appendix A: Tables Table A.1.Detection of NO molecule in 36 sources. F=5/2 + - 3/2− F=5/2 − - 3/2+ F=3/2 − - 1/2+ Number of sources YES YES NO 11 YES YES YES 17 YES NO NO 0 NO YES NO 5 NO NO NO 3 Table ...
1991
discussion (0)
Sign in with ORCID, Apple, or X to comment. Anyone can read and Pith papers without signing in.