REVIEW 3 major objections 5 minor 46 references
photo-3x2-pt: Cosmology from cosmic shear and galaxy clustering with a single photometric galaxy catalog
T0 review · 3 major / 5 minor · reviewed 2026-08-08 · deepseek-v4-flash
Pith's one-line read Combining galaxy clustering, galaxy-shear cross-correlation, and cosmic shear from the same photometric galaxy catalog tightens the S8 constraint by about 25% while remaining consistent with shear-only results.
desk verdict A careful first HSC-Y3 photo-3x2-pt measurement whose 25% S8 tightening depends on clustering systematics not exercised by the mocks; worth refereeing with a request for end-to-end validation. read the letter →
The pith
A machine-rendered reading of the paper's core claim, the machinery that carries it, and where it could break.
The reading
What carries the argument
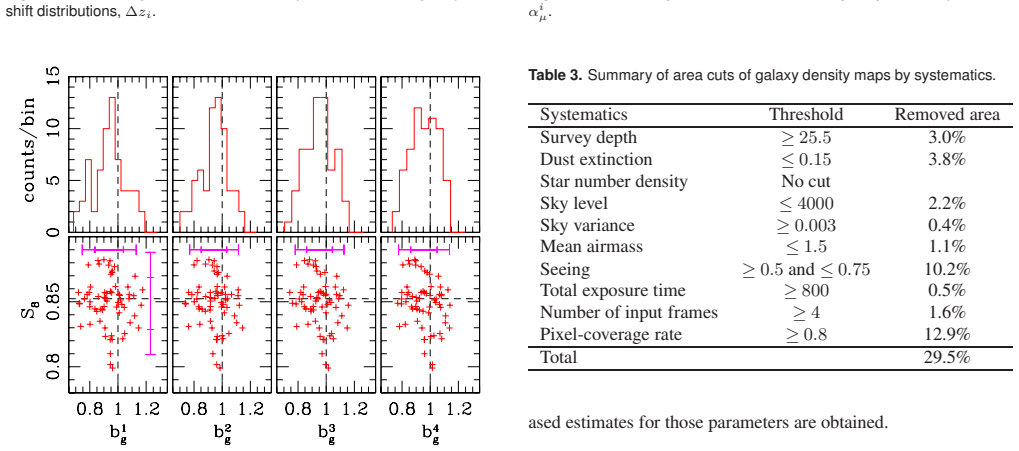
The data vector consists of 96 band-power measurements: ten shear-shear, ten galaxy-shear, and four galaxy clustering auto-spectra, with four band powers each; the scale cuts are $317 \le \ell \le 1000$ for shear-shear and $178 \le \ell \le 562$ for the other two. The power spectra are computed with the pseudo-$C_\ell$ formalism, and the galaxy density maps are cleaned by cutting about 29.5% of the survey area where observing conditions correlate with galaxy density and then deprojecting contaminant template maps. The load-bearing mechanism for the improved $S_8$ is the self-calibration: because the galaxy clustering kernel is directly proportional to the redshift distribution, the clustering auto-spectra constrain the $\Delta z_i$ shift parameters that otherwise inflate shear-only errors, while the galaxy-shear spectra constrain the intrinsic alignment amplitudes.
What would settle it
Apply the same photo-3x2pt pipeline to mock catalogs that include realistic spatial maps of seeing, depth, extinction, and sky level, impose the same area cuts and deprojection, and check whether the mean recovered $S_8$ over many realizations equals the input value within the quoted error; a shift larger than the statistical uncertainty would show the mitigation is biased.
Extended reading notes
Core claim
The central claim is that the photo-3x2-pt data vector, built from the same photometric galaxy catalog that supplies the shear sample, constrains $S_8$ to $0.76 \le S_8 \le 0.81$ at 68% credibility. This interval overlaps the results of the HSC-Y3 cosmic shear studies but is about 25% narrower. The improvement is attributed to the added sensitivity to the two nuisance parameters that dominate shear-only errors: the intrinsic alignment amplitude, which the galaxy-shear spectra help pin down, and the shift parameters of the source redshift distributions, which the galaxy clustering auto-spectra effectively self-calibrate. The paper also reports that the measured B-mode power spectra are consistent with zero, and that mock-catalog inferences recover unbiased values of $S_8$, intrinsic alignment parameters, galaxy clustering bias, and redshift shift parameters.
Load-bearing premise
The result stands or falls on whether the area cuts and template deprojection remove observing-condition contaminants from the galaxy density maps without biasing the cosmological clustering signal, a step the mock test does not exercise because it omits observational condition variations and area cuts.
Editorial extensions
If this is right
- The $S_8$ credible interval narrows by roughly 25% relative to the HSC-Y3 cosmic shear-only analyses, with a consistent central value.
- The shift parameters $\Delta z_3$ and $\Delta z_4$ for the two highest redshift bins are constrained about 30% more tightly, removing the main nuisance-driven error of shear-only analyses.
- No significant B-mode signal is found in the galaxy-shear or shear-shear spectra, supporting the adopted scale cuts.
- Because the extra information comes from the same galaxies already used for the shear catalog, the method requires no separate spectroscopic lens sample and can be applied to other photometric surveys.
Reading between the lines
- If this result holds, photo-3x2pt analyses could reduce the reliance of Stage-IV weak lensing surveys on external photometric redshift calibration, since the clustering spectra self-calibrate the relevant shifts.
- Beyond the paper, the same single-catalog strategy could be combined with a spectroscopic lens sample in a 6x2pt analysis; the paper's mock validation gives partial empirical support for that extension.
- A testable prediction of the mechanism is that adding clustering and galaxy-shear spectra should shrink the $S_8$ posterior mainly by narrowing the $\Delta z_3$ and $\Delta z_4$ and intrinsic alignment directions, which could be verified by inspecting posterior covariances.
- The area-cut thresholds in this paper are chosen from the data; a stronger validation would be to inject simulated systematics into mocks with realistic observing conditions and confirm that the recovery remains unbiased.
Editorial analysis
A structured set of objections, weighed in public.
Referee Report
Summary. This paper presents a joint "photo-3x2-pt" cosmological analysis using the HSC-Y3 weak lensing shape catalog: it measures shear-shear, galaxy-shear, and galaxy clustering angular power spectra with the pseudo-C_ell method, mitigates systematics in the galaxy density maps via area cuts and template deprojection, and performs a Bayesian parameter inference with nuisance parameters for intrinsic alignments, galaxy bias, lensing magnification, baryonic feedback, and redshift distribution shifts. For a flat LCDM model the paper reports a 68% credible interval 0.76 <= S8 <= 0.81, which it states is consistent with the HSC-Y3 cosmic shear results of Dalal et al. (2023) and Li et al. (2023) but about 25% tighter. The analysis is supported by mock catalogs built from N-body and ray-tracing simulations, with 64 realizations, which are used to test unbiased recovery of S8, IA amplitudes, galaxy bias, and redshift shift parameters.
Significance. If the central claim holds, the paper demonstrates an important practical result: adding galaxy clustering and galaxy-shear spectra from the same photometric catalog used for cosmic shear can self-calibrate nuisance parameters such as intrinsic alignment amplitudes and redshift distribution shifts, yielding a tighter and apparently unbiased S8 constraint than cosmic shear alone. This is relevant for current Stage-III analyses and for the design of Stage-IV 3x2-pt and 6x2-pt analyses. The paper has clear strengths: it uses public, widely used software (NaMaster, CAMB, MultiNest, OneCovariance); it reports B-mode null tests for the new galaxy-shear and shear-shear combinations; it performs a non-trivial mock validation with 64 realizations; and it checks robustness of the S8 result against several modeling choices (IA model variants, baryonic feedback, galaxy bias redshift dependence). The main weakness is that the most aggressive systematics-mitigation steps applied to the real galaxy density maps, namely the 29.5% area cut and the template deprojection, are not exercised by the mock validation, which leaves a gap in the evidence for the central claim.
major comments (3)
- [Appendix 2 and Section 3.2.3] The end-to-end validation of the galaxy clustering systematics mitigation is missing, and this is load-bearing for the central claim. The real clustering spectra are produced after two steps: data-driven area cuts that remove 29.5% of the survey area (Table 3) and template deprojection of six contaminant maps (Section 3.2.3). The thresholds in Table 3 are chosen by inspecting the relation between galaxy number density and the systematics maps in the same data; for example, the seeing cut includes a lower threshold set because "the slope of the correlation fluctuated erratically" (Appendix 2). The mock validation explicitly does not exercise these steps: Appendix A.1.3 states "No area cut by observational conditions was made for galaxy density map as any variations of observational conditions were not considered in creating mock data." The template deprojection is likewise not tested in the mocks. If the area cuts preferentially remove over- or underdense regions, or if the deprojection subtracts modes that are correlated with the true density field, the galaxy clustering auto-spectra are biased. Because Section 6.1 uses these clustering spectra to self-calibrate Delta_z3, Delta_z4 and the galaxy biases, such a bias would propagate directly into S8, not merely into an uninteresting nuisance parameter. I recommend that the authors add a validation test in which mock density maps are populated with realistic observational-condition templates (depth, seeing, sky level, coverage) and the same area-cut and deprojection pipeline is applied, checking that the recovered S8 and Delta_z values remain unbiased. At minimum, the real-data analysis should report how the S8 result shifts when the Table 3 thresholds are varied within plausible ranges.
- [Section 6.4 and Figure 8] The headline comparison that the result is "~25% tighter than the HSC-Y3 cosmic shear studies" is not an apples-to-apples comparison, and the paper should either qualify it or provide a matched comparison. The HSC-Y3 analyses of Dalal et al. (2023) and Li et al. (2023) use different scale cuts (their cosmic shear extends to ell ~ 1800), different treatment of PSF systematics and shear calibration (marginalized over, as stated in Sections 5.3.2 of this paper), and different covariance choices. This paper's own "gamma-gamma-only" reference analysis uses the more conservative scale cut 317 <= ell <= 1000, so the relative tightening shown in Figure 8 conflates the effect of adding the new probes with the effect of changing scale cuts and systematics treatments. The paper does note some of these caveats, but the abstract and Section 6.4 nevertheless present the 25% figure as a headline. I suggest reporting the fractional width improvement from a matched analysis, e.g., the ratio of the S8 interval from the full photo-3x2-pt data vector to that from the same pipeline applied to the shear-shear spectra alone with identical scale cuts and systematics treatment.
- [Section 6.2 and footnote 5] The goodness-of-fit statistic chi2 = 70.5 for "effective" 85 degrees of freedom, with p = 0.87, is based on a post-hoc selection of the 11 parameters that the data happen to constrain more tightly than their priors. This procedure is not a standard chi2 test: the full model has 26 varied parameters, and selecting the effective number of degrees of freedom from the width of the posteriors makes the reported p-value optimistic. The unusually high p-value could also indicate that the covariance is somewhat overestimated. This does not directly invalidate the S8 constraint, but the paper should either report the chi2 and p-value for the full 96-26 = 70 degrees of freedom, or present the effective-dof calculation as an approximate diagnostic rather than a formal goodness-of-fit test.
minor comments (5)
- [Appendix 2, Table 3] The table reports a cut of "Seeing >= 0.5 and <= 0.75" removing 10.2% of the area, but the lower threshold motivation is only described qualitatively. Since this is one of the largest area cuts, a quantitative stability test (e.g., how the inferred clustering amplitudes change when the lower threshold is varied by +/- 0.05 arcsec) would be valuable.
- [Appendix 2, Table 2] In the third row of Table 2, the dumped-redshift list "0.449, 0.923, 0.538, ..." contains a value 0.923 that is not in monotonic order with the neighboring entries; this is presumably a typo for something like 0.492 and should be corrected.
- [Section 3.2.3] The text says "in summery we cut ~30 percent of the survey area"; "summery" should be "summary".
- [Section 6.2] The sentence "the constraints on alpha_mu for all the bins are very week" contains a typo: "week" should be "weak".
- [Section 6.4] The sentence "our credible intervals are ~30% tiger" contains a typo: "tiger" should be "tighter".
Circularity Check
No circularity: the photo-3x2-pt S8 constraint is an independent combination of measured spectra, and the mock-validation gap is a robustness limitation, not a circular step.
full rationale
The paper's central result (0.76 ≤ S8 ≤ 0.81) is obtained by a standard Bayesian likelihood analysis of 96 measured band powers (10 shear-shear, 10 galaxy-shear, and 4 galaxy clustering spectra, each with four band powers). The added spectra are independent data vectors: galaxy clustering and galaxy-shear depend on galaxy density fields, while cosmic shear depends on shear fields, and both enter the model through separate kernels (Eqs. 4–10). They are not constructed from the target S8. Nuisance parameters (A1, bg, Δz, αμ) are marginalized with priors given in Table 1; they are not fitted to S8 and then renamed as predictions. The 'self-calibration' of Δz3/Δz4 via galaxy clustering is an inference from new measurements, not an identity: clustering auto-spectra constrain p(z) with a free bias bg, and the galaxy-shear cross-spectra help break the degeneracy; no equation sets the clustering spectrum equal to a fitted S8 value. The mock validation in Appendix 1 is external: mock catalogs are built from N-body and ray-tracing simulations with known inputs (σ8 = 0.83, A1 = 0.5, αμ = (0.3, 0.3, 0.7, 1.2)) and the pipeline recovers them, providing independent support. The only notable gap is stated by the paper itself in Appendix A.1.3: 'No area cut by observational conditions was made for galaxy density map as any variations of observational conditions were not considered in creating mock data.' This means the 29.5% area cut and template deprojection are not end-to-end validated in mock, but that is a robustness or correctness concern, not circularity: the thresholds are chosen by inspecting systematics–density relations (Appendix 2), not by fitting the S8 that is later reported. Citations to prior HSC analyses and to Nicola et al. (2020) / Elsner et al. (2016) supply methods and benchmarks; none is used as a uniqueness theorem or as the sole justification for the S8 interval. No circular step can be exhibited from the paper's equations or quoted text.
Assumptions & free parameters
free parameters (11)
- Omega_c (CDM density parameter) =
Omega_m 68% CI 0.18-0.25
- A_s (or sigma8) =
sigma8 68% CI 0.83-1.01
- omega_b =
prior flat(0.02,0.025), weakly constrained
- h =
prior flat(0.62,0.80)
- n_s =
prior flat(0.87,1.07)
- Intrinsic alignment amplitudes A1^i (i=1-4) =
inferred in Figure 5; lower bins constrained, highest bin poorly constrained
- Intrinsic alignment tidal biases bT^i (i=1-4) =
posteriors broad, truncated at prior edges
- Galaxy clustering biases bg^i (i=1-4) =
posterior means in Figure 5; mock check in Figure 12
- Lensing magnification slopes alpha_mu^i (i=1-4) =
poorly constrained in real data; mock unbiased except alpha_mu^1
- Baryonic feedback amplitude Abary =
posterior truncated at lower bound
- Redshift distribution shifts Delta_z_i (i=1-4) =
Delta_z1,z2 prior dominated; Delta_z3,z4 about 30 percent tighter than HSC-Y3
assumptions (9)
- domain assumption Flat LambdaCDM with fixed neutrino mass sum 0.06 eV
- standard math Limber approximation for all angular power spectra
- domain assumption Scale-independent linear galaxy bias per tomographic bin
- domain assumption Nonlinear alignment (NLA) intrinsic alignment model extended to 1-loop from Blazek et al. 2015
- domain assumption HMcode nonlinear matter power spectrum and Mead et al. 2015 baryonic feedback model
- domain assumption Template deprojection assumes contaminants add linearly to the galaxy overdensity
- domain assumption Source redshift distributions from Rau et al. 2023 with uncertainties modeled only as overall shifts
- domain assumption Covariance is Gaussian from NaMaster plus connected non-Gaussian and super-sample terms scaled by fsky
- ad hoc to paper The 11 constrained parameters are the effective degrees of freedom for the chi-square test
Cite this review
Pith. "Pith review of photo-3x2-pt: Cosmology from cosmic shear and galaxy clustering with a single photometric galaxy catalog." pith.science (2026). https://pith.science/paper/DAJRUXP5
@misc{pith2026260805530,
  author       = {Pith},
  title        = {Pith review of: photo-3x2-pt: Cosmology from cosmic shear and galaxy clustering with a single photometric galaxy catalog},
  year         = {2026},
  howpublished = {\url{https://pith.science/paper/DAJRUXP5}},
  note         = {Machine review of arXiv:2608.05530}
}
abstract
We perform a joint cosmological analysis using angular power spectra of galaxy clustering, galaxy-shear cross correlation, and cosmic shear (hereafter referred to as photo-3x2-pt) measured from the Hyper Suprime-Cam year-3 (HSC-Y3) weak lensing shape catalog. We employ the pseudo-$C_\ell$ method to measure these power spectra and use the template deprojection method to mitigate systematics in the galaxy density maps. We perform a standard Bayesian likelihood analysis for cosmological inference based on the measured photo-3x2-pt, including contributions from intrinsic alignments of galaxies, galaxy clustering bias, lensing magnification effect, baryonic feedback effect, and source redshift distribution errors. For a flat cold dark matter model, we find a 68% credible interval of $0.76 \le S_8 \le 0.81$. This result is consistent with those of the HSC-Y3 cosmic shear analyses (Dalal et al. 2023, Li et al. 2023), but is $\sim 25$% tighter than theirs. We also perform a performance test using mock catalogs that mimic the HSC-Y3 data to validate our photo-3x2-pt analysis. Through Bayesian parameter inference of mock data, we verify that unbiased estimates can be obtained for the key cosmological and nuisance parameters, including $S_8$, model parameters of intrinsic alignment, galaxy clustering bias, and shift parameters of the source redshift distributions.
Figures


Figures from the paper (14 more)




Reference graph
Works this paper leans on
-
[1]
Alonso, D., Sanchez, J., & Slosar, A. a. 2019, MNRAS, 484, 412 7
work page 2019
-
[2]
Ba, S., Myers, W. R., & Brenneman, W. A. 2015, Technometrics, 57, 479
work page 2015
-
[3]
M., d’Assignies, W., Troxel, M
Bernstein, G. M., d’Assignies, W., Troxel, M. A., et al. 2026 , ApJ, 1002, 95
work page 2026
-
[4]
2015, Journal of Cosmology and Astroparticle Physics, 2015, 015
Blazek, J., Vlah, Z., & Seljak, U. 2015, Journal of Cosmology and Astroparticle Physics, 2015, 015
work page 2015
-
[5]
A., MacCrann, N., Troxel, M., & Fang, X
Blazek, J. A., MacCrann, N., Troxel, M., & Fang, X. 2019, Phys ical Review D, 100, 103506
work page 2019
-
[6]
2007, New Journal of Physics, 9, 444
Bridle, S., & King, L. 2007, New Journal of Physics, 9, 444
2007
-
[7]
Chisari, N. E. 2025, A&AR, 33, 1
work page 2025
-
[8]
2023, Physical Review D, 108, 123519 Dark Energy Survey Collaboration, Abbott, T., Abdalla, F
Dalal, R., Li, X., Nicola, A., et al. 2023, Physical Review D, 108, 123519 Dark Energy Survey Collaboration, Abbott, T., Abdalla, F. B ., et al. 2016, MNRAS, 460, 1270 de Jong, J. T. A., V erdoes Kleijn, G. A., Kuijken, K. H., & V ale ntijn, E. A. 2013, Experimental Astronomy, 35, 25 de Souza, D. H. F., Yin, B., Eifler, T., et al. 2026, Journal of C osmolo...
arXiv 2023
Show all 46 references
-
[9]
Elsner, F., Leistedt, B., & Peiris, H. V . 2016, MNRAS, 465, 1847
2016
-
[10]
T., Springel, V ., et al
Ferlito, F., Davies, C. T., Springel, V ., et al. 2024, MNRAS, 533, 3209
2024
-
[11]
Feroz, F., & Hobson, M. P . 2008, MNRAS, 384, 449
2008
-
[12]
P ., & Bridges, M
Feroz, F., Hobson, M. P ., & Bridges, M. 2009, MNRAS, 398, 1601
2009
-
[13]
P ., Cameron, E., & Pettitt, A
Feroz, F., Hobson, M. P ., Cameron, E., & Pettitt, A. N. 2019, T he Open Journal of Astrophysics, 2, 10 García-García, C., Alonso, D., & Bellini, E. 2019, Journal o f Cosmology and Astroparticle Physics, 2019, 043
2019
-
[14]
M., Hivon, E., Banday, A
Gorski, K. M., Hivon, E., Banday, A. J., et al. 2005, ApJ, 622, 759
2005
-
[15]
M., & Seljak, U
Hirata, C. M., & Seljak, U. 2004, Physical Review D, 70, 06352 6
2004
-
[16]
2000, Physical Review D, 62, 043007
Hu, W. 2000, Physical Review D, 62, 043007
2000
-
[17]
2019 , MNRAS, 488, 1652
Huang, H.-J., Eifler, T., Mandelbaum, R., & Dodelson, S. 2019 , MNRAS, 488, 1652
2019
-
[18]
2016, PASJ, 68, 54
Iwasawa, M., Tanikawa, A., Hosono, N., et al. 2016, PASJ, 68, 54
2016
-
[19]
D., et al
Joachimi, B., Cacciato, M., Kitching, T. D., et al. 2015, Spa ce Sci. Rev., 193, 1
2015
-
[20]
A., Asgari, M., et al
Joachimi, B., Lin, C. A., Asgari, M., et al. 2021, A&A, 646, A1 29
2021
-
[21]
2025, A& A, 699, A127
Johnston, H., Elisa Chisari, N., Joudaki, S., et al. 2025, A& A, 699, A127
2025
-
[22]
2017, MNRAS, 4 72, 2126
Kilbinger, M., Heymans, C., Asgari, M., et al. 2017, MNRAS, 4 72, 2126
2017
-
[23]
2011, ArXiv e-p rints, arXiv:1110.3193
Laureijs, R., Amiaux, J., Arduini, S., et al. 2011, ArXiv e-p rints, arXiv:1110.3193
2011 arXiv
-
[24]
D., Ferreira, T., Fang, X., et al
Leonard, C. D., Ferreira, T., Fang, X., et al. 2023, The Open J ournal of Astrophysics, 6, 8
2023
-
[25]
2013, N eutrino Cosmology (Cambridge, UK: Cambridge University Press)
Lesgourgues, J., Mangano, G., Miele, G., & Pastor, S. 2013, N eutrino Cosmology (Cambridge, UK: Cambridge University Press)
2013
-
[26]
2000, ApJ, 538, 473
Lewis, A., Challinor, A., & Lasenby, A. 2000, ApJ, 538, 473
2000
-
[27]
2022, PASJ, 74, 421
Li, X., Miyatake, H., Luo, W., et al. 2022, PASJ, 74, 421
2022
-
[28]
2023, Physical Review D, 108, 123518 LSST Science Collaboration, Abell, P
Li, X., Zhang, T., Sugiyama, S., et al. 2023, Physical Review D, 108, 123518 LSST Science Collaboration, Abell, P . A., Allison, J., et al . 2009, ArXiv e-prints, arXiv:0912.0201
2023 arXiv
-
[29]
J., Heymans, C., Lombriser, L., et al
Mead, A. J., Heymans, C., Lombriser, L., et al. 2016, MNRAS, 4 59, 1468
2016
-
[30]
J., Peacock, J
Mead, A. J., Peacock, J. A., Heymans, C., Joudaki, S., & Heave ns, A. F. 2015, MNRAS, 454, 1958
2015
-
[31]
2023, Physica l Review D, 108, 123517
Miyatake, H., Sugiyama, S., Takada, M., et al. 2023, Physica l Review D, 108, 123517
2023
-
[32]
2018, PASJ, 7 0, 70
Namekata, D., Iwasawa, M., Nitadori, K., et al. 2018, PASJ, 7 0, 70
2018
-
[33]
2021, Jour nal of Cosmology and Astroparticle Physics, 2021, 067
Nicola, A., García-García, C., Alonso, D., et al. 2021, Jour nal of Cosmology and Astroparticle Physics, 2021, 067
2021
-
[34]
2020, Journal of C osmology and Astroparticle Physics, 2020, 044
Nicola, A., Alonso, D., Sánchez, J., et al. 2020, Journal of C osmology and Astroparticle Physics, 2020, 044
2020
-
[35]
2026, ArXiv e-pr int, arXiv:2605.28581
Nishimichi, T., Tanaka, S., & Y oshikawa, K. 2026, ArXiv e-pr int, arXiv:2605.28581
2026 arXiv
-
[36]
2014, MNRAS, 444, 147
Oguri, M. 2014, MNRAS, 444, 147
2014
-
[37]
2017, PASJ, 70, S20 Planck Collaboration, Ade, P
Oguri, M., Lin, Y .-T., Lin, S.-C., et al. 2017, PASJ, 70, S20 Planck Collaboration, Ade, P . A. R., Aghanim, N., et al. 2016 , A&A, 594, A13 Planck Collaboration, Aghanim, N., Akrami, Y ., et al. 2020, A&A, 641, A6
2017
-
[38]
M., Dalal, R., Zhang, T., et al
Rau, M. M., Dalal, R., Zhang, T., et al. 2023, MNRAS, 524, 5109
2023
-
[39]
2025, A&A, 699, A1 24
Reischke, R., Unruh, S., Asgari, M., et al. 2025, A&A, 699, A1 24
2025
-
[40]
J., Finkbeiner, D
Schlegel, D. J., Finkbeiner, D. P ., & Davis, M. 1998, ApJ, 500 , 525
1998
-
[41]
2015, MNRAS, 453, 30 44
Shirasaki, M., Hamana, T., & Y oshida, N. 2015, MNRAS, 453, 30 44
2015
-
[42]
2023, Physical R eview D, 108, 123521
Sugiyama, S., Miyatake, H., More, S., et al. 2023, Physical R eview D, 108, 123521
2023
-
[43]
2017, ApJ, 8 50, 24
Takahashi, R., Hamana, T., Shirasaki, M., et al. 2017, ApJ, 8 50, 24
2017
-
[44]
2018, PASJ, 70, S 9
Tanaka, M., Coupon, J., Hsieh, B.-C., et al. 2018, PASJ, 70, S 9
2018
-
[45]
A., & Ishak, M
Troxel, M. A., & Ishak, M. 2015, Phys. Rep., 558, 1
2015
-
[46]
H., Stölzner, B., Asgari, M., et al
Wright, A. H., Stölzner, B., Asgari, M., et al. 2025, A&A, 703 , A158
2025
Reviewed August 8, 2026 · model on record in the stance chip above.
Discussion (0). Continue with ORCID to comment.