REVIEW 7 minor 14 references
Searching for Time-Dependent Neutrino Emission from Blazars with IceCube
T0 review · 0 major / 7 minor · reviewed 2026-08-14 · deepseek-v4-flash
Pith's one-line read The paper finds no statistically significant population of blazar neutrino flares in five years of IceCube muon-neutrino data, with final p=0.244 excluding TXS 0506+056 and p=0.114 including it.
desk verdict A careful, calibrated null result from the first systematic time-dependent neutrino flare search over the northern 3LAC catalog; method is borrowed but the survey and its ensemble calibration are new. read the letter →
The pith
A machine-rendered reading of the paper's core claim, the machinery that carries it, and where it could break.
The reading
What carries the argument
The engine of the search is the unbinned maximum-likelihood flare fit of equations (2.1)-(2.4): a likelihood in which a signal component with spatial, energy, and Gaussian time terms (equation 2.2) is mixed with an atmospheric-background term (equation 2.3), and the test statistic $D$ penalizes short time windows through the livetime-to-window ratio $\mathrm{TL}/\hat{T}_\sigma$ to account for the increased trial factor. Its output is a best-fit number of signal events, spectral index, flare time, and flare width, which is converted to a local p-value against scrambled data. The second piece of machinery is the binomial test of equation (2.5), which scans the 100 smallest ordered p-values and asks whether $k$ or more blazars have p-values at or below $p_k$. The third piece is a correlation-removal prescription: neutrino events are ranked by signal-to-background ratio $S_i/B_i$, two search directions are called correlated if they share any of the top $3\hat{n}_s$ neutrinos, and $k$ is reduced by the number of redundant directions before the p-value is recomputed. Finally, the entire decorrelated-binomial procedure is run on scrambled data to produce the null distribution against which the data's decorrelated p-value is judged.
What would settle it
Run the identical pipeline on simulated data in which ten of the 1023 blazar directions each inject a five-event Gaussian neutrino flare: if the decorrelated binomial p-value is not systematically smaller than the scrambled-background distribution, then the analysis cannot detect the population it appears to exclude, and the reported null result would not constrain small populations.
Extended reading notes
Core claim
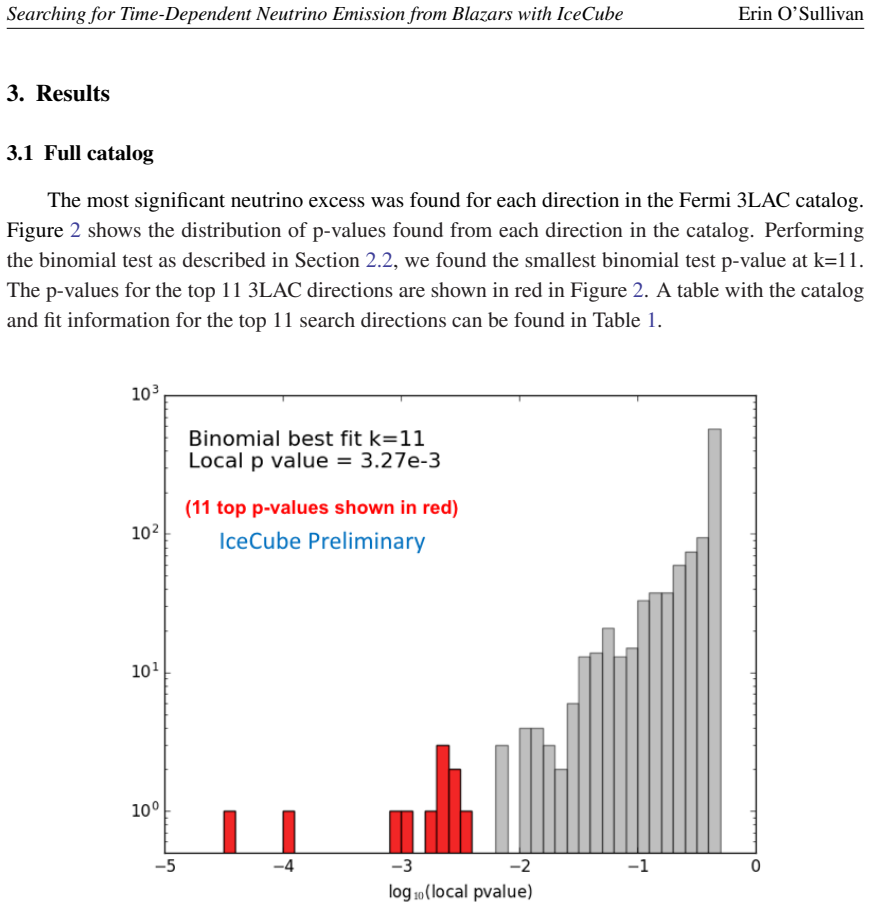
On the paper's own terms: for each of the 1023 search directions, the best-fit neutrino flare is found by maximizing an unbinned likelihood in which the signal is a spatially Gaussian, energy-power-law, time-Gaussian burst and the background is atmospheric muon neutrinos; the test statistic penalizes short time windows for their larger trial factor. The p-value of each direction's best fit is calibrated against scrambled-data ensembles. The smallest binomial p-value over the 100 lowest p-values occurs at $k=11$, with local p-value $3.27\times10^{-3}$. Two correlation clusters are identified in those 11 directions (three directions around B2 1126+37 and two around GB6 J0929+5013) and removed by lowering $k$ to 8, giving a decorrelated binomial p-value of $2.09\times10^{-2}$ including TXS 0506+056 and $5.33\times10^{-2}$ without it. When these decorrelated values are compared with the same quantity from scrambled data, the final p-values are $0.114$ and $0.244$, respectively, so the data are consistent with background. The same test applied separately to FSRQ and BLLac sub-catalogs gives final p-values of $0.50$ and $0.60$.
Load-bearing premise
Everything rests on scrambled events faithfully reproducing the atmospheric-neutrino background: if scrambling distorts detector acceptance, energy response, or the spatial-time correlation structure, every reported p-value is biased.
Editorial extensions
If this is right
- At p=0.244 excluding TXS 0506+056, the observed set of per-direction flare p-values is consistent with atmospheric-neutrino background alone.
- The eight uncorrelated directions that survive decorrelation in the top 11 do not constitute a significant population; the analysis places no limit on individual sources but bounds the collective excess.
- FSRQ-only and BLLac-only sub-catalogs each return final p-values consistent with background (0.50 and 0.60).
- The three non-blazar objects among the top 11 are a small a posteriori fraction, and the paper treats them as motivation for follow-up rather than evidence.
Reading between the lines
- A natural extension the paper leaves implicit: the same catalog scan with time windows fixed by gamma-ray flares could be more sensitive to blazars that emit neutrinos only while gamma-bright, since the present search deliberately fits time without any electromagnetic trigger.
- Because the final p-value comes from comparing the data's decorrelated binomial p-value with scrambled skies, the claim is about the population of detectable flares: a population whose flares are too weak to enter the top 100 p-value list would be invisible to this test.
- One testable improvement would be to run the same binomial test on an independent half of the data to check that the reported p=0.244 reproduces.
Signed reviews
Editorial analysis
A structured set of objections, weighed in public.
Referee Report
Summary. This paper presents a search for time-dependent neutrino emission from blazars in the Fermi 3LAC catalog, using 5 years of IceCube muon-neutrino data. For each of 1023 catalog directions, the best-fit neutrino flare is found with an unbinned maximum-likelihood method, and a p-value is assigned by comparing the test statistic to scrambled data. A binomial test is then applied to the set of p-values to look for an excess of low p-values beyond the background expectation. Correlated search directions are removed with a heuristic prescription, and the final binomial p-value is calibrated by repeating the entire procedure on scrambled data. The resulting final p-values are 0.114 with TXS 0506+056 included and 0.244 with it excluded, consistent with the background-only hypothesis. Sub-catalog tests for FSRQ and BL Lac objects also show no significant excess. The most significant fitted flare is TXS 0506+056, with a local p-value of 3.47e-5.
Significance. If the result is correct, it places a meaningful constraint on the fraction of 3LAC blazars with flaring neutrino emission: the data show no evidence for a population of neutrino-bright blazars beyond the known TXS 0506+056. The analysis is a clear, well-calibrated null result. Its main strength is the use of scrambled data not only to assign individual p-values but also to calibrate the final binomial p-value, which absorbs the trial factor from scanning over k and the effects of correlations. The paper is transparent in reporting results with and without TXS 0506+056 and for the two optical sub-classes. The individual fit parameters in Table 1 are useful for follow-up. The central claim is defensible and appropriately limited.
minor comments (7)
- [2.3] The algorithm for determining how many AGNs in the top k need to be removed is not fully specified; please describe the exact removal procedure (for example, greedy removal or maximum independent set) so that the analysis is reproducible.
- [2.3] The threshold for a 'significant neutrino contributor' is defined as the top ns×3 neutrinos by Si/Bi; the factor of 3 appears arbitrary. Please provide a justification or demonstrate that the final p-value is insensitive to this choice.
- [2.2] The scan over the 100 lowest p-values is an arbitrary upper bound; please state whether the final result changes if the scan is restricted to, for example, k=1..50 or extended to k=1..200, since the calibration only absorbs the scan range actually used.
- [2.1] The scrambling procedure is described only as 'randomized positions and times'; please specify which components of the data are preserved (for example, declination, energy, livetime) or cite a reference that does so, because the null distribution depends on this.
- [3.1] The raw binomial p-value for k=11 before decorrelation is not stated; reporting it would make the effect of the correlation-removal step explicit and would help the reader interpret the size of the correction.
- [2.1] In the sentence describing the signal PDF, 'spacial' should be 'spatial'.
- [Figure 3] The axes in Figure 3 are not labeled in the manuscript; adding x- and y-axis labels would aid interpretation.
Circularity Check
No circularity: the final p-value is produced by Monte Carlo calibration against scrambled data and is not forced by construction.
full rationale
The derivation chain is self-contained against an internal scrambled-data benchmark. The per-direction p-values (Sec. 2.1) are outputs of an unbinned likelihood maximization, converted to p-values by comparing the test statistic D with the distribution from scrambled data; they are not fitted parameters that are subsequently renamed as predictions. The binomial test (Sec. 2.2) is a standard combinatorial calculation on those p-values, and the correlation-removal prescription (Sec. 2.3) is applied identically to data and scrambles before the final comparison. The final p = 0.244 (0.114 with TXS) is therefore a calibration of the observed binomial statistic against its null distribution, not a quantity forced by construction. The only load-bearing assumption is that scrambling represents the background null, but that is a statistical assumption, not circularity: no claim in the paper defines a quantity in terms of the result it is supposed to test, and no fitted input is called a prediction. Self-citations to the time-dependent likelihood formalism ([7],[8]) and previous TXS analysis ([1],[2]) supply the method and motivation, but the present ensemble test does not reduce to those citations; it evaluates an independent question.
Assumptions & free parameters
free parameters (2)
- Correlation threshold factor (ns*3) =
3
- Binomial scan range k = 1 to 100 =
100
assumptions (4)
- domain assumption Neutrino flares have a Gaussian time profile with unknown centre and width (Eq. 2.2).
- domain assumption Scrambled event sets (randomized positions and times) faithfully reproduce the null distribution of the test statistic (Sections 2.1 and 2.3).
- domain assumption Atmospheric neutrino energy spectrum P_atm(E) accurately describes the background (Eq. 2.3).
- domain assumption The test statistic D in Eq. 2.4, with the T_L / T_sigma penalty, is a valid trials-corrected statistic for scanning flare durations.
Cite this review
Pith. "Pith review of Searching for Time-Dependent Neutrino Emission from Blazars with IceCube." pith.science (2026). https://pith.science/paper/DEA67KZ3
@misc{pith2026190805526,
  author       = {Pith},
  title        = {Pith review of: Searching for Time-Dependent Neutrino Emission from Blazars with IceCube},
  year         = {2026},
  howpublished = {\url{https://pith.science/paper/DEA67KZ3}},
  note         = {Machine review of arXiv:1908.05526}
}
read the original abstract
In 2017, IceCube detected a high energy neutrino in coincidence with the blazar TXS 0506+056. In a follow up analysis of archival data, evidence for previous neutrino emission from the blazar during 2014-15 was found. In this analysis, we investigate whether other blazars might have had episodes of neutrino emission. We use a 5-year sample of muon-neutrino data and the same timedependent algorithm that was used for the archival analysis of TXS 0506+056, applying it to all of the objects in the northern sky listed in the Fermi 3LAC catalog. We fit for the most significant neutrino flare from each direction, without assuming any correlation with electromagnetic light curves. To search for an excess of significant flares which could indicate a small population of neutrino emitters, we apply a binomial test. This binomial test does not find a significant excess of flares relative to the results expected for background coincidences from atmospheric neutrinos. The final significance of the analysis is p=0.244 when TXS 0506+056 is excluded, consistent with the background-only hypothesis. We report the parameters of the individual fits for the most significant objects which contributed to the final result.
Figures


Figures from the paper (1 more)

Reference graph
Works this paper leans on
-
[1]
write newline
" write newline "" before.all 'output.state := FUNCTION blank.sep after.quote 'output.state := FUNCTION fin.entry output.state after.quoted.block = 'skip 'add.period if write newline FUNCTION new.block output.state before.all = 'skip output.state after.quote = after.quoted.block 'output.state := after.block 'output.state := if if FUNCTION new.sentence out...
-
[2]
IceCube, and others Collaboration, M. G. Aartsen et al., Science 361 (2018) eaat1378
work page 2018
-
[3]
IceCube Collaboration, M. G. Aartsen et al., Science 361 (2018) 147--151
2018
-
[4]
IceCube Collaboration, M. G. Aartsen et al., JINST 12 (2017) P03012
2017
-
[5]
Williams, PoS(ICRC2019)16 (these proceedings)
IceCube Collaboration, D. Williams, PoS(ICRC2019)16 (these proceedings)
-
[6]
Fermi-LAT Collaboration, M. Ackermann et al., Astrophys. J. 810 (2015) 14
work page 2015
-
[7]
IceCube Collaboration, M. G. Aartsen et al., Eur. Phys. J. C79 (2019) 234
work page 2019
- [8]
Show all 14 references
-
[9]
Braun, M
J. Braun, M. Baker, J. Dumm, C. Finley, A. Karle, and T. Montaruli, Astropart. Phys. 33 (2010) 175--181
2010
-
[10]
IceCube Collaboration, PoS(ICRC2015)1099 (2016)
2016
-
[11]
IceCube-Gen2 Collaboration, PoS(ICRC2017)1052 (2018)
2018
-
[12]
IceCube Collaboration, PoS(ICRC2019)xyz (these proceedings)
-
[13]
IceCube Collaboration, M. G. Aartsen et al. , JINST 12 (2017) P03012
2017
-
[14]
Waxman and J
E. Waxman and J. N. Bahcall, Phys. Rev. D59 (1999) 023002
1999
Reviewed August 14, 2026 · model on record in the stance chip above.
Discussion (0). Continue with ORCID to comment.