REVIEW 3 major objections 6 minor 36 references
Evaluation of extremal properties of GARCH(p,q) processes
T0 review · 3 major / 6 minor · reviewed 2026-08-14 · deepseek-v4-flash
Pith's one-line read This paper claims that a particle-filter algorithm can generate the tail chain of any GARCH(p,q) process, making the extremal index, extremogram, and cluster-size distribution numerically available for all such models.
desk verdict A genuinely useful particle-filter method for the squared GARCH tail chain, but the asymmetric-innovation extension rests on an invalid independence assumption and the IGARCH proof has a gap. read the letter →
The pith
A machine-rendered reading of the paper's core claim, the machinery that carries it, and where it could break.
The reading
What carries the argument
The load-bearing device is a sequential importance-sampling particle filter for the spectral measure $H_{\hat\Theta_0}$ of the squared GARCH process, defined on the $(p+q)$-dimensional unit simplex. The Markov chain $\tilde\Theta_s = A_s\tilde\Theta_{s-1}/\|A_s\tilde\Theta_{s-1}\|$, weighted by $\|A_s\tilde\Theta_{s-1}\|^\kappa$, has $H_{\hat\Theta_0}$ as its invariant distribution because the spectral measure satisfies the fixed-point equation (2.14) of the paper. Once $\hat\Theta_0$ is sampled, the tail chain follows by matrix multiplication $\hat\Theta_t = A_t\cdots A_1\hat\Theta_0$, with $\hat X_t^2 = \hat R_0 \hat\vartheta_t^{(1)}$ and $\hat R_0$ an independent Pareto variable with tail index $\kappa$. The supporting identities are Theorem 3.2, $\kappa$ solves $E[(\lambda e^\eta)^\kappa] = 1$ with $\lambda$ the largest eigenvalue of $A_t$ and $\eta = -(1/\kappa)\ln E(\lambda^\kappa)$, and Theorem 3.4, $\kappa = 1$ for IGARCH(p,q).
What would settle it
For a GARCH(2,2) with skew-$t$ innovations, simulate a long stationary series, estimate at a high threshold (e.g., the 0.9999 quantile) the lag-one upper-tail extremogram $\chi_{X^U}(1)$ by the threshold method, and compare it with the paper's value $\delta \chi_{X^2}(1)$; a systematic gap beyond Monte Carlo error would show the Bernoulli-thinning representation of Section 4 does not hold for asymmetric innovations.
Extended reading notes
Core claim
The central claim is that one object controls the extremal behaviour of a GARCH(p,q) process — the spectral measure $H_{\hat\Theta_0}$ of the squared process in its stochastic recurrence equation representation — and that this object can be sampled. Algorithm 1 runs a Markov chain $\tilde\Theta_s = A_s\tilde\Theta_{s-1} / \|A_s\tilde\Theta_{s-1}\|$ with weights $\|A_s\tilde\Theta_{s-1}\|^\kappa$; its invariant distribution is $H_{\hat\Theta_0}$, and $\kappa$ is found by solving $E\|A\hat\Theta_0\|^\kappa = 1$. Algorithm 2 then propagates $\hat\Theta_t = A_t\cdots A_1\hat\Theta_0$ and forms the squared tail chain with $\hat X_t^2 = \hat R_0 \hat\vartheta_t^{(1)}$. The paper proves the numerically stable identities $\gamma = E(\ln \lambda) + \eta$ and $E[(\lambda e^\eta)^\kappa] = 1$, with $\eta = -(1/\kappa)\ln E(\lambda^\kappa)$, and proves $\kappa = 1$ for every IGARCH(p,q) process. From the squared tail chain, upper and lower tail chains of the original process are obtained by Bernoulli($\delta$) sign thinning, yielding extremograms and extremal indices for symmetric and asymmetric innovations.
Load-bearing premise
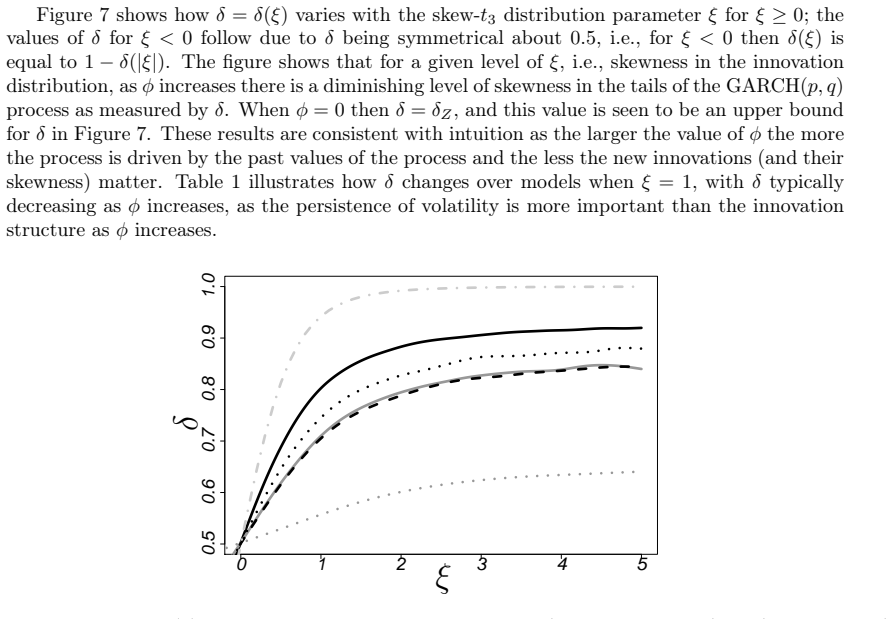
The load-bearing assumption is the Section 4 representation that the sign of each extreme observation is an independent Bernoulli($\delta$) variable independent of the squared tail chain; for asymmetric innovations this independence fails because the sign of $Z_t$ and $Z_t^2$ are correlated, so the computed extremal index and extremogram for asymmetric cases stand or fall with this thinning.
Editorial extensions
If this is right
- For any GARCH(p,q) with Gaussian, Student-$t$, or skew-$t$ innovations, the extremal index, extremogram, and cluster-size distribution can be computed numerically, including for IGARCH models.
- The tail index $\kappa$ can be evaluated without bounded-support assumptions and without the cubic slowdown of the previous rejection-based method, so high-order GARCH models become feasible.
- Because every cluster functional is a functional of the forward tail chain, quantities such as mean cluster length, lag-$\tau$ exceedance probabilities, and total cluster excess are obtained from the same simulated chains.
- The same algorithms apply to the wider class of stochastic recurrence equations $Y_t = A_tY_{t-1} + B_t$ satisfying Kesten's conditions, giving strict-stationarity checks and extremal analysis for those processes as well.
- The proof that $\kappa = 1$ for all IGARCH(p,q) sharpens the moment boundary: $E|X_t|^{2-\epsilon} < \infty$ for every $\epsilon > 0$ while the variance is infinite.
Reading between the lines
- Inference: the Bernoulli-thinning step in Section 4 is asserted for asymmetric innovations; a direct simulation check of whether the sign of an extreme at lag $t$ is independent of the squared tail chain would either confirm or refute the computed extremal indices for skew-$t$ cases.
- Inference: the paper's own observation that the $\eta$-based route to $\kappa$ is reliable only when $|\phi - 1| > 0.05$, where $\phi = \sum\alpha_i + \sum\beta_j$, means the particle filter, not the eigenvalue identity, is the load-bearing numerical component for near-integrated GARCH.
- Inference: the Table 1 pattern — $\kappa < 1$ for $\phi > 1$ and $\kappa > 1$ for $\phi < 1$ — is illustrated for five models; proving monotonicity of $\kappa$ in $\phi$ for $\max(p,q) \ge 2$ would be a natural companion theorem.
- Inference: the same spectral-measure sampler should transfer to other heavy-tailed stochastic recurrence equations that lack an eigenvalue shortcut, replacing MCMC schemes restricted to bounded innovations.
Editorial analysis
A structured set of objections, weighed in public.
Referee Report
Summary. The paper develops numerical algorithms for extremal properties of GARCH(p,q) processes. It rewrites the squared GARCH process as a stochastic recurrence equation, introduces a sequential importance sampling algorithm (Algorithm 1) to sample the spectral measure of the state vector, uses this to evaluate the tail index κ through a self-consistency equation, and constructs the forward tail chain of the squared process (Algorithm 2). From the squared tail chain, Section 4 proposes to obtain the upper and lower tail chains of the original GARCH process by multiplying by independent Bernoulli(δ) sign variables, leading to formulas for the extremogram, extremal index, and cluster size distribution. The paper also states new Lyapunov-exponent representations (Theorems 3.1–3.3), claims that all IGARCH processes have κ = 1 (Theorem 3.4), and reports numerical results for several GARCH models with Gaussian, symmetric t, and skew-t innovations.
Significance. The particle-filter machinery for the squared GARCH process is a genuine methodological contribution: it applies to unbounded innovations, appears to converge quickly in the examples, and the squared-process extremal index is checked against runs estimates from long simulations (Section 5.5). The κ evaluation via the fixed point ρ_k = 1 is also a practical new route to the tail index. However, the bridge from the squared tail chain to the original GARCH process in Section 4 contains load-bearing flaws: the sign variables are not independent of the squared tail chain when innovations are asymmetric, and the initial exceedance is mishandled in the cluster-size formulas even in the symmetric case. The proof of Theorem 3.4 is also not justified as written. These problems affect the headline claims about extremal indices and cluster functionals for GARCH processes, especially for asymmetric innovations, and the numerical entries for skew-t models in Table 1 are therefore not established.
major comments (3)
- [Section 4, Eq. (4.2)] The representation \hat X_t^U = I_t (\hat X_t^2)^{1/2} with I_t an iid Bernoulli(δ) sequence independent of the squared tail chain is not valid for asymmetric innovations. For t ≥ 1 the squared tail chain value \hat X_t^2 is a function of Z_t^2 through the matrix A_t in the recursion (3.10), whereas the sign of \hat X_t is sign(Z_t); when Z_t is skewed, sign(Z_t) and Z_t^2 are dependent, so the conditional probability of a positive sign given the squared tail chain is not the constant δ. Moreover, δ in (4.1) is the limiting probability that a contemporaneous large |X_t| is positive, which is not the conditioning that applies to the tail chain at positive lags. Consequently the identities χ_{X^U}(τ)=δ χ_{X^2}(τ), the binomial cluster-size formulas, and θ_{X^U}=θ_{X^2}(1-Π_U)/δ are unsupported for skew-t innovations, and the skew-t entries in Table 1 and the corresponding Section 6 conclusions are not established.
- [Section 4, cluster-size formulas] Even under the Bernoulli-thinning assumption, the cluster-size derivation mishandles the initial time. The upper tail chain is conditioned on \hat X_0^U > 1, which forces I_0 = 1, but the formulas for Π_U, π_{X^U}(j), and θ_{X^U} treat I_0 as an ordinary Bernoulli(δ) variable and allow the whole cluster to vanish. For a squared-process cluster of length k, the upper-chain cluster length is 1 + Binomial(k-1, δ), not a binomially thinned count that can be zero. The correct extremal-index relation under the thinning model is θ_{X^U} = θ_{X^2}/[δ + (1-δ)θ_{X^2}]; for example, Model B-1 in Table 1 gives 0.55 rather than the reported 0.49. Thus the cluster-size and extremal-index formulas of Section 4 are wrong even for symmetric innovations.
- [Appendix A, proof of Theorem 3.4] The proof of Theorem 3.4 asserts that 'as E(Z_t^2)=1, it follows that all E(\hat ϑ_t^{(i)}) = 1/(p+q)'. This step is not justified: the preceding sentence only establishes identical marginal distributions within the first q block and within the last p block, and the argument that the two blocks have equal means because E(Z_t^2)=1 is not supplied. Since the theorem is used to assert κ = 1 for IGARCH models C and D and to compute η and γ for those models in Table 1, the proof needs to be completed (or the result cited) before the IGARCH claims can be accepted.
minor comments (6)
- [Section 5.5, runs estimator] The displayed definition of the runs estimator contains 'Pr(X^2_t < 0 | X^2_0 > 1)', which should read 'Pr(X^2_t < u | X^2_0 > u)' or similar, since the empirical formula that follows uses the threshold u.
- [Section 6.2] The sentence 'min(θ_{X^U},θ_{X^U}) ≥ θ_{X^2}' should read 'min(θ_{X^U},θ_{X^L}) ≥ θ_{X^2}'.
- [Section 4, Eq. (4.2)] Immediately after (4.2), the extremogram display writes 'Pr(I_t \hat X^2_τ > 1)'; the index should be I_τ for consistency with the lag τ being considered.
- [Section 3.2, Eq. (3.7)] The expression for \tilde ρ_k mixes a Monte Carlo average over particles with an integral with respect to F_Z; please clarify the exact estimator, for instance by stating that it averages over independent draws of A and Z.
- [References] The reference 'Kallemberg (1983)' should be 'Kallenberg (1983)'.
- [Section 5.1] Model E is described as p = 2, q = 0, but the model definition requires q ∈ N+ and the parameter list includes α1 and α2; please clarify the parametrization.
Circularity Check
No significant circularity: kappa is obtained as a fixed point of a theoretical equation, self-citations are only special-case benchmarks, and the one explicitly circular route is avoided in the paper.
full rationale
The central derivation is self-contained. The tail index kappa is not fitted to data and then renamed as a prediction; it is obtained by solving the theoretical fixed-point equation (2.19), rho_k = 1, using repeated runs of the sequential importance sampler in Algorithm 1. Section 3.2 says for a trial k one approximates E(||A Theta_0||^k) and then "repeat this evaluation over k > 0 until we find the unique value of k which gives this weighted mean to be equal to 1. This value is k = kappa." This is a numerical root-finding problem, not a circular derivation, because the Markov transition (3.6) has invariant distribution H_Theta by construction, matching definition (2.14), and the equation being solved is the independently established moment condition (2.13). The paper explicitly avoids the genuinely circular route in Section 5.6: after noting that "we can actually evaluate eta much more accurately, but that needs kappa to be found, so that would lead to a circular argument," it does not use that route to obtain kappa. The self-citation to Laurini and Tawn (2012) is used only as a special-case benchmark for GARCH(1,1), where the spectral measure has an analytic expression (2.12), and is not load-bearing for the general GARCH(p,q) claims. External checks against long-run simulations, runs estimators, empirical extremograms, and QQ tail diagnostics provide independent support. The weakest assumption in the paper, the independence of the Bernoulli sign variables from the squared tail chain in representation (4.2), is a possible correctness issue for asymmetric innovations, especially since sign(Z_t) and Z_t^2 are dependent, but it is an assumption about the process limit rather than a circularity: the paper does not define X_t in terms of the quantities it then predicts, nor does it fit parameters to the cluster functionals it reports. Hence no circular step can be exhibited, and the honest finding is a score of zero.
Assumptions & free parameters
free parameters (4)
- Particle count J =
10^3 to 10^6
- Initial threshold u =
99.99% quantile of R_t
- Tail chain length T =
1000 (or 50)
- Simulation length n =
10^7 to 5 x 10^7
assumptions (5)
- domain assumption Kesten (1973) conditions hold for the GARCH SRE, giving a unique stationary solution with multivariate regular variation.
- domain assumption The Basrak-Segers identities E(||A Theta_hat||^kappa) = 1 and the spectral representation (2.13)-(2.14) hold.
- domain assumption Condition (3.3): (1/t) ln ||C_t|| -> 0 almost surely, for the normalized matrix product.
- standard math Extremal index and cluster distribution formulas from O'Brien (1987), Rootzen (1988), and Hsing et al. (1988) apply to the tail chain.
- ad hoc to paper In Section 4, the sign variables I_t are iid Bernoulli(delta) and independent of the squared tail chain.
Cite this review
Pith. "Pith review of Evaluation of extremal properties of GARCH(p,q) processes." pith.science (2026). https://pith.science/paper/DOG5KQA2
@misc{pith2026190806835,
  author       = {Pith},
  title        = {Pith review of: Evaluation of extremal properties of GARCH(p,q) processes},
  year         = {2026},
  howpublished = {\url{https://pith.science/paper/DOG5KQA2}},
  note         = {Machine review of arXiv:1908.06835}
}
read the original abstract
Generalized autoregressive conditionally heteroskedastic (GARCH) processes are widely used for modelling features commonly found in observed financial returns. The extremal properties of these processes are of considerable interest for market risk management. For the simplest GARCH(p,q) process, with max(p,q) = 1, all extremal features have been fully characterised. Although the marginal features of extreme values of the process have been theoretically characterised when max(p, q) >= 2, much remains to be found about both marginal and dependence structure during extreme excursions. Specifically, a reliable method is required for evaluating the tail index, which regulates the marginal tail behaviour and there is a need for methods and algorithms for determining clustering. In particular, for the latter, the mean number of extreme values in a short-term cluster, i.e., the reciprocal of the extremal index, has only been characterised in special cases which exclude all GARCH(p,q) processes that are used in practice. Although recent research has identified the multivariate regular variation property of stationary GARCH(p,q) processes, currently there are no reliable methods for numerically evaluating key components of these characterisations. We overcome these issues and are able to generate the forward tail chain of the process to derive the extremal index and a range of other cluster functionals for all GARCH(p, q) processes including integrated GARCH processes and processes with unbounded and asymmetric innovations. The new theory and methods we present extend to assessing the strict stationarity and extremal properties for a much broader class of stochastic recurrence equations.
Figures


Figures from the paper (6 more)



Reference graph
Works this paper leans on
-
[1]
" write newline "" before.all 'output.state := FUNCTION n.dashify 't := "" t empty not t #1 #1 substring "-" = t #1 #2 substring "--" = not "--" * t #2 global.max substring 't := t #1 #1 substring "-" = "-" * t #2 global.max substring 't := while if t #1 #1 substring * t #2 global.max substring 't := if while FUNCTION word.in bbl.in capitalize " " * FUNCT...
-
[2]
Azzalini, A. and Capitanio, A. (2003) Distributions generated by perturbation of symmetry with emphasis on a multivariate skew t-distribution. Journal of the Royal Statistical Society, Series B\/ , 65 , 367--389
work page 2003
-
[3]
Basrak, B., Davis, R. A. and Mikosch, T. (2002) Regular variation of GARCH processes. Stochastic Processes and their Applications\/ , 99 , 95--115
work page 2002
-
[4]
Basrak, B. and Segers, J. (2009) Regularly varying multivariate time series. Stochastic Processes and their Applications\/ , 119 , 1055--1080
work page 2009
-
[5]
Basrak, B. and Segers, J. (2011) Erratum to: `` R egularly varying multivariate time series'' [ S tochastic P rocess. A ppl. 119 (2009) 1055--1080]. Stochastic Processes and their Applications\/ , 121 , 896 -- 898
work page 2011
-
[6]
(1986) Generalized autoregressive conditional heteroskedasticity
Bollerslev, T. (1986) Generalized autoregressive conditional heteroskedasticity. Journal of Econometrics\/ , 31 , 307--327
work page 1986
-
[7]
Bougerol, P. and Picard, N. (1992) Stationarity of GARCH processes and of some nonnegative time series. Journal of Econometrics\/ , 52 , 115--127
work page 1992
-
[8]
Breidt, J. F. and Davis, R. A. (1998) Extremes of stochastic volatility models. The Annals of Applied Probability\/ , 8 , 664--675
work page 1998
Show all 36 references
-
[9]
F., Diao, G
Collamore, J. F., Diao, G. and Vidyashankar, A. N. (2014) Rare event simulation for processes generated via stochastic fixed point equations. The Annals of Applied Probability\/ , 24 , 2143--2175
2014
-
[10]
Davis, R. A. and Mikosch, T. (2009 a ) Extreme value theory for GARCH processes. In Handbook of Financial Time Series\/ (eds. T. Andersen, R. Davis, J. Kreiss and T. Mikosch). New York: Springer, pp. 187--200
2009
-
[11]
Davis, R. A. and Mikosch, T. (2009 b ) The extremogram: a correlogram for extreme events. Bernoulli\/ , 4 , 977--1009
2009
-
[12]
I., Rootz\'en, H
de Haan, L., Resnick, S. I., Rootz\'en, H. and de Vries, C. G. (1989) Extremal behaviour of solutions to a stochastic difference equation with applications to ARCH processes. Stochastic Processes and their Applications\/ , 32 , 213--224
1989
-
[13]
and Miclo, L
Del Moral, P. and Miclo, L. (2000) Branching and interacting particle systems approximations of F eynman- K ac formulae with applications to non-linear filtering. In Seminaire de probabilites XXXIV\/ . Springer, pp. 1--145
2000
-
[14]
and Miclo, L
Del Moral, P. and Miclo, L. (2003) Particle approximations of Lyapunov exponents connected to Schr \"o dinger operators and Feynman--Kac semigroups . ESAIM: Probability and Statistics\/ , 7 , 171--208
2003
-
[15]
and Andrieu, C
Doucet, A., Godsill, S. and Andrieu, C. (2000) On sequential M onte C arlo sampling methods for B ayesian filtering. Statistics and Computing\/ , 10 , 197--208
2000
-
[16]
and Schlather, M
Ehlert, A., Fiebig, U.-R., Janssen, A. and Schlather, M. (2015) Joint extremal behavior of hidden and observable time series with applications to GARCH processes. Extremes\/ , 18 , 109--140
2015
-
[17]
and Zako \"i an, J.-M
Francq, C. and Zako \"i an, J.-M. (2010) GARCH Models: Structure, Statistical Inference and Financial Applications\/ . Chichester, United Kingdom: John Wiley & Sons, Ltd
2010
-
[18]
Goldsheid, I. Y. (1991) Lyapunov exponents and asymptotic behaviour of the product of random matrices. Lecture Notes in Mathematics\/ , 1486 , 23--37
1991
-
[19]
A., Roberts, G
Griffin, A., Jenkins, P. A., Roberts, G. O. and Spencer, S. E. (2017) Simulation from quasi-stationary distributions on reducible state spaces. Advances in Applied Probability\/ , 49 , 960--980
2017
-
[20]
and Leadbetter, M
Hsing, T., H\"usler, J. and Leadbetter, M. R. (1988) On the exceedance point process for a stationary sequence. Probability Theory and Related Fields\/ , 78 , 97--112
1988
-
[21]
(2010) On Some Connections between Light Tails, Regular Variation and Extremes\/
Janssen, A. (2010) On Some Connections between Light Tails, Regular Variation and Extremes\/ . Ph.D. thesis, University of Gottingen
2010
-
[22]
and Segers, J
Janssen, A. and Segers, J. (2014) Markov tail chains. Journal of Applied Probability\/ , 51 , 1133--1153
2014
-
[23]
(1983) Random Measures\/
Kallemberg, O. (1983) Random Measures\/ . Berlin: Akademic-Verlag, 3rd edn
1983
-
[24]
(1973) Random difference equations and renewal theory for products of random matrices
Kesten, H. (1973) Random difference equations and renewal theory for products of random matrices. Acta Mathematica\/ , 131 , 207--248
1973
-
[25]
and Spitzer, F
Kesten, H. and Spitzer, F. (1984) Random difference equations and renewal theory for products of random matrices. Zeitschrift f\"ur Wahrscheinlichkeitstheorie und Verwandte Gebiete\/ , 67 , 363--386
1984
-
[26]
and Tawn, J
Laurini, F. and Tawn, J. A. (2012) The extremal index for GARCH(1, 1) processes. Extremes\/ , 15 , 511--529
2012
-
[27]
Ledford, A. W. and Tawn, J. A. (2003) Diagnostics for dependence within time series extremes. Journal of the Royal Statistical Society, Series B\/ , 65 , 521--543
2003
-
[28]
and St a ric a , C
Mikosch, T. and St a ric a , C. (2000) Limit theory for the sample autocorrelations and extremes of a GARCH (1,1) process. The Annals of Statistics\/ , 28 , 1427--1451
2000
-
[29]
O'Brien, G. L. (1987) Extreme values for stationary and M arkov sequences. The Annals of Probability\/ , 15 , 281--291
1987
-
[30]
and Soulier, P
Planini \' c , H. and Soulier, P. (2018) The tail process revisited. Extremes\/ , 21 , 551--579. ://doi.org/10.1007/s10687-018-0312-1
2018 doi
-
[31]
Resnick, S. I. (1987) Extreme Values, Regular Variation, and Point Processes\/ . New York: Springer-Verlag
1987
-
[32]
(1988) Maxima and exceedancs of stationary M arkov chains
Rootz\'en, H. (1988) Maxima and exceedancs of stationary M arkov chains. Advanced in Applied Probability\/ , 20 , 371--390
1988
-
[33]
(2003) Functionals of clusters of extremes
Segers, J. (2003) Functionals of clusters of extremes. Advances in Applied Probability\/ , 35 , 1028--1045
2003
-
[34]
L., Tawn, J
Smith, R. L., Tawn, J. A. and Coles, S. G. (1997) Markov chain models for threshold exceedances. Biometrika\/ , 84 , 249--268
1997
-
[35]
Smith, R. L. and Weissman, I. (1994) Estimating the extremal index. Journal of the Royal Statistical Society, Series B\/ , 56 , 515--528
1994
-
[36]
Taylor, S. J. (1986) Modelling Financial Time Series\/ . Chichester: Wiley
1986
Reviewed August 14, 2026 · model on record in the stance chip above.
Discussion (0). Continue with ORCID to comment.