REVIEW 2 major objections 4 minor 66 references
Contrasting pressure evolutions of $f$ electron hybridized states in CeRhIn$_5$ and YbNi$_3$Ga$_9$: an optical conductivity study
T0 review · 2 major / 4 minor · reviewed 2026-08-14 · deepseek-v4-flash
Pith's one-line read Optical conductivity under pressure shows CeRhIn$_5$ and YbNi$_3$Ga$_9$ develop opposite f-electron hybridization trends.
desk verdict New high-pressure optics data with an opposite mIR-peak trend across a Ce/Yb pair; the qualitative claim holds, but the Yb interpretation leans on an unmeasured f-level shift and fit-dependent points. read the letter →
The pith
A machine-rendered reading of the paper's core claim, the machinery that carries it, and where it could break.
The reading
What carries the argument
The central object is the mid-infrared (mIR) peak in optical conductivity, interpreted as an optical excitation across renormalized $c$-$f$ hybridized bands. The load-bearing identity is $E_{\rm mIR}\simeq 2\tilde{V}\simeq\sqrt{T_K W}$, which ties the peak position to the renormalized $c$-$f$ hybridization $\tilde{V}$, the Kondo temperature $T_K$, and the conduction bandwidth $W$; a second identity, $J_{cf}\simeq |V|^2/|E_F-\varepsilon_f|$, links the effective exchange to the bare hybridization $V$ and the $f$-level position. Pressure enters through the ionic-radius/electron-hole picture: it moves the Ce $f$ level toward $E_F$ and the Yb $f$-hole level away from $E_F$. The mIR peak's energy, width, and spectral weight are then used as a direct optical readout of whether pressure localizes or delocalizes the $f$ electrons.
What would settle it
Measure YbNi$_3$Ga$_9$'s valence and $f$-level position relative to the Fermi energy (for example, by X-ray absorption or photoemission) across 0-10 GPa; if $|E_F-\varepsilon_f|$ does not increase faster than $|V|^2$, or if the declining mid-infrared peak energy loses its correlation with an independently measured Kondo scale, the electron-hole symmetry explanation would be falsified.
Extended reading notes
Core claim
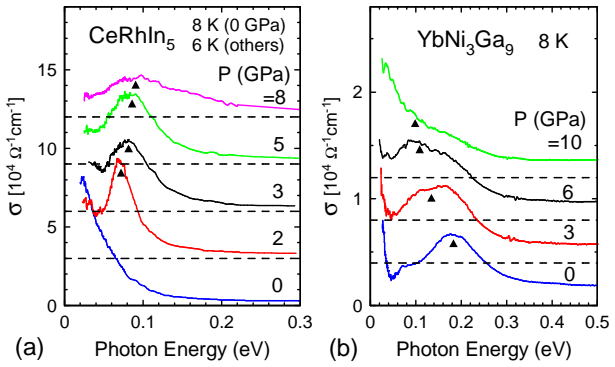
The central claim is that the pressure evolution of the mid-infrared peak in optical conductivity is opposite for the two compounds. In CeRhIn$_5$ the mIR peak develops with pressure and moves from roughly 70 meV at 2 GPa to about 90 meV at 8 GPa, while its width and spectral weight grow; on the standard reading $E_{\rm mIR}\simeq 2\tilde{V}$, this is a pressure-driven increase of the renormalized $c$-$f$ hybridization, moving the material from nearly localized toward intermediate-valence behavior. In YbNi$_3$Ga$_9$ the well-developed mIR peak at ambient pressure ($E_{\rm mIR}\approx 0.18$ eV) shifts downward and weakens with pressure, nearly merging with the Drude component at 10 GPa, which the paper takes as a decrease of effective hybridization despite the expected increase of bare hybridization. The proposed mechanism is the ionic-radius and electron-hole argument: pressure raises the Ce 4$f$ level toward $E_F$, so $J_{cf}\simeq |V|^2/|E_F-\varepsilon_f|$ grows, while it raises the Yb 4$f$-hole level away from $E_F$, so the denominator wins and $J_{cf}$ falls. The two materials therefore move in opposite directions on the universal relation between mIR peak energy and a hybridization measure.
Load-bearing premise
The argument depends on the assumption that the mid-infrared peak's energy directly measures the renormalized $c$-$f$ hybridization and that in YbNi$_3$Ga$_9$ pressure pushes the $f$-hole level away from the Fermi energy faster than it increases the raw hybridization; if the peak simply faded because of a valence crossover or a band-structure effect, the opposite-hybridization conclusion would not follow.
Editorial extensions
If this is right
- For CeRhIn$_5$, the low-temperature normal state is tuned by pressure from weakly hybridized to strongly hybridized, with the mIR peak energy rising from 70 to 90 meV, so the electronic structure that hosts the quantum critical and superconducting behavior is not fixed.
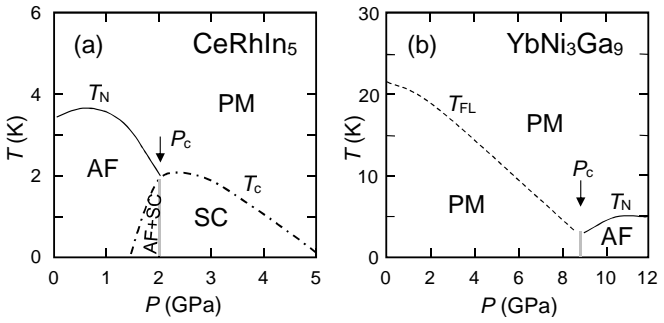
- For YbNi$_3$Ga$_9$, the effective $c$-$f$ hybridization decreases with pressure even though atomic overlap increases, consistent with the measured valence increase and the appearance of antiferromagnetic order above the critical pressure near 9 GPa.
- The pressure points of both compounds fall on the same universal relation between mIR peak energy and hybridization measure, with CeRhIn$_5$ moving to higher hybridization energy and YbNi$_3$Ga$_9$ to lower.
- At 10 GPa YbNi$_3$Ga$_9$ still shows a residual mIR component with sizable spectral weight, so some hybridization persists even in the more localized regime.
- The observed asymmetry in peak broadening and in the size of the energy shift shows that the simple electron-hole symmetry picture is only qualitative for these two materials.
Reading between the lines
- A testable extension of the electron-hole argument is that other Yb-based intermediate-valence compounds, such as YbCu$_2$Ge$_2$ and YbAl$_2$, should show a similar pressure-induced downturn of their mIR peak energy; measuring their optical conductivity under pressure would check whether the Yb behavior is generic.
- Because the paper does not directly measure the Yb $f$-level position, an experiment tracking that level relative to the Fermi energy under pressure (for example, by photoemission or resonant X-ray emission) could confirm that it moves away faster than the raw hybridization grows; if not, the weakening-hybridization reading would need revision.
- The model implies that YbNi$_3$Ga$_9$'s mIR peak energy should keep decreasing or saturate beyond 10 GPa as long as the $f$-hole level outruns the growing bare hybridization; a turnaround at higher pressure would signal that the bare hybridization term eventually dominates.
Signed reviews
Editorial analysis
A structured set of objections, weighed in public.
Referee Report
Summary. The paper reports optical conductivity measurements of CeRhIn5 and YbNi3Ga9 under external pressures up to 10 GPa and at low temperatures (6–8 K). The central empirical finding is that the mid-infrared (mIR) peak evolves oppositely in the two compounds: in CeRhIn5 it develops with pressure and shifts to higher energy, whereas in YbNi3Ga9 it weakens and shifts to lower energy, nearly merging with the Drude component at 10 GPa. The authors interpret these trends as opposite pressure dependencies of the effective c-f hybridization and discuss them within the electron-hole symmetry picture between Ce and Yb compounds.
Significance. If the interpretation holds, the paper provides valuable new high-pressure optical data that constrain how c-f hybridization evolves across the Ce/Yb electron-hole asymmetry. The raw spectra in Fig. 5 give direct, model-independent evidence of the contrasting qualitative trends, and the placement of the new data points on the existing universal relation of Ref. 10 is a useful empirical test rather than a circular fit. The high-pressure DAC optical experiments to 10 GPa are technically demanding, and the comparison between a Ce and a Yb compound in the same pressure range is instructive. The main weakness is that the quantitative YbNi3Ga9 trajectory, and especially the interpretation of the diminishing mIR peak as a decrease in renormalized hybridization, rests on fit-dependent quantities and an unmeasured f-level shift.
major comments (2)
- [Appendix and Fig. 4(d)] The quantitative evolution of the mIR peak in YbNi3Ga9, most importantly the 10 GPa point that anchors the 'merged with Drude' conclusion, is obtained from Drude-Lorentz fitting in a regime where the text itself states that the mIR peak is 'not well resolved from the Drude component any more.' No uncertainties or robustness checks are reported for the fitted EmIR, FWHM, and SW values. Please provide estimates of fit uncertainty, for example by varying the number of Lorentz oscillators, changing the Drude constraints, or trying alternative decompositions. As written, the quantitative downshift and reduced spectral weight at 10 GPa cannot be distinguished from decomposition ambiguity.
- [Section III.C, Eq. (2)] The inference that the decreasing EmIR of YbNi3Ga9 reflects a decrease of the renormalized hybridization V~ assumes that |EF - εf| increases with pressure faster than |V|^2. This f-level shift is not measured for YbNi3Ga9; footnote 63 and Ref. 61 provide a generic electrostatic argument, not material-specific data. The paper should explicitly label this as a plausible interpretation rather than a demonstrated conclusion, and discuss alternative origins of the weakening and apparent downshift of the mIR peak, such as a valence crossover, enhanced scattering, or changes in the Drude-Lorentz decomposition. This issue is load-bearing because the paper's central statement about 'opposite pressure evolutions of f electron hybridized states' relies on the assignment of the YbNi3Ga9 mIR peak evolution to a reduced V~.
minor comments (4)
- [Section II] The text contains a typo: 'Kramres-Kronig' should be 'Kramers-Kronig'.
- [Fig. 4(c), Fig. 4(d)] The two-peak structure of the YbNi3Ga9 mIR feature at 3 and 6 GPa is described in the main text, and the center-of-mass definition of EmIR is given only in the Appendix. This definition and the criterion for using more than two Lorentz oscillators should be stated in the main text where the fit results are first discussed.
- [Fig. 3(b) and Fig. 4(b)] The interpolation across the 0.23–0.3 eV range caused by diamond absorption is mentioned in the figure captions and footnote 49, but a sensitivity test or illustrative comparison showing that the interpolation does not affect the mIR peak parameters would increase confidence in the quantitative fits.
- [Fig. 1 caption] The newly added data points are described as red, but the caption does not specify how they are distinguished in grayscale printing; using distinct symbols in addition to color would improve accessibility.
Circularity Check
No significant circularity: the central experimental trends are direct spectral observations, and the interpretive model is independently established.
full rationale
The paper reports direct optical-conductivity spectra at different pressures. The central claim—opposite pressure evolutions of the mid-infrared peak in CeRhIn5 versus YbNi3Ga9—is read off raw spectra in Fig. 5 and does not depend on any fitted parameter that is later called a prediction. The peak energies and spectral weights are obtained by Drude-Lorentz fitting, but the qualitative trends (growth/up-shift for CeRhIn5; down-shift/diminishing for YbNi3Ga9) are visible in the measured sigma(omega) curves. Interpretation uses EmIR ≈ 2V~ and V~ ≈ sqrt(TK W) (Eq. 1), attributed to independent theoretical work (Refs. 18–20) and to an empirical universal relation (Refs. 8–11, Fig. 1). Although Fig. 1 is reproduced from Ref. 10, whose first author is also a co-author here, the newly added CeRhIn5/CeCoIn5/YbNi3Ga9 points are independent measurements plotted against literature gamma values; they test, rather than define, the relation. The Yb discussion uses Eq. (2) (Schrieffer–Wolff) with the assumption that epsilon_f moves away from EF under pressure (footnote 63 and Ref. 61); this is an unmeasured interpretive assumption and a correctness/robustness risk, not a circular reduction, because the observed EmIR decrease is not the definition of that f-level shift. The Appendix's admission that at 10 GPa 'the mIR peak is not well resolved from the Drude component any more' flags fitting uncertainty at the highest pressure, but this again affects reliability rather than circularity. No equation in the paper is shown to be equivalent to its inputs by construction, and no fitted parameter is renamed as a prediction. Therefore no significant circularity is found.
Assumptions & free parameters
free parameters (3)
- mIR Lorentz oscillator energies (omega0) and widths (gamma) =
Not individually reported; resulting EmIR 70-90 meV (CeRhIn5), 0.18-0.10 eV (YbNi3Ga9)
- Drude component sigma(0) constraint for CeRhIn5 =
8-20 x 10^4 Ohm^-1 cm^-1
- Background Lorentz oscillator parameters =
Peak at 0.45 eV (CeRhIn5) or 0.75 eV (YbNi3Ga9); eps_inf=5
assumptions (5)
- standard math Kramers-Kronig relation and Hagen-Rubens extrapolation yield reliable sigma(omega) from measured R(omega)
- domain assumption The mid-infrared peak in sigma(omega) of Ce/Yb intermetallics originates from transitions in renormalized c-f hybridized bands, with EmIR roughly 2V~
- domain assumption The universal relation between EmIR and sqrt(a/(gamma*gamma0)) holds for these compounds
- standard math Jcf roughly |V|^2 / |EF - eps_f| describes the c-f exchange and is valid under electron-hole symmetry
- domain assumption Under pressure, eps_f shifts toward EF for Ce and away from EF for Yb
Cite this review
Pith. "Pith review of Contrasting pressure evolutions of $f$ electron hybridized states in CeRhIn$_5$ and YbNi$_3$Ga$_9$: an optical conductivity study." pith.science (2026). https://pith.science/paper/DRGLVJ2C
@misc{pith2026190803667,
  author       = {Pith},
  title        = {Pith review of: Contrasting pressure evolutions of $f$ electron hybridized states in CeRhIn$_5$ and YbNi$_3$Ga$_9$: an optical conductivity study},
  year         = {2026},
  howpublished = {\url{https://pith.science/paper/DRGLVJ2C}},
  note         = {Machine review of arXiv:1908.03667}
}
abstract
Optical conductivity [$\sigma(\omega)$] of CeRhIn$_5$ and YbNi$_3$Ga$_9$ have been measured at external pressures to 10 GPa and at low temperatures to 6 K. Regarding CeRhIn$_5$, at ambient pressure the main feature in $\sigma(\omega)$ is a Drude peak due to free carriers. With increasing pressure, however, a characteristic mid-infrared (mIR) peak rapidly develops in $\sigma(\omega)$, and its peak energy and width increase with pressure. These features are consistent with an increased conduction ($c$)-$f$ electron hybridization at high pressure, and show that the pressure has tuned the electronic state of CeRhIn$_5$ from very weakly to strongly hybridized ones. As for YbNi$_3$Ga$_9$, in contrast, a marked mIR peak is observed already at ambient pressure, indicating a strong $c$-$f$ hybridization. At high pressures, however, the mIR peak shifts to lower energy and becomes diminished, and seems merged with the Drude component at 10 GPa. Namely, CeRhIn$_5$ and YbNi$_3$Ga$_9$ exhibit some opposite tendencies in the pressure evolutions of $\sigma(\omega)$ and electronic structures. These results are discussed in terms of the pressure evolutions of $c$-$f$ hybridized electronic states in Ce and Yb compounds, in particular in terms of the electron-hole symmetry often considered between Ce and Yb compounds.
Figures


Figures from the paper (3 more)


Reference graph
Works this paper leans on
-
[1]
See, for example, Y. O nuki, Physics of Heavy Fermions: Heavy Fermions and Strongly Correlated Electron Systems (World Scientific, 2018)
work page 2018
- [2]
-
[3]
P. S. Riseborough and J. M. Lawrence, Rep. Prog. Phys. 79 , 084501 (2016)
work page 2016
-
[4]
For a recent review, see, for example, R. Y. Chen and N. L. Wang, Rep. Prog. Phys. 79 , 064502 (2016)
work page 2016
-
[5]
B. C. Webb, A. J. Sievers, and T. Mihalisin, Phys. Rev. Lett. 57 , 1951 (1986)
work page 1986
-
[6]
S. R. Garner, J. N. Hancock, Y. W. Rodriguez, Z. Schlesinger, B. Bucher, Z. Fisk, and J. L. Sarrao, Phys. Rev. B 62 , R4778 (2000)
work page 2000
- [7]
-
[8]
S. V. Dordevic, D. N. Basov, N. R. Dilley, E. D. Bauer, and M. B. Maple, Phys. Rev. Lett. 86 , 684 (2001)
work page 2001
Show all 66 references
-
[9]
J. N. Hancock, T. McKnew, Z. Schlesinger, J. L. Sarrao, and Z. Fisk, Phys. Rev. Lett. 92 , 186405 (2004)
2004
-
[10]
Okamura, T
H. Okamura, T. Watanabe, M. Matsunami, T. Nishihara, N. Tsujii, T. Ebihara, H. Sugawara, H. Sato, Y. O nuki, Y. Ishikawa, T. Takabatake, and T. Nanba, J. Phys. Soc. Jpn. 76 , 023703 (2007)
2007
-
[11]
Lonzarich, D
G. Lonzarich, D. Pines, and Y. Yang, Rep. Prog. Phys. 80 , 024501 (2017)
2017
-
[12]
Mutou and T
T. Mutou and T. Saso, J. Phys. Soc. Jpn. 73 , 2900 (2004)
2004
-
[13]
Kuroiwa, Y
H. Kuroiwa, Y. Imai, and T. Saso, J. Phys. Soc. Jpn. 76 , 124704 (2007)
2007
-
[14]
Kimura, T
S. Kimura, T. Iizuka, and Y. Kwon, J. Phys. Soc. Jpn. 78 , 013710 (2009)
2009
-
[15]
Kimura, Phys
S. Kimura, Phys. Rev. B 80 , 073103 (2009)
2009
-
[16]
Kimura, Y
S. Kimura, Y. Kwon, Y. Matsumoto, H. Aoki, and O. Sakai, J. Phys. Soc. Jpn. 85 , 083702 (2016)
2016
-
[17]
K. S. Burch, S. V. Dordevic, F. P. Mena, A. B. Kuzmenko, D. van der Marel, J. L. Sarrao, J. R. Jeffries, E. D. Bauer, M. B. Maple, and D. N. Basov, Phys. Rev. B 75 , 054523 (2007)
2007
-
[18]
D. L. Cox, Phys. Rev. Lett. 58 , 2730 (1987)
1987
-
[19]
Coleman, in Handbook of Magnetism and Advanced Magnetic Materials Vol
P. Coleman, in Handbook of Magnetism and Advanced Magnetic Materials Vol. 1: Fundamentals and Theory (Wiley, New York, 2007). Also available as P. Coleman, Heavy Fermions: electrons at the edge of magnetism, arXiv:cond-mat/0612006 (2007)
2007 arXiv
-
[20]
Coleman, Heavy fermions and the Kondo lattice: a 21st century perspevtive, arXiv: 1509.05769 (2015)
P. Coleman, Heavy fermions and the Kondo lattice: a 21st century perspevtive, arXiv: 1509.05769 (2015)
2015 arXiv
-
[21]
Kadowaki and S
K. Kadowaki and S. B. Woods, Solid State Commun. 58 , 507 (1986)
1986
-
[22]
Tsujii, H
N. Tsujii, H. Kontani, and K. Yoshimura, Phys. Rev. Lett. 94 , 057201 (2005)
2005
-
[23]
Heavy fermion material: Ce versus Yb case
J. Flouquet and H. Harima, "Heavy fermion material: Ce versus Yb case", arXiv:0910.3110 (2009). Also published in Japanese in Kotai Butsuri 47 , 47 (2012)
2009 arXiv
-
[24]
Knebel, R
G. Knebel, R. Boursier, E. Hassinger, G. Lapertot, P. G. Niklowetz, A. Pourret, B. Salce, J. P. Sanchez, I. Sheikin, P. Bonville, H. Harima, and J. Flouquet, J. Phys. Soc. Jpn. 75 , 114709 (2006)
2006
-
[25]
A. V. Goltsev and M. M. Abd-Elmeguid, J. Phys.: Condense. Matter 17 , S813 (2005)
2005
-
[26]
J. D. Thompson and J. M. Lawrence, Handbook on the Physics and Chemistry of Rare Earths, Vol. 19 (ed. K.A. Gschneidner, Jr. L. Eyring, G. H. Lander, and G. R. Choppin, Elsevier 1994), p382
1994
-
[27]
Hegger, C
H. Hegger, C. Petrovic, E. G. Moshopoulou, M. F. Hundley, J. L. Sarrao, Z. Fisk, J. D. Thompson, Phys. Rev. Lett. 84 , 4986 (2000)
2000
-
[28]
Muramatsu, N
T. Muramatsu, N. Tateiwa, T. C. Kobayashi, K. Shimizu, K. Amaya, D. Aoki, H. Shishido, Y. Haga, and Y. O nuki, J. Phys. Soc. Jpn. 70 , 3362 (2001)
2001
-
[29]
For review, see, for example, J. L. Sarrao and J. D. Thompson, J. Phys. Soc. Jpn. 76 , 051013 (2007), and papers cited therein
2007
-
[30]
Shishido, R
H. Shishido, R. Settai, H. Harima, and Y. O nuki, J. Phys. Soc. Jpn. 74 , 1103 (2005)
2005
-
[31]
T. Park, F. Ronning, H. Q. Yuan, M. B. Salamon, R. Movshovich, J. L. Sarrao, and J. D. Thompson, Nature 440 , 65 (2006),
2006
-
[32]
Knebel, D
G. Knebel, D. Aoki, J.-P. Brison, and J. Flouquet, J. Phys. Soc. Jpn. 77 , 114704 (2008)
2008
-
[33]
F. P. Mena, D. van der Marel, and J. L. Sarrao, Phys. Rev. B 72 , 045119 (2005)
2005
-
[34]
Yamashita, R
T. Yamashita, R. Miyazaki, Y. Aoki, and S. Ohara, J. Phys. Soc. Jpn. 81 , 034705 (2012)
2012
-
[35]
Utsumi, H
Y. Utsumi, H. Sato, S. Ohara, T. Yamashita, K. Mimura, S. Motonami, K. Shimada, S. Ueda, K. Kobayashi, H. Yamaoka, N. Tsujii, N. Hiraoka, H. Namatame, M. Taniguchi, Phys. Rev. B 86 , 115114 (2012)
2012
-
[36]
Matsubayashi, T
K. Matsubayashi, T. Hirayama, T. Yamashita, S. Ohara, N. Kawamura, M. Mizumaki, N. Ishimatsu, S. Watanabe, K. Kitagawa, Y. Uwatoko, Phys. Rev. Lett. 114 , 086401 (2015)
2015
-
[37]
K. Umeo, T. Otaki, Y. Arai, S. Ohara, and T. Takabatake, Phys. Rev. B 98 , 024420 (2018)
2018
-
[38]
Dressel and G
M. Dressel and G. Gr \"u ner, Electrodynamics of Solids (Cambridge University Press, Cambridge, 2002)
2002
-
[39]
Okamura, Chapter 4 in Optical Techniques for Solid State Materials Characterization (R
H. Okamura, Chapter 4 in Optical Techniques for Solid State Materials Characterization (R. Prasankumar and A. Taylor, Ed.), CRC Press (2011)
2011
-
[40]
Fukui, H
K. Fukui, H. Miura, H. Nakagawa, I. Shimoyama, K. Nakgawa, H. Okamura, T. Nanba, M. Hasumoto, and T. Kinoshita, Nucl. Instr. Methods Phys. Res. A 467-468 , 601 (2001)
2001
-
[41]
Okamura, Y
H. Okamura, Y. Ikemoto, T. Mariwaki, and T. Nanba, Jpn. J. Appl. Phys. 56 , 05FA11 (2017)
2017
-
[42]
Tateiwa and Y
N. Tateiwa and Y. Haga, Rev. Sci. Instrum. 80 , 123901 (2009)
2009
-
[43]
Klotz, K
S. Klotz, K. Takemura, Th. Strassie, and Th. Hansen, J. Phys.: Condens. Matter 24 , 325103 (2012)
2012
-
[44]
Glycerin has good characteristics as a pressure transmitting medium. medium1,medium2 It does not solidify at room T up to about 5 GPa, and produces more hydrostatic pressure even at lower T compared with solid media such as NaCl and KBr, which are commonly used for optical stu...
-
[45]
Okamura, J
H. Okamura, J. Phys. Conf. Ser. 359 , 012013 (2012)
2012
-
[46]
Kimura and H
S. Kimura and H. Okamura, J. Phys. Soc. Jpn. 82 , 021004 (2013)
2013
-
[47]
Ikemoto, T
Y. Ikemoto, T. Moriwaki, T. Hirono, S. Kimura, K. Shinoda, M. Matsunami, N. Nagai, T. Nanba, K. Kobayashi, and H. Kimura, Infrared Phys. Tech. 45 , 369 (2004)
2004
-
[48]
Moriwaki and Y
T. Moriwaki and Y. Ikemoto, Infrared Phys. Tech. 51 , 400 (2008)
2008
-
[49]
Therefore, the R( ) spectra in this range were interpolated as indicated by the broken curves in Figs
Due to strong absorption by the diamond anvil, the spectral range between 0.23 and 0.3 eV could not be measured well. Therefore, the R( ) spectra in this range were interpolated as indicated by the broken curves in Figs. 3(b) and 4(b). It is clear from Figs. 3(c) and 4(c) that...
-
[50]
E. J. Singley, D. N. Basov, E. D. Bauer, and M. B. Maple, Phys. Rev. B 65 , 161101(R) (2002)
2002
-
[51]
Okamura, A
H. Okamura, A. Takigawa, E. D. Bauer, T. Moriwaki, and Y. Ikemoto, J. Phys.: Conf. Ser. 592 , 012001 (2015)
2015
-
[52]
=290 mJ/K ^2 mol for CeCoIn _5 at 0 GPa, basov _0 =10 mJ/K ^2 mol for LaCoIn _5 , nakatsuji =382 mJ/K ^2 mol for CeRhIn _5 at 2 GPa, fisher and _0 =5.7 mJ/K ^2 mol for LaRhIn _5
To make the plots, the following data have been used. =290 mJ/K ^2 mol for CeCoIn _5 at 0 GPa, basov _0 =10 mJ/K ^2 mol for LaCoIn _5 , nakatsuji =382 mJ/K ^2 mol for CeRhIn _5 at 2 GPa, fisher and _0 =5.7 mJ/K ^2 mol for LaRhIn _5 . 115-sc
-
[53]
Nakatsuji, unpublished data
S. Nakatsuji, unpublished data
-
[54]
R. A. Fisher, F. Bouquet, N. E. Phillips, M. F. Hundley, P. G. Pagliuso, J. L. Sarrao, Z. Fisk, and J. D. Thompson, Phys. Rev. B 65 , 224509 (2002)
2002
-
[55]
Okamura, T
H. Okamura, T. Michizawa, T. Nanba, and T. Ebihara, J. Phys. Soc. Jpn. 73 , 2045 (2004)
2004
-
[56]
139-pressure , only the magnetic part of the resistivity ( _m ) at high P is reported
In Ref. 139-pressure , only the magnetic part of the resistivity ( _m ) at high P is reported. Therefore, we used the resistivity of LuNi _3 Ga _9 at P =0 (Ref. 139-ohara ) as the non-magnetic part ( _0 ) to obtain the total resistivity = _0 + _m , and the corresponding dc con...
-
[57]
Okamura, R
H. Okamura, R. Kitamura, M. Matsunami, H. Sugawara, H. Harima, H. Sato, T. Moriwaki, Y. Ikemoto, T. Nanba, J. Phys. Soc. Jpn. 80 , 084718 (2011)
2011
-
[58]
Iizuka, T
T. Iizuka, T. Mizuno, B. H. Min, Y. S. Kwon, S. Kimura, J. Phys. Soc. Jpn. 81 , 043703 (2012)
2012
-
[59]
=80 and 230 mJ/K ^2 mol at P =3 and 6 GPa, respectively, 139-gamma were used
-
[60]
Yamaoka, Y
H. Yamaoka, Y. Yamamoto, E. F. Schwier, F. Honda, Y. Zekko, Y. Ohta, J.-F. Lin, M. Nakatake, H. Iwasawa, M. Arita, K. Shimada, N. Hiraoka, H. Ishii, K.-D. Tsuei, and J. Mizuki, Phys. Rev. B 92 , 235110 (2015)
2015
-
[61]
Nishiyama, T
K. Nishiyama, T. Mito, G. Pristas, T. Koyama, K. Ueda, T. Kohara, S. Gabani, K. Flachbart, H. Fukazawa, Y. Kohori, N. Takeshita, N. Shitsevalova, and H. Ikeda, Phys. Rev. B 93 , 121111(R) (2016)
2016
-
[62]
J. R. Schrieffer and P. A. Wolff, Phys. Rev. 149 , 491 (1966)
1966
-
[63]
Note that an Yb or Ce is positively charged locally, since it provides a few electrons into the spatially extended c band
This is because the negatively charged surrounding of an Yb or Ce becomes closer to the f electrons at high P , causing more Coulomb repulsion between the f electron and the surrounding. Note that an Yb or Ce is positively charged locally, since it provides a few electrons int...
-
[64]
Miyake, F
A. Miyake, F. Honda, R. Settai, K. Shimizu, and Y. O nuki, J. Phys. Soc. Jpn. 81 , SB054 (2012)
2012
-
[65]
Dallera, E
C. Dallera, E. Annese, J.-P. Rueff, A. Palenzona, G. Vanko, L. Braicovich, A. Shukla, and M. Grioni, Phys. Rev. B 68 , 245114 (2003)
2003
-
[66]
Okamura, M
H. Okamura, M. Nagata, A. Tsubouchi, Y. O nuki, Y. Ikemoto, and T. Moriwaki, arXiv:1909.11857
1909 arXiv
Reviewed August 14, 2026 · model on record in the stance chip above.
Discussion (0). Continue with ORCID to comment.