REVIEW 3 major objections 5 minor 61 references
Exploring the Origins of Optical Variability in AGNs: Correlations with Black Hole Properties, X-ray, and Radio Emission
T0 review · 3 major / 5 minor · reviewed 2026-08-05 · deepseek-v4-flash
Pith's one-line read This paper argues that long-term optical variability in active galactic nuclei is driven by thermal emission from the accretion disk, traced by a damping timescale that grows with black hole mass and luminosity while X-ray and radio propert
desk verdict Confirmatory DRW timescale study with a real censoring problem in its central correlations; the null X-ray/radio results are the useful part. read the letter →
The pith
A machine-rendered reading of the paper's core claim, the machinery that carries it, and where it could break.
The reading
What carries the argument
The Damped Random Walk (DRW) model: a Gaussian-process description in which a light curve has finite memory, so that after a characteristic damping timescale $\tau_d$ fluctuations decorrelate. Fitting DRW to each ZTF light curve yields $\tau_d$ and the asymptotic variability amplitude $\sigma$; the excess variance $F_{\rm var}$ provides a model-independent variability measure. $\tau_d$ is interpreted as the thermal timescale of the accretion disk, so its correlations with black hole mass and luminosity carry the argument.
What would settle it
Restrict the analysis to Type 1 AGN with ZTF baselines longer than ten times their fitted $\tau_d$, or correct for censoring using simulated light curves, and recompute the Spearman correlations with mass and luminosity; if the correlations disappear or drop below significance, the claim that disk thermal timescales drive long-term variability is not supported. A second check: simultaneous optical and X-ray monitoring over several years should show correlated reprocessing signatures if X-rays drive optical variations, whereas the paper predicts they remain uncorrelated.
Extended reading notes
Core claim
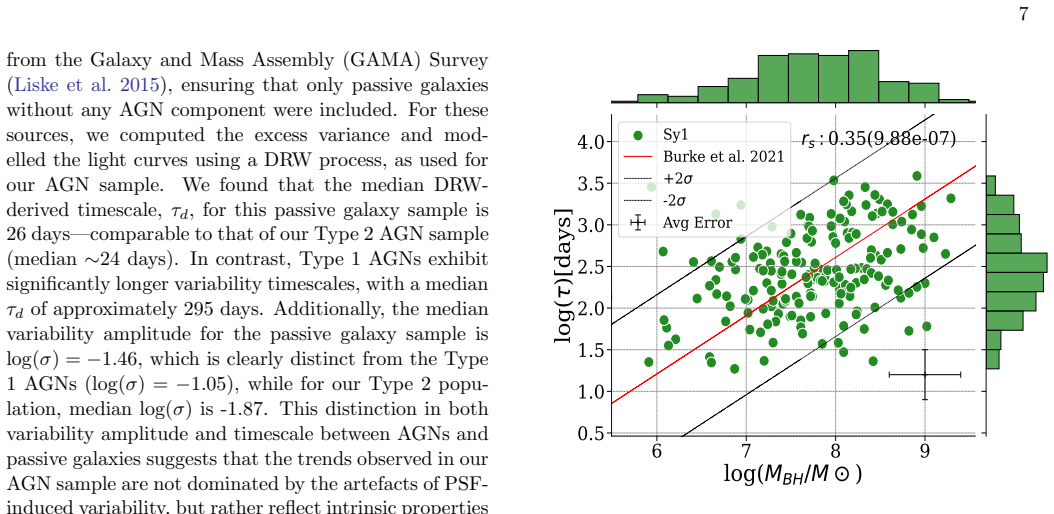
The paper's central claim is that the characteristic damping timescale $\tau_d$ recovered from damped random walk fits to optical light curves is a physical clock set by the accretion disk, not by X-ray reprocessing or jet activity. For 227 Type 1 AGN with BASS-DR2 properties, $\tau_d$ correlates with SMBH mass ($r_s=0.35$, $p\approx 10^{-7}$) and bolometric luminosity ($r_s=0.40$, $p\approx 10^{-10}$), while the Eddington ratio shows only weak dependence ($r_s=0.13$). The variability amplitude $\sigma$ shows weaker mass and luminosity correlations ($r_s=0.24$ and $0.33$) and essentially none with Eddington ratio ($r_s=0.08$). The paper finds no significant correlation between optical variab
Load-bearing premise
The fitted DRW damping timescales are treated as exact values in the correlations, even though the paper says timescales longer than about one tenth of the light-curve baseline should be treated as upper limits; if many of those upper limits are biased low, the reported correlations could be biased or weakened.
Editorial extensions
If this is right
- If $\tau_d$ is a disk thermal timescale, variability monitoring gives an indirect way to estimate black hole mass and accretion-disk scale in AGN where spectroscopy is unavailable.
- Distinct $\tau_d$ and $\sigma$ distributions for Type 1 versus Type 2 AGN support orientation-based unification and can flag misclassified or transitional sources.
- Long-term optical variability is not a reliable proxy for X-ray or radio activity; multi-wavelength variability models should treat the disk as the primary driver.
- The measured correlations are lower limits because many $\tau_d$ values are upper limits, so longer-baseline surveys should reveal the true, possibly stronger, relations.
Reading between the lines
- Editorial: If the $\tau_d$-mass relation is real, it could be sharpened into a black hole mass estimator once censoring is handled; the paper's correlations treat upper limits as exact values, so a survival-analysis refit is a direct next test.
- Editorial: The weak X-ray/optical anti-correlation, if confirmed with simultaneous monitoring, could indicate that X-ray variability and disk optical fluctuations share a fixed accretion-energy budget, with more X-ray variation corresponding to less optical variation.
- Editorial: Because the sample is hard-X-ray selected, the correlations may be diluted by orientation and absorption biases; repeating the analysis on an optically selected quasar sample with identical light-curve treatment would isolate those effects.
- Editorial: The same DRW fits could be extended to the ZTF $g$ and $i$ bands to test whether $\tau_d$ scales with wavelength as predicted by disk thermal models, a prediction the paper does not make.
Signed reviews
Editorial analysis
A structured set of objections, weighed in public.
Referee Report
Summary. The paper studies optical variability of 528 Swift/BAT AGN using ~5-year ZTF r-band light curves. The authors fit damped random walk (DRW) models to estimate the damping timescale tau_d and amplitude sigma, and correlate these with black hole mass, bolometric luminosity, Eddington ratio, X-ray properties, and radio properties for a subset of 227 Type 1 AGN. They report a positive correlation between tau_d and both MBH (Spearman rs = 0.35) and Lbol (rs = 0.40), weak positive correlations of sigma with MBH and Lbol, no significant dependence on X-ray photon index or X-ray variability, and weak anti-correlations with radio flux/loudness. These findings are interpreted as support for thermal accretion-disk emission as the primary driver of long-term optical variability.
Significance. If the correlations are robust, the result strengthens the interpretation of DRW damping timescales as disk thermal timescales and offers a useful comparison with the Burke et al. (2021) relation. The paper has several strengths: it uses a hard X-ray selected sample from the 105-month Swift/BAT catalog; it includes a control sample of passive galaxies from GAMA to check against PSF-induced variability; it describes DRW recovery simulations (Appendix A); and it compares its MBH-tau_d relation with an external reference. The main physical claim, however, depends on the reliability of DRW timescales for light curves whose baselines are often shorter than 10*tau_d, a regime the authors themselves flag as yielding only upper limits. Because this censoring directly affects the two correlations that the abstract emphasizes, the significance of the paper is conditional on demonstrating that the correlations survive when censored data are treated properly.
major comments (3)
- [§4.2 and Appendix A] The paper states that for light-curve lengths shorter than 10*tau_d, the derived tau_d 'should be considered as upper limits.' With a ZTF baseline of ~5 yr (~1800 d) and median Type 1 tau_d ≈ 295 d, the baseline is only ~6*tau_d for the median source, so a large fraction of the 227 sources are in the flagged unreliable regime. Yet Table 2 uses these tau_d values as exact point estimates in Spearman rank correlations, and the central MBH-tau_d (rs=0.35) and Lbol-tau_d (rs=0.40) claims rely on this. The Appendix A simulation tests only a single input tau_d=300 d and baselines up to 3000 d; it does not test sources with tau_d > 300 d, where baseline < 10*tau_d and the fitted value is likely censored at the baseline scale. This can bias the correlations, especially if longer-true-tau_d sources (often more massive/luminous) are systematically more censored. The authors should either repeat th
- [Table 2] The Spearman coefficients are reported without any uncertainty (e.g., bootstrap confidence intervals), and the p-values assume the tau_d and sigma values are exact and independent. The DRW parameter uncertainties are not propagated into the correlation analysis. Given that tau_d for many sources is an upper limit and that the coefficients are modest (rs < 0.4), the statistical evidence is weaker than the p-values alone suggest. The authors should provide bootstrap or posterior-based confidence intervals, and ideally a null-hypothesis test that accounts for measurement uncertainties.
- [§4.1–§4.2] The sample selection entering the primary correlations is not fully transparent. The paper says 'out of 528 sources, we are left with 303 sources' after discussing Type 2 AGN, but Table 1 implies 338 Type 1 sources (528 − 190). The reduction from 338 to 303 is not explained. More importantly, the decision to exclude Type 2 AGN because their DRW timescales are 'unphysical' means the correlations are established only for unabsorbed Type 1 sources; the abstract's generalization to 'AGN' overstates the scope. The authors should clarify the selection steps and state more carefully that the conclusions apply to unobscured Type 1 AGN.
minor comments (5)
- [Table 2] Typo: 'Spearmann' should be 'Spearman'.
- [References] The reference list contains two 'Kozlowski 2016' entries (ApJ 826, 118 and MNRAS 459, 2787) with identical author/year; these should be distinguished as 2016a/2016b or merged if they are the same work.
- [Appendix A, Figure A1] The caption repeats '1-day Cadence' twice; the legend is confusing because the panels are labeled '1-day Cadence', '3-day Cadence', '10-day Cadence', and 'Seasonal Cadence', but the bottom-left panel label appears twice. Please correct.
- [§4.2, last paragraph] The sentence 'and is consistent with the recently obtained results' appears incomplete; specific citations or a description of the comparison would improve clarity.
- [Figure 6] The red line from Burke et al. (2021) is plotted but the relation is not given in the text or caption; readers cannot assess the normalization and slope. Please state the relation explicitly.
Circularity Check
No significant circularity: the paper reports direct empirical correlations between DRW-fitted variability parameters and external physical properties; no derivation reduces to its own inputs.
full rationale
This is an observational correlation study, not a derivation. The DRW parameters (tau_d, sigma) are fit to ZTF light curves with Celerite, while MBH, Lbol, and Eddington ratio are taken from the external BASS-DR2 catalog (Koss et al. 2022). The central correlations (tau_d vs MBH, rs=0.35; tau_d vs Lbol, rs=0.40) are computed directly from these independently obtained quantities, so they are not forced by construction: nothing in the DRW fit uses MBH or Lbol as input, and no equation defines tau_d in terms of the correlated physical parameters. The paper explicitly compares its MBH–tau_d results to the external Burke et al. (2021) relation, providing an external benchmark. The self-citations (Jha et al. 2022, Ojha et al. 2022) are ordinary literature mentions and are not load-bearing. The paper's own caveat that tau_d values for light curves shorter than 10*tau_d should be treated as upper limits (Section 4.2) is a data-quality/statistical limitation that could affect the reliability of the correlations, but it is not a circularity: using uncertain or censored measured values as data points is not equivalent to defining the result from its inputs. Similarly, the simulation in Appendix A only tests recovery for a single true tau_d=300 days, which is a validity concern, not a circular-reasoning concern. No step in the paper reduces a claimed prediction to a fitted parameter renamed as a prediction, and no uniqueness or ansatz is imported from the authors' own prior work. The central claim—thermal disk emission governing long-term optical variability—is an interpretation of the observed correlations, not a tautology derived from the definitions of the fitted parameters.
Assumptions & free parameters
free parameters (2)
- DRW damping timescale tau_d per source =
median ~295 days for Type 1, ~24.5 days for Type 2
- DRW variability amplitude sigma per source =
median log sigma = -1.05 (Type 1), -1.87 (Type 2)
assumptions (3)
- domain assumption DRW is an adequate stochastic model for AGN optical variability
- domain assumption The damping timescale tau_d corresponds to the thermal timescale of the accretion disk
- domain assumption The Swift BAT 105-month selected AGN and the BASS-DR2 physical parameters are representative and correctly cross-matched
Cite this review
Pith. "Pith review of Exploring the Origins of Optical Variability in AGNs: Correlations with Black Hole Properties, X-ray, and Radio Emission." pith.science (2026). https://pith.science/paper/DUDATE57
@misc{pith2026250806610,
  author       = {Pith},
  title        = {Pith review of: Exploring the Origins of Optical Variability in AGNs: Correlations with Black Hole Properties, X-ray, and Radio Emission},
  year         = {2026},
  howpublished = {\url{https://pith.science/paper/DUDATE57}},
  note         = {Machine review of arXiv:2508.06610}
}
read the original abstract
We study the optical variability characteristics of Active Galactic Nuclei (AGN) from the Swift Burst Alert Telescope (BAT) AGN catalogue by utilising approximately five years of optical light curves from the Zwicky Transient Facility (ZTF) survey. We investigate dependencies of the long-term optical variability amplitudes and timescales on (i) supermassive black hole (SMBH) mass, luminosity, and Eddington ratio to explore the influence of accretion disk dynamics and radiative processes; (ii) X-ray properties, such as spectral photon indices and fluxes, to study the effect of high-energy emission mechanisms; and (iii) radio characteristics, such as integrated fluxes and radio loudness, which indicate jet activity. Our findings confirm a positive correlation between the variability time scale and both the SMBH mass and luminosity, suggesting that these physical parameters significantly impact the optical variability timescale. Conversely, no significant dependence is found between optical variability and X-ray properties, indicating that high-energy processes may not substantially influence long-term optical variability. Additionally, a weak anti-correlation between optical variability and radio parameters suggests that jet activity has a negligible effect on causing long-term AGN variability. These results support the hypothesis that long-term optical variability in AGN is primarily governed by thermal emission from the accretion disk. Further investigations with larger samples are essential to refine these correlations and develop robust physical models integrating black hole properties, accretion disk physics, and multi-wavelength radiative transfer.
Figures


Figures from the paper (6 more)




Reference graph
Works this paper leans on
-
[1]
Ai, Y. L., Yuan, W., Zhou, H. Y., et al. 2010, ApJL, 716, L31, doi: 10.1088/2041-8205/716/1/L31
-
[3]
Becker, R. H., White, R. L., & Helfand, D. J. 1995, ApJ, 450, 559, doi: 10.1086/176166
doi:10.1086/176166 1995
-
[4]
Bellm, E. C., Kulkarni, S. R., Graham, M. J., et al. 2019, PASP, 131, 018002, doi: 10.1088/1538-3873/aaecbe
- [5]
-
[7]
J., Shen, Y., Blaes, O., et al
Burke, C. J., Shen, Y., Blaes, O., et al. 2021, Science, 373, 789, doi: 10.1126/science.abg9933 13 2 3 1-day Cadence True Value 5% T olerance 1-day Cadence 3-day Cadence 500 1000 1500 2000 2500 3000 2 3 10-day Cadence 500 1000 1500 2000 2500 3000 Seasonal Cadence Baseline (days) log10 ( ) Recovered DRW Timescales vs. Baseline by Cadence Figure A1. We perf...
-
[8]
Butler, N. R., & Bloom, J. S. 2011, AJ, 141, 93, doi: 10.1088/0004-6256/141/3/93
-
[9]
Chen, B.-Y., Bower, G. C., Dexter, J., et al. 2023, ApJ, 951, 93, doi: 10.3847/1538-4357/acd250
-
[10]
Clements, S. D., Smith, A. G., Aller, H. D., & Aller, M. F. 1995, AJ, 110, 529, doi: 10.1086/117540 De Cicco, D., Bauer, F. E., Paolillo, M., et al. 2022, A&A, 664, A117, doi: 10.1051/0004-6361/202142750
Show all 61 references
-
[11]
M., Horne, K., et al
Edelson, R., Gelbord, J. M., Horne, K., et al. 2015, ApJ, 806, 129, doi: 10.1088/0004-637X/806/1/129
2015 doi
-
[12]
J., McDowell, J
Elvis, M., Wilkes, B. J., McDowell, J. C., et al. 1994, ApJS, 95, 1, doi: 10.1086/192093
1994 doi
- [13]
-
[14]
J., & Wang, S
Guo, H., Barth, A. J., & Wang, S. 2022, ApJ, 940, 20, doi: 10.3847/1538-4357/ac96ec
2022 doi
-
[15]
1991, ApJL, 380, L51, doi: 10.1086/186171
Haardt, F., & Maraschi, L. 1991, ApJL, 380, L51, doi: 10.1086/186171
1991 doi
-
[16]
2024, MNRAS, 530, 4850, doi: 10.1093/mnras/stae1177
Hagen, S., Done, C., & Edelson, R. 2024, MNRAS, 530, 4850, doi: 10.1093/mnras/stae1177
2024 doi
-
[17]
Hawkins, M. R. S. 2002, MNRAS, 329, 76, doi: 10.1046/j.1365-8711.2002.04939.x
2002
-
[18]
K., Joshi, R., Chand, H., et al
Jha, V. K., Joshi, R., Chand, H., et al. 2022, MNRAS, 511, 3005, doi: 10.1093/mnras/stac109
2022 doi
-
[19]
2018, ApJ, 868, 58, doi: 10.3847/1538-4357/aae6c4
Kang, W.-y., Wang, J.-X., Cai, Z.-Y., et al. 2018, ApJ, 868, 58, doi: 10.3847/1538-4357/aae6c4
2018 doi
-
[20]
2021, ApJ, 911, 148, doi: 10.3847/1538-4357/abeb69
Kang, W.-Y., Wang, J.-X., Cai, Z.-Y., & Ren, W.-K. 2021, ApJ, 911, 148, doi: 10.3847/1538-4357/abeb69
2021 doi
-
[21]
2025, A&A, 693, A319, doi: 10.1051/0004-6361/202450562
Kankkunen, S., Tornikoski, M., & Hovatta, T. 2025, A&A, 693, A319, doi: 10.1051/0004-6361/202450562
2025 doi
-
[22]
I., Sramek, R
Kellermann, K. I., Sramek, R. A., Schmidt, M., Green, R. F., & Shaffer, D. B. 1994, AJ, 108, 1163, doi: 10.1086/117145
1994 doi
-
[23]
C., Bechtold, J., & Siemiginowska, A
Kelly, B. C., Bechtold, J., & Siemiginowska, A. 2009, The Astrophysical Journal, 698, 895, doi: 10.1088/0004-637X/698/1/895
2009 doi
-
[24]
J., Ricci, C., Trakhtenbrot, B., et al
Koss, M. J., Ricci, C., Trakhtenbrot, B., et al. 2022, ApJS, 261, 2, doi: 10.3847/1538-4365/ac6c05 Koz lowski, S. 2016, ApJ, 826, 118, doi: 10.3847/0004-637X/826/2/118 Koz lowski, S. 2016, Monthly Notices of the Royal Astronomical Society, 459, 2787, doi: 10.1093/mnras/stw819 ...
2022 doi
-
[25]
2008, MNRAS, 387, L41, doi: 10.1111/j.1745-3933.2008.00480.x
Li, S.-L., & Cao, X. 2008, MNRAS, 387, L41, doi: 10.1111/j.1745-3933.2008.00480.x
2008
-
[26]
2022, MNRAS, 512, 296, doi: 10.1093/mnras/stac266
Liao, M., Wang, J., Kang, W., & Zhou, M. 2022, MNRAS, 512, 296, doi: 10.1093/mnras/stac266
2022 doi
-
[27]
K., Driver, S
Liske, J., Baldry, I. K., Driver, S. P., et al. 2015, MNRAS, 452, 2087, doi: 10.1093/mnras/stv1436
2015 doi
-
[28]
2020, ApJ, 896, 122, doi: 10.3847/1538-4357/ab952d L´ opez-Navas, E., Ar´ evalo, P., Bernal, S., et al
Liu, T., Koss, M., Blecha, L., et al. 2020, ApJ, 896, 122, doi: 10.3847/1538-4357/ab952d L´ opez-Navas, E., Ar´ evalo, P., Bernal, S., et al. 2023, MNRAS, 518, 1531, doi: 10.1093/mnras/stac3174 15
2020 doi
-
[29]
2019, ApJ, 887, 135, doi: 10.3847/1538-4357/ab5790
Lu, K.-X., Bai, J.-M., Zhang, Z.-X., et al. 2019, ApJ, 887, 135, doi: 10.3847/1538-4357/ab5790
2019 doi
-
[30]
Lyubarskii, Y. E. 1997, MNRAS, 292, 679, doi: 10.1093/mnras/292.3.679
1997 doi
-
[31]
L., Ivezi´ c,ˇZ., Kochanek, C
MacLeod, C. L., Ivezi´ c,ˇZ., Kochanek, C. S., et al. 2010, The Astrophysical Journal, 721, 1014, doi: 10.1088/0004-637X/721/2/1014
2010 doi
-
[32]
2003, ApJ, 593, 96, doi: 10.1086/375330
Markowitz, A., Edelson, R., Vaughan, S., et al. 2003, ApJ, 593, 96, doi: 10.1086/375330
2003 doi
-
[33]
Fender, R. P. 2006, Nature, 444, 730, doi: 10.1038/nature05389
2006 doi
-
[34]
2014, MNRAS, 437, 3550, doi: 10.1093/mnras/stt2149
Merloni, A., Bongiorno, A., Brusa, M., et al. 2014, MNRAS, 437, 3550, doi: 10.1093/mnras/stt2149
2014 doi
-
[35]
F., Done, C., & Pounds, K
Mushotzky, R. F., Done, C., & Pounds, K. A. 1993, ARA&A, 31, 717, doi: 10.1146/annurev.aa.31.090193. 00344110.1146/annurev.astro.31.1.717 Nied´ zwiecki, A., Zdziarski, A. A., & Szanecki, M. 2016, ApJL, 821, L1, doi: 10.3847/2041-8205/821/1/L1
1993
-
[36]
K., Chand, H., & Singh, V
Ojha, V., Jha, V. K., Chand, H., & Singh, V. 2022, MNRAS, 514, 5607, doi: 10.1093/mnras/stac1627
2022 doi
-
[37]
D., Laor, A., et al
Panessa, F., Baldi, R. D., Laor, A., et al. 2019, Nature Astronomy, 3, 387, doi: 10.1038/s41550-019-0765-4
2019 doi
-
[38]
E., & Binas-Valavanis, V
Papadakis, I. E., & Binas-Valavanis, V. 2024, A&A, 685, A50, doi: 10.1051/0004-6361/202347995
2024 doi
-
[39]
A., Sazonov, S
Prokhorenko, S. A., Sazonov, S. Y., Gilfanov, M. R., et al. 2024, MNRAS, 528, 5972, doi: 10.1093/mnras/stae261
2024 doi
-
[40]
2024, ApJ, 975, 160, doi: 10.3847/1538-4357/ad7b2a S´ anchez-S´ aez, P., Lira, P., Mej ´ ıa-Restrepo, J., et al
Ren, G., Zhou, S., Sun, M., & Xue, Y. 2024, ApJ, 975, 160, doi: 10.3847/1538-4357/ad7b2a S´ anchez-S´ aez, P., Lira, P., Mej ´ ıa-Restrepo, J., et al. 2018, ApJ, 864, 87, doi: 10.3847/1538-4357/aad7f9 S´ anchez-S´ aez, P., Lira, P., Cartier, R., et al. 2019, ApJS, 242, 10, doi...
2024 doi
-
[41]
J., Prieto, J
Shappee, B. J., Prieto, J. L., Grupe, D., et al. 2014, ApJ, 788, 48, doi: 10.1088/0004-637X/788/1/48
2014 doi
-
[42]
2016, A&A, 585, A129, doi: 10.1051/0004-6361/201527353
Simm, T., Salvato, M., Saglia, R., et al. 2016, A&A, 585, A129, doi: 10.1051/0004-6361/201527353
2016 doi
-
[43]
A., & Papadakis, I
Sobolewska, M. A., & Papadakis, I. E. 2009, MNRAS, 399, 1597, doi: 10.1111/j.1365-2966.2009.15382.x
2009
-
[44]
H., et al
Soldi, S., Beckmann, V., Baumgartner, W. H., et al. 2014, A&A, 563, A57, doi: 10.1051/0004-6361/201322653
2014 doi
-
[45]
J., et al
Stone, Z., Shen, Y., Burke, C. J., et al. 2022, MNRAS, 514, 164, doi: 10.1093/mnras/stac1259
2022 doi
-
[46]
L., Ivezi´ c,ˇZ., & MacLeod, C
Suberlak, K. L., Ivezi´ c,ˇZ., & MacLeod, C. 2021, ApJ, 907, 96, doi: 10.3847/1538-4357/abc698
2021 doi
-
[47]
2018, ApJ, 866, 74, doi: 10.3847/1538-4357/aae208
Sun, M., Xue, Y., Wang, J., Cai, Z., & Guo, H. 2018, ApJ, 866, 74, doi: 10.3847/1538-4357/aae208
2018 doi
-
[48]
N., et al
Sun, M., Xue, Y., Brandt, W. N., et al. 2020, ApJ, 891, 178, doi: 10.3847/1538-4357/ab789e
2020 doi
-
[49]
J., Kawai, N., et al
Tachibana, Y., Graham, M. J., Kawai, N., et al. 2020, ApJ, 903, 54, doi: 10.3847/1538-4357/abb9a9
2020 doi
-
[50]
2023, Nature Astronomy, 7, 473, doi: 10.1038/s41550-022-01885-8
Tang, J.-J., Wolf, C., & Tonry, J. 2023, Nature Astronomy, 7, 473, doi: 10.1038/s41550-022-01885-8
2023 doi
-
[51]
1994, A&A, 289, 673
Tornikoski, M., Valtaoja, E., Terasranta, H., et al. 1994, A&A, 289, 673
1994
-
[52]
2023, MNRAS, 526, 1687, doi: 10.1093/mnras/stad2775
Tortosa, A., Ricci, C., Ar´ evalo, P., et al. 2023, MNRAS, 526, 1687, doi: 10.1093/mnras/stad2775
2023 doi
-
[53]
J., et al
Trakhtenbrot, B., Ricci, C., Koss, M. J., et al. 2017, MNRAS, 470, 800, doi: 10.1093/mnras/stx1117
2017 doi
-
[54]
Ulrich, M.-H., Maraschi, L., & Urry, C. M. 1997, ARA&A, 35, 445, doi: 10.1146/annurev.astro.35.1.445
1997 doi
-
[55]
S., Johnston, K
Ulvestad, J. S., Johnston, K. J., & Weiler, K. W. 1983, ApJ, 266, 18, doi: 10.1086/160755
1983 doi
-
[56]
2003, ApJL, 584, L53, doi: 10.1086/373887 Vanden Berk, D
Markowitz, A. 2003, ApJL, 584, L53, doi: 10.1086/373887 Vanden Berk, D. E., Wilhite, B. C., Kron, R. G., et al. 2004, ApJ, 601, 692, doi: 10.1086/380563
2003 doi
-
[57]
S., & Uttley, P
Vaughan, S., Edelson, R., Warwick, R. S., & Uttley, P. 2003, MNRAS, 345, 1271, doi: 10.1046/j.1365-2966.2003.07042.x
2003
-
[58]
2023, Ap&SS, 368, 68, doi: 10.1007/s10509-023-04226-x
Wang, H., Guo, C., Cao, H., et al. 2023, Ap&SS, 368, 68, doi: 10.1007/s10509-023-04226-x
2023 doi
-
[59]
2009, ApJ, 690, 1322, doi: 10.1088/0004-637X/690/2/1322
Tueller, J. 2009, ApJ, 690, 1322, doi: 10.1088/0004-637X/690/2/1322
2009 doi
-
[60]
2020, MNRAS, 495, 1403, doi: 10.1093/mnras/staa1258
Xin, C., Charisi, M., Haiman, Z., & Schiminovich, D. 2020, MNRAS, 495, 1403, doi: 10.1093/mnras/staa1258
2020 doi
-
[61]
Graham, M. J. 2022, ApJ, 936, 132, doi: 10.3847/1538-4357/ac8351
2022 doi
-
[62]
S., Koz lowski, S., & Peterson, B
Zu, Y., Kochanek, C. S., Koz lowski, S., & Peterson, B. M. 2016, The Astrophysical Journal, 819, 122, doi: 10.3847/0004-637X/819/2/122
2016 doi
-
[63]
S., & Peterson, B
Zu, Y., Kochanek, C. S., & Peterson, B. M. 2011, The Astrophysical Journal, 735, 80, doi: 10.1088/0004-637X/735/2/80
2011 doi
Reviewed August 5, 2026 · model on record in the stance chip above.
Discussion (0). Continue with ORCID to comment.