REVIEW 2 major objections 5 minor 33 references
Beyond p-values: a phase II dual-criterion design with statistical significance and clinical relevance
T0 review · 2 major / 5 minor · reviewed 2026-08-14 · deepseek-v4-flash
Pith's one-line read Phase II success should require both a significant p-value and an effect estimate that passes a clinically chosen threshold.
desk verdict A clear, practical dual-criterion phase II design paper whose central logic is sound, but the printed sample size formula omits the log transform for time-to-event endpoints, so implementers will compute 73 events instead of the reported 52. read the letter →
The pith
A machine-rendered reading of the paper's core claim, the machinery that carries it, and where it could break.
The reading
What carries the argument
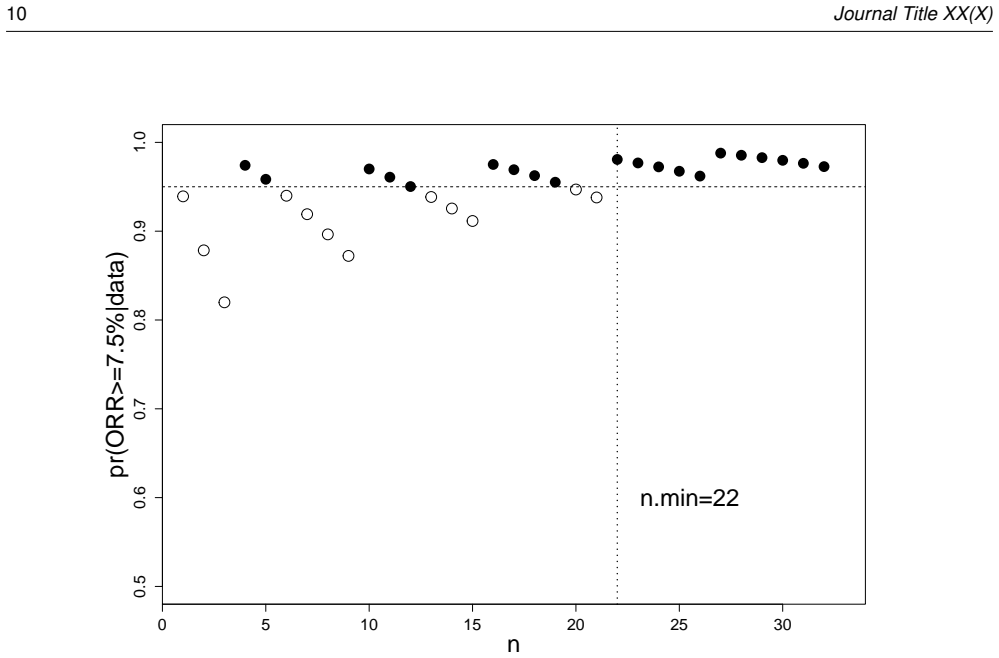
The carrying object is the dual criterion itself, together with the sample-size floor that makes it operative: the smallest $n$ at which a significant test result and an estimate at the decision value coincide. The formula $n_{\min} = \sigma^2 z_\alpha^2 / (NV - DV)^2$ converts the two benchmarks into a required number of events or patients; for non-normal endpoints a grid search over $n$ plays the same role. The Bayesian version replaces the p-value with a posterior probability and the point estimate with the posterior median, and the paper uses a minimally informative Beta prior in its single-arm example.
What would settle it
A reader can check the formula by plugging in the paper's Example 1 values: with $NV=1$, $DV=0.7$, $\sigma=2$, and $\alpha=0.1$, the published formula gives roughly 73 events, whereas the paper reports 52; the reported 52 only appears when the denominator uses $\log(1)-\log(0.7)$. That discrepancy would falsify the formula as printed.
Extended reading notes
Core claim
The paper claims that a phase II success criterion should be the conjunction of two conditions rather than a single p-value threshold: the one-sided p-value must fall below $\alpha$ (or, Bayesianly, the posterior probability that the effect exceeds the null value must exceed $1-\alpha$), and the effect estimate must reach a pre-specified clinical decision value. With both criteria met the decision is GO; with neither, NO-GO; with one of the two, the outcome is inconclusive. The paper shows that this design preserves type-I error control, makes the clinically relevant effect an explicit design input, and has a sample size floor $n_{\min} = \sigma^2 z_\alpha^2 / (NV - DV)^2$ below which the clinical criterion cannot be met whenever significance holds. It also establishes that power at the decision value is about 50% and is not changed by increasing the sample size.
Load-bearing premise
The load-bearing assumption is that the effect estimate follows a normal distribution with known variance, and for the time-to-event example that the null and decision values enter the formula as log hazard ratios; the paper does not state the log transform, and without it the formula yields the wrong sample size.
Editorial extensions
If this is right
- A dual-criterion design makes the clinical threshold a design input, so the protocol states the smallest effect estimate that justifies GO.
- Because power at the decision value is about 50%, sample size increases only shift power for effects above the decision value; effects below it remain clinically irrelevant.
- Planning with the minimum sample size avoids inconclusive outcomes entirely, while planning above it can produce significant-but-clinically-irrelevant results that need further judgment.
- In the Bayesian version, a weak prior gives operating characteristics close to the frequentist design, but the posterior probability and p-value retain distinct evidential meanings.
- The same dual-criterion logic is transferable to non-inferiority trials, bridging, dose-finding, and interim futility decisions.
Reading between the lines
- If the same criterion were applied in confirmatory trials, a significant but small effect would fail the clinical gate, formally preventing 'significant but trivial' phase III results; the paper only raises this as a possibility.
- The formula can be inverted as a calibration rule: to achieve a target power at a desired effect, set the decision value below that effect and compute $n$; this inversion is not given in the paper.
- Reported dual-criterion operating characteristics could be audited by checking that the implied estimate threshold equals the stated decision value at the minimum sample size, a consistency test readers can run from the paper's tables.
Signed reviews
Editorial analysis
A structured set of objections, weighed in public.
Referee Report
Summary. The manuscript proposes a dual-criterion design for phase II proof-of-concept trials in which a GO decision requires both statistical significance and a clinically relevant effect estimate. The frequentist version requires a one-sided p-value below alpha and an estimate at least as favorable as a pre-specified decision value (DV); the Bayesian version requires a posterior probability above 1−alpha and a posterior median reaching the DV. The paper derives the minimum sample size needed for the estimate at the DV to imply significance, discusses operating characteristics including the 50% power-at-DV property, and presents two worked examples: a randomized time-to-event trial analyzed frequentist and a single-arm binary trial analyzed Bayesian, with comparisons to randomized screening designs and three-outcome designs.
Significance. The paper addresses a real and recurring practical problem: statistical significance alone is often insufficient for phase II GO/NO-GO decisions. Its main contribution is conceptual clarity: making the clinically relevant effect threshold an explicit design input and showing how the resulting operating characteristics differ from standard designs. If the two issues identified below are corrected, the manuscript would be a useful, accessible methods note for clinical statisticians. The example tables are informative, the comparison with alternative designs is helpful, and the distinction between the decision value and the alternative hypothesis is well explained. The work does not require heavy machinery, and its value lies in transparent communication rather than theoretical novelty.
major comments (2)
- [Sample size section and Example 1] The sample-size formula is stated for NV and DV as if they were on the natural effect scale, but the time-to-event example requires them to be on the log-hazard-ratio scale. With alpha=0.1, sigma=2, NV=1, DV=0.7, the printed expression gives sigma^2 z_alpha^2/(NV-DV)^2 = 4 x 1.2816^2 / 0.3^2 = 73 events, whereas the paper reports nmin=52. The reported value is obtained only if the denominator is (log(1)-log(0.7))^2, i.e. the null and decision values are log hazard ratios. The text mentions 'approximate normality of the log-hazard-ratio' but never states that NV and DV in the formula must be transformed accordingly. Because nmin is the central design output and directly determines the planned type-I error and power, this is a load-bearing omission. Please restate the formula in terms of the transformed parameter, for example theta = log(HR) with NV* = log(NV) and DV* = log(DV).
- [A randomized PoC design with time-to-event data, Table 3] In the discussion of Example 1 (design 1, n=70), the text says 'The type-I error is 0.032'. Table 3 reports for true HR=1.0: GO=0.068, NO-GO=0.900, inconclusive=0.032. The probability of a GO under the null is 0.068, not 0.032; 0.032 is the probability of the inconclusive outcome (significant p-value but HR estimate above the DV). Since type-I error control is one of the paper's central claims, this number must be corrected (to 0.068) or the definition must be clarified explicitly. The same table also shows P(significant | HR=1) = GO+inconclusive = 0.100, so if the authors intend to report the probability of any significant result, that should be stated.
minor comments (5)
- [Operating characteristics section] The word 'Notingly' should be 'Notably'.
- [Final analysis section] The word 'ploting' should be 'plotting'.
- [Table 3] In design 1, the intervals defining GO, NO-GO, and inconclusive should be given explicitly (for example, GO: theta-hat <= 0.7, inconclusive: 0.7 < theta-hat <= 0.736, NO-GO: theta-hat > 0.736); readers currently have to infer the interval boundaries from the text.
- [Sample size section] The sample-size formula would benefit from an equation number and a one-line definition of whether higher or lower values are favorable, to avoid sign confusion.
- [Single-arm PoC design with binary data] Describing Beta(0.0811,1) as 'unimodal' is debatable because this density is monotone decreasing on (0,1); consider calling it 'J-shaped' or 'boundary-mode'.
Circularity Check
No circularity: the dual-criterion design is a self-contained construction; sample sizes and operating characteristics follow from the stated decision rule.
full rationale
The paper makes no empirical prediction whose outcome is fed back into the design. Its central objects are pre-specified inputs (alpha, null value, decision value) and mathematical consequences of the stated testing framework. The sample-size formula n_min = sigma^2 z_alpha^2 / (NV - DV)^2 is a rearrangement of the one-sided normal-test rejection boundary: it is the smallest n such that an estimate equal to DV yields a p-value below alpha. The 50% power at the decision value follows directly from centering the sampling distribution at DV, not from fitting. The GO/NO-GO/inconclusive probabilities in Tables 3 and 4 are evaluations of the stated dual-criterion under the stated sampling models, not fitted outputs. The only self-citations (Neuenschwander et al. 2011; Gsponer et al. 2014) appear as examples of other settings and are not load-bearing for the dual-criterion construction. The possible numerical mismatch in Example 1 (52 events reported, 73 if the log-hazard-ratio transform is omitted from the printed formula) concerns the correctness and scale of an illustrative calculation, not circularity: the formula is not derived from the example's reported n_min. Accordingly, no circular step is exhibited.
Assumptions & free parameters
assumptions (3)
- standard math Approximate normality of the log hazard ratio for time-to-event data, with sigma=2 under equal randomization.
- domain assumption The Beta(0.0811,1) prior has mean 0.075 and is treated as minimally informative.
- domain assumption Clinical decision values (HR=0.7, ORR=17.5%) are elicited from clinical experts and assumed fixed.
Cite this review
Pith. "Pith review of Beyond p-values: a phase II dual-criterion design with statistical significance and clinical relevance." pith.science (2026). https://pith.science/paper/EAZJ6FWV
@misc{pith2026190807751,
  author       = {Pith},
  title        = {Pith review of: Beyond p-values: a phase II dual-criterion design with statistical significance and clinical relevance},
  year         = {2026},
  howpublished = {\url{https://pith.science/paper/EAZJ6FWV}},
  note         = {Machine review of arXiv:1908.07751}
}
read the original abstract
Background: Well-designed phase II trials must have acceptable error rates relative to a pre-specified success criterion, usually a statistically significant p-value. Such standard designs may not always suffice from a clinical perspective because clinical relevance may call for more. For example, proof-of-concept in phase II often requires not only statistical significance but also a sufficiently large effect estimate. Purpose: We propose dual-criterion designs to complement statistical significance with clinical relevance, discuss their methodology, and illustrate their implementation in phase II. Methods: Clinical relevance requires the effect estimate to pass a clinically motivated threshold (the decision value). In contrast to standard designs, the required effect estimate is an explicit design input whereas study power is implicit. The sample size for a dual-criterion design needs careful considerations of the study's operating characteristics (type-I error, power). Results: Dual-criterion designs are discussed for a randomized controlled and a single-arm phase II trial, including decision criteria, sample size calculations, decisions under various data scenarios, and operating characteristics. The designs facilitate GO/NO-GO decisions due to their complementary statistical-clinical criterion. Conclusion: To improve evidence-based decision-making, a formal yet transparent quantitative framework is important. Dual-criterion designs offer an appealing statistical-clinical compromise, which may be preferable to standard designs if evidence against the null hypothesis alone does not suffice for an efficacy claim.
Figures

Reference graph
Works this paper leans on
-
[1]
The ASA’s statement on p-values: Context, process, and purpose
Wasserstein R and Lazar N. The ASA’s statement on p-values: Context, process, and purpose. The American Statistician 2016; 70(2): 129–133
work page 2016
-
[2]
One-sample multiple testing procedure for phase II clinical trials
Fleming T. One-sample multiple testing procedure for phase II clinical trials. Biometrics 1982; 38(1): 143–151
work page 1982
-
[3]
Calibrated phase II clinical trials in oncology
Herson J and Carter S. Calibrated phase II clinical trials in oncology. Statistics in Medicine 1986; 5(5): 441–447
work page 1986
-
[4]
Optimal two-stage designs for phase II clinical trials
Simon R. Optimal two-stage designs for phase II clinical trials. Control Clin Trials 1989; 10(1): 1–10
work page 1989
-
[5]
Optimal two-stage screening designs for survival comparisons
Schaid D, Wieand S and Therneau T. Optimal two-stage screening designs for survival comparisons. Biometrika 1990; 77(3): 507–513. Prepared using sagej.cls Roychoudhury et al. 7
work page 1990
-
[6]
A class of phase II designs with three possible outcomes
Storer B. A class of phase II designs with three possible outcomes. Biometrics 1992; 48(1): 55–60
work page 1992
-
[7]
Selection designs for pilot studies based on survival
Liu P, Dahlberg S and Crowley J. Selection designs for pilot studies based on survival. Biometrics 1993; 49(2): 391–398
work page 1993
-
[8]
False positive rates of randomized phase II designs
Liu P, LeBlanc M and Desai M. False positive rates of randomized phase II designs. Control Clin Trials1999; 20(4): 343–352
Show all 33 references
-
[9]
A three-outcome design for phase II clinical trials
Sargent D, Chan V and Goldberg R. A three-outcome design for phase II clinical trials. Controlled Clinical Trials 2001; 22(2): 117 – 125
2001
-
[10]
Clinical trial designs for cytostatic agents: Are new approaches needed? Journal of Clinical Oncology 2001; 19(1): 265–272
Korn E, Arbuck S, Pluda J et al. Clinical trial designs for cytostatic agents: Are new approaches needed? Journal of Clinical Oncology 2001; 19(1): 265–272
2001
-
[11]
Design issues of randomized phase ii trials and a proposal for phase II screening trials
Rubinstein L, Korn E, Freidlin B et al. Design issues of randomized phase ii trials and a proposal for phase II screening trials. Journal of Clinical Oncology 2005; 23(28): 7199–7206
2005
-
[12]
Clinical trial designs for the early clinical development of therapeutic cancer vaccines
Simon R, Steinberg S, Hamilton M et al. Clinical trial designs for the early clinical development of therapeutic cancer vaccines. Journal of Clinical Oncology 2001; 19(6): 1848–1854
2001
-
[13]
An optimal stratified Simon two-stage design
Parashar D, Bowden J, Starr C et al. An optimal stratified Simon two-stage design. Pharmaceutical Statistics 2016; 15(4): 333–340
2016
-
[14]
Proof of concept: a PhRMA position paper with recommendations for best practice
Cartwright M, Cohen S, Fleishaker J et al. Proof of concept: a PhRMA position paper with recommendations for best practice. Clin Pharmacol Ther 2010; 87(3): 278–285
2010
-
[15]
A consonance criterion for choosing sample size
Nicewander W and Price J. A consonance criterion for choosing sample size. The American Statistician 1997; 51: 311–317
1997
-
[16]
The role of the minimum clinically important difference and its impact on designing a trial
Chuang-Stein C, Kirby S, Hirsch I et al. The role of the minimum clinically important difference and its impact on designing a trial. Pharmaceutical Statistics 2011; 10(3): 250– 256
2011
-
[17]
A quantitative approach for making GO/NO-GO decisions in drug develop- ment
Chuang-Stein C, Kirby s, French J et al. A quantitative approach for making GO/NO-GO decisions in drug develop- ment. Drug Information Journal 2011; 45(2): 187–202
2011
-
[18]
A proof of concept phase II non-inferiority criterion
Neuenschwander B, Rouyrre N, Hollaender N et al. A proof of concept phase II non-inferiority criterion. Statistics in Medicine 2011; 30(13): 1618–1627
2011
-
[19]
Bayesian design of proof-of- concept trials
Fisch R, Jones I, Jones J et al. Bayesian design of proof-of- concept trials. Therapeutic Innovation & Regulatory Science 2015; 49(1): 155–162
2015
-
[20]
Decision-making in early clinical drug development
Frewer P, Mitchell P, Watkins C et al. Decision-making in early clinical drug development. Pharmaceutical Statistics 2016; 15(3): 255–263
2016
-
[21]
Statistical issues in drug development
Senn S. Statistical issues in drug development . New York; Chichester: John Wiley & Sons, 1997
1997
-
[22]
Reconciling Bayesian and frequentist evidence in the one-sided testing problem (C/R: P123-135)
Casella G and Berger R. Reconciling Bayesian and frequentist evidence in the one-sided testing problem (C/R: P123-135). Journal of the American Statistical Association 1987; 82: 106–111
1987
-
[23]
Testing a point null hypothesis: The irreconcilability of P values and evidence (C/R: P123-133, 135-139, 1201-1201)
Berger J and Sellke T. Testing a point null hypothesis: The irreconcilability of P values and evidence (C/R: P123-133, 135-139, 1201-1201). Journal of the American Statistical Association 1987; 82: 112–122
1987
-
[24]
R: A Language and Environment for Statistical Computing
R Core,, Team,,. R: A Language and Environment for Statistical Computing . R Foundation for Statistical Computing, Vienna, Austria, 2015. URL https://www. R-project.org/
2015
-
[25]
A practical guide to bayesian group sequential designs
Gsponer T, Gerber F, Bornkamp B et al. A practical guide to bayesian group sequential designs. Pharmaceutical Statistics 2014; 13(1): 71–80. Prepared using sagej.cls 8 Journal Title XX(X) List of Figures 1 Operating characteristics of dual-criterion designs with 309 and 420 nu...
2014
-
[26]
dual-criterion design:α=0.1, DV=0.7, n=70 true HR GO: ˆθ≤ 0.7 NO-GO: ˆθ> 0.736 inconclusive 0.5 0.920 0.053 0.027 0.6 0.740 0.196 0.064 0.7 0.500 0.417 0.083 0.8 0.288 0.636 0.076 0.9 0.147 0.800 0.054 1.0 0.068 0.900 0.032
-
[27]
dual-criterion design:α = 0.1, DV=0.7, n=52 GO: ˆθ≤ 0.7 NO-GO: ˆθ> 0.7 inconclusive 0.5 0.887 0.113 — 0.6 0.711 0.289 — 0.7 0.500 0.500 — 0.8 0.315 0.685 — 0.9 0.182 0.818 — 1.0 0.099 0.901 —
-
[28]
standard design:α = 0.1,β = 0.1(θA = 0.5), n=55 GO: ˆθ≤ 0.708 NO-GO: ˆθ> 0.708 inconclusive 0.5 0.901 0.099 — 0.6 0.729 0.270 — 0.7 0.516 0.484 — 0.8 0.325 0.675 — 0.9 0.186 0.813 — 1.0 0.100 0.900 —
-
[29]
standard design:α = 0.1,β = 0.2(θA = 0.5), n=38 GO: ˆθ≤ 0.659 NO-GO: ˆθ> 0.659 inconclusive 0.5 0.804 0.196 — 0.6 0.615 0.385 — 0.7 0.428 0.572 — 0.8 0.276 0.724 — 0.9 0.169 0.831 — 1.0 0.100 0.900 —
-
[30]
Example 2: operating characteristics for dual-criterion and three-outcome designs; probabilities for GO, NO-GO and inconclusive decisions given by the number of responders (r)
standard design:α = 0.2,β = 0.1(θA = 0.5), n=38 GO: ˆθ≤ 0.761 NO-GO: ˆθ> 0.761 inconclusive 0.5 0.902 0.098 — 0.6 0.768 0.232 — 0.7 0.602 0.398 — 0.8 0.439 0.561 — 0.9 0.303 0.697 — 1.0 0.200 0.800 — Prepared using sagej.cls T ABLES 15 Table 4. Example 2: operating characteris...
-
[31]
dual-criterion design:α=0.05, DV=0.175, n=25 true ORR (%) GO: r≥ 5 NO-GO:r< 5 inconclusive 7.5 0.036 0.964 — 12.5 0.195 0.805 — 17.5 0.451 0.549 — 22.5 0.693 0.307 — 27.5 0.858 0.142 —
-
[32]
dual-criterion design:α=0.05, DV=0.175, n=36 GO:r≥ 7 NO-GO:r≤ 5 inconclusive:r = 6 7.5 0.016 0.950 0.033 12.5 0.156 0.709 0.135 17.5 0.446 0.380 0.174 22.5 0.731 0.149 0.121 27.5 0.902 0.044 0.054
-
[33]
three-outcome design: n=27 GO:r≥ 5 NO-GO:r≤ 3 inconclusive:r = 4 7.5 0.048 0.860 0.092 12.5 0.243 0.558 0.199 17.5 0.523 0.280 0.197 22.5 0.759 0.113 0.128 27.5 0.901 0.038 0.062 Prepared using sagej.cls
Reviewed August 14, 2026 · model on record in the stance chip above.
Discussion (0). Continue with ORCID to comment.