Building drag and shielding in a realistic urban environment
Pith reviewed 2026-06-28 17:49 UTC · model grok-4.3
The pith
Accounting for shielding by upstream buildings reduces directional variation in urban canopy drag.
A machine-rendered reading of the paper's core claim, the machinery that carries it, and where it could break.
Core claim
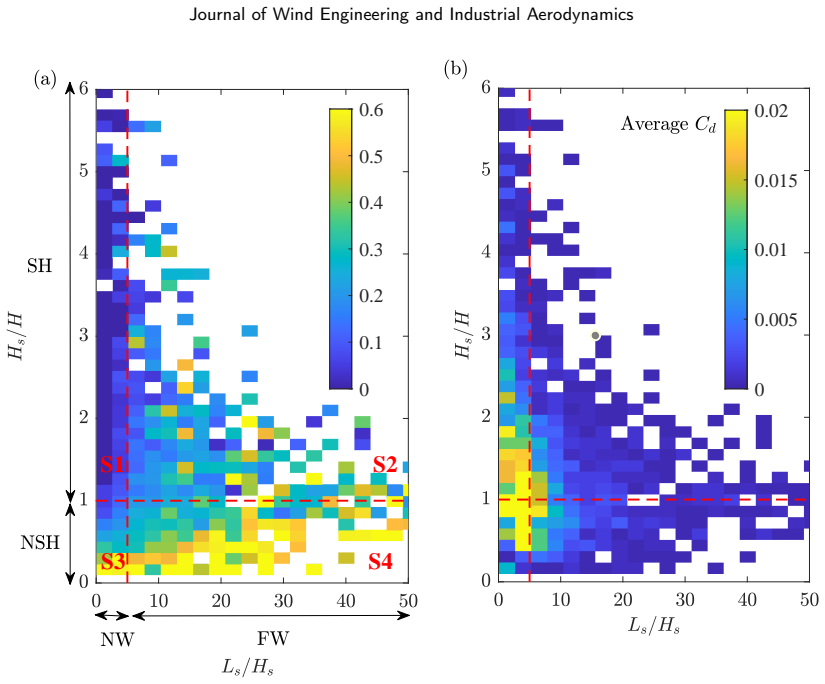
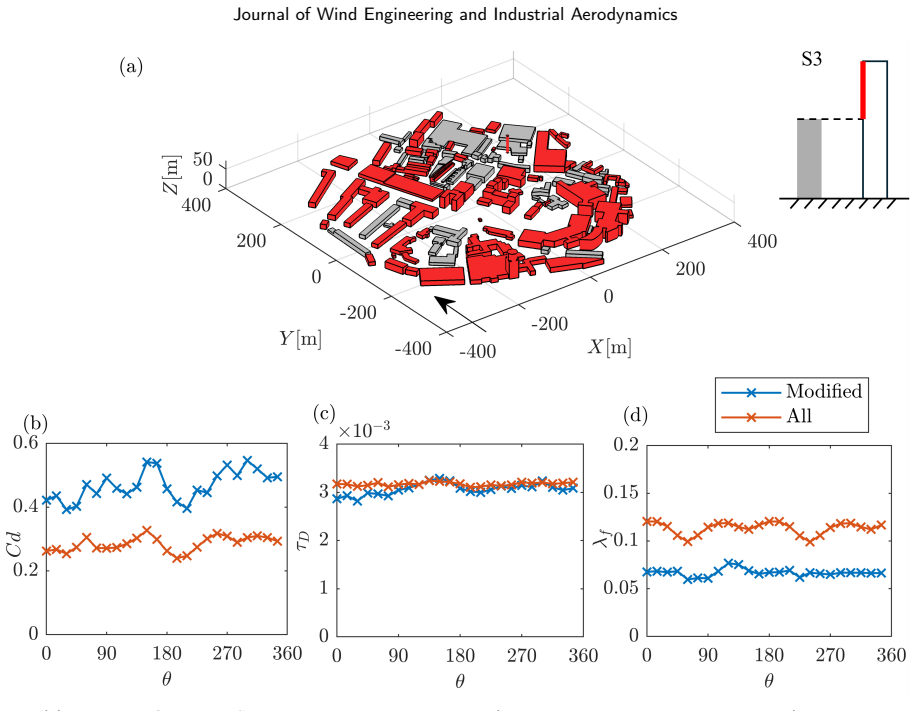
Classifying buildings by the ratios Ls/Hs and Hs/H into four regimes and then computing a modified drag coefficient by excluding shielded buildings reduces directional anisotropy and yields an effective frontal area more consistent across wind directions.
What carries the argument
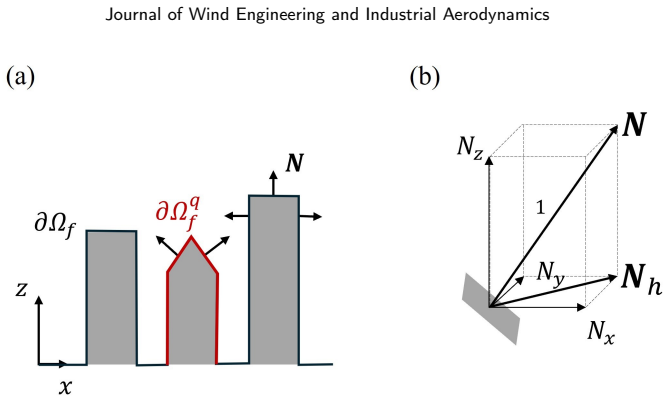
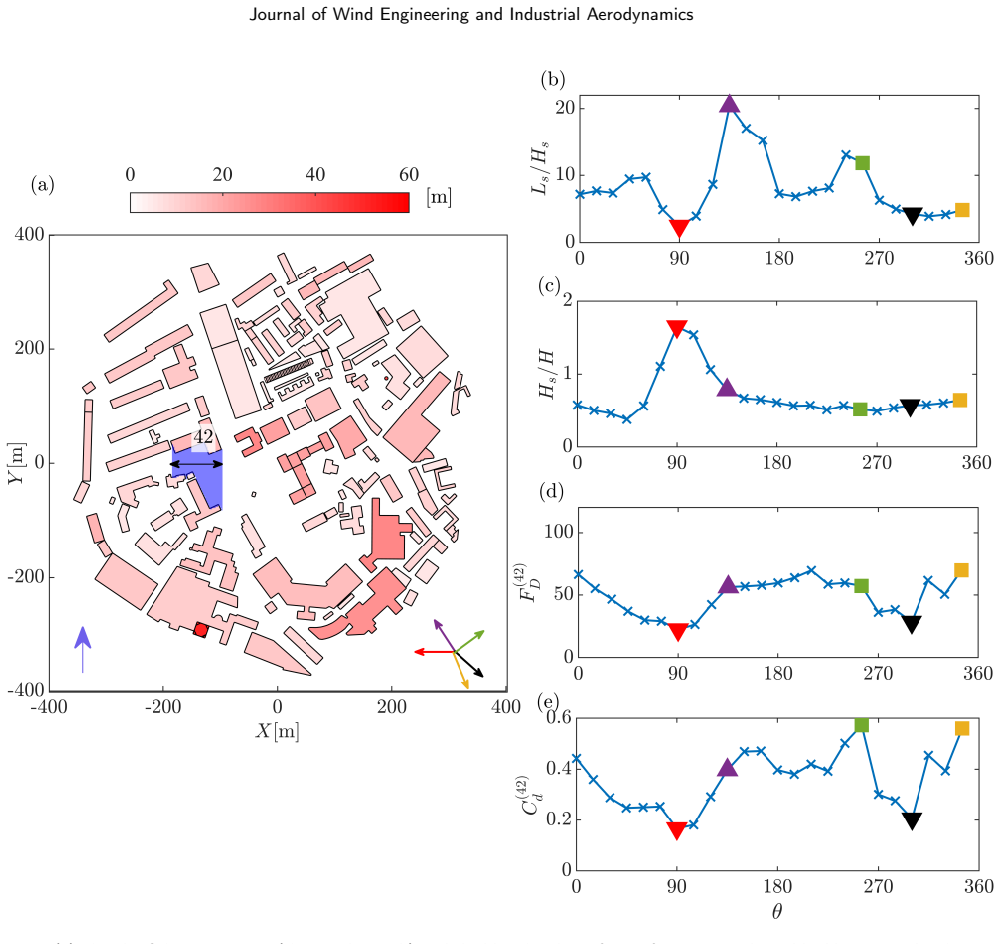
Shielding regimes defined by upstream fetch ratio Ls/Hs and relative height ratio Hs/H with thresholds 5 and 1, used to exclude or down-weight shielded buildings when calculating the campus drag coefficient.
If this is right
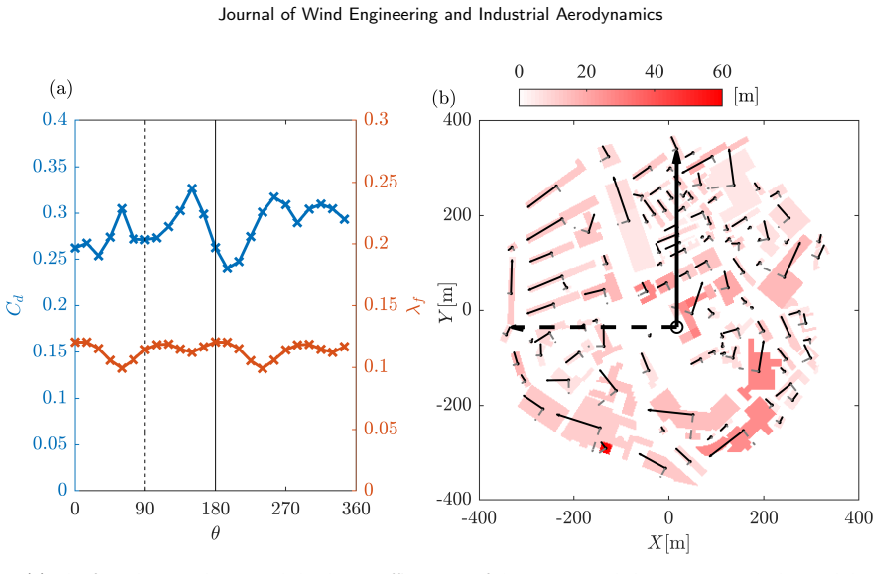
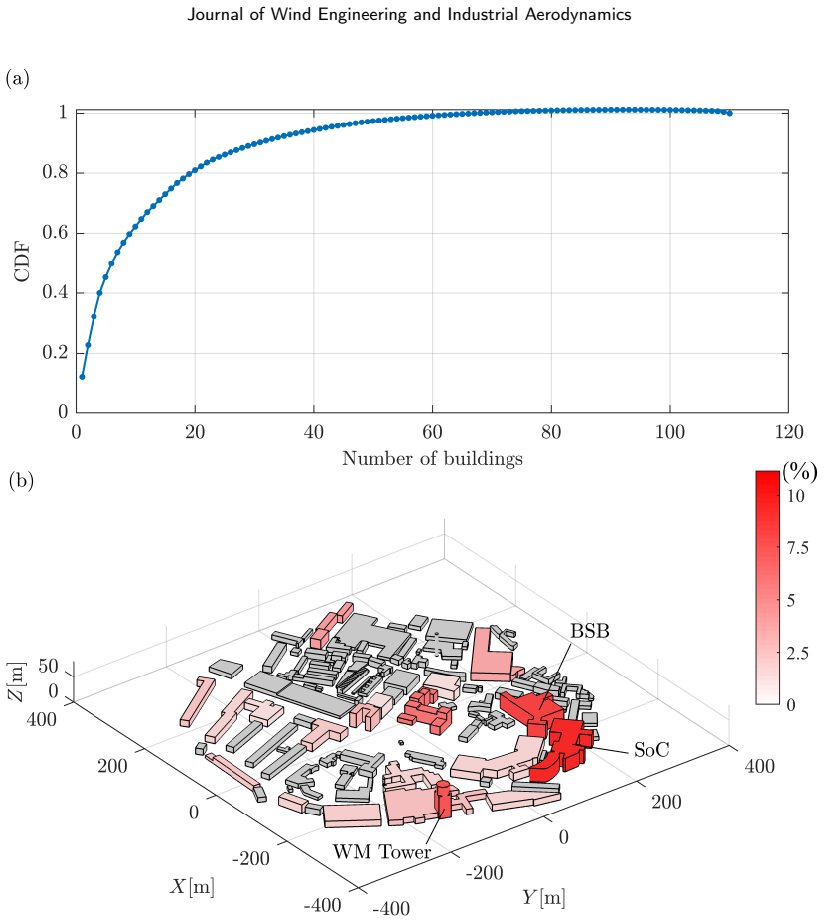
- 20 percent of buildings account for 80 percent of total campus drag.
- Buildings in the near-wake shielded regime experience negligible drag.
- Buildings in the far-wake non-shielded regime experience the highest drag.
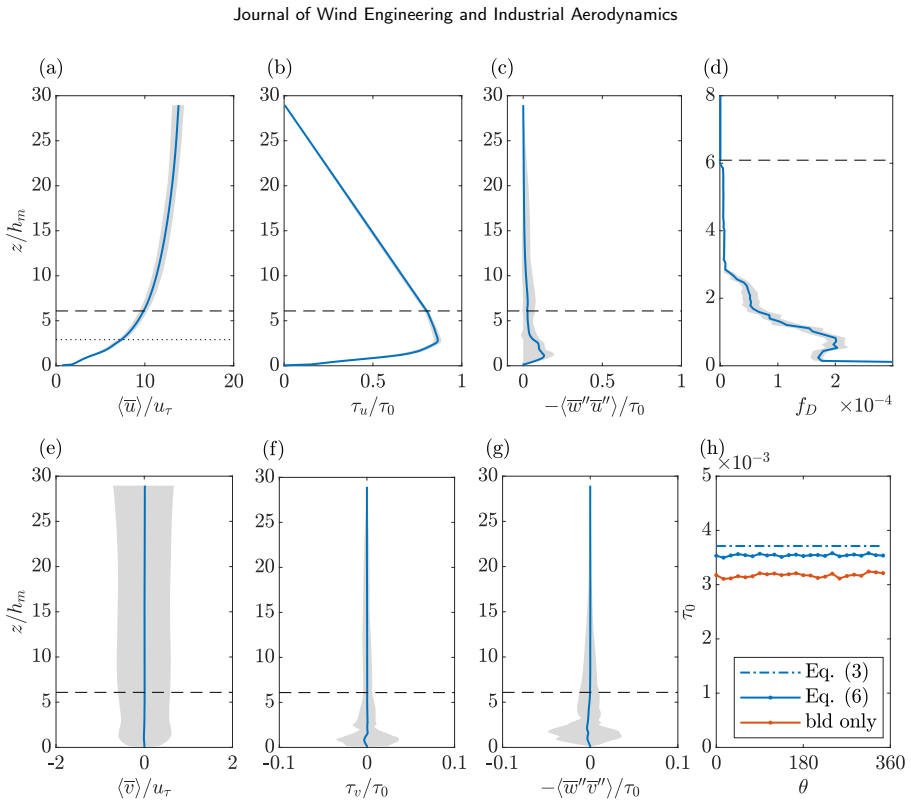
- The campus-wide drag coefficient fluctuates only moderately with wind direction.
- The modified drag coefficient produces a more consistent effective frontal area across directions.
Where Pith is reading between the lines
- The 80/20 contribution split implies that urban models could focus computational effort on the few dominant buildings.
- Similar shielding corrections might be tested in other dense urban areas to see if they improve wind-load predictions.
- Climate models that currently use direction-independent drag might gain accuracy by incorporating a simple shielding filter.
Load-bearing premise
The thresholds Ls/Hs = 5 and Hs/H = 1 correctly identify shielding regimes and apply beyond this specific campus layout.
What would settle it
Repeat the simulations on a second campus geometry or with altered thresholds and check whether the modified drag coefficient still shows markedly lower directional variation than the standard one.
Figures
read the original abstract
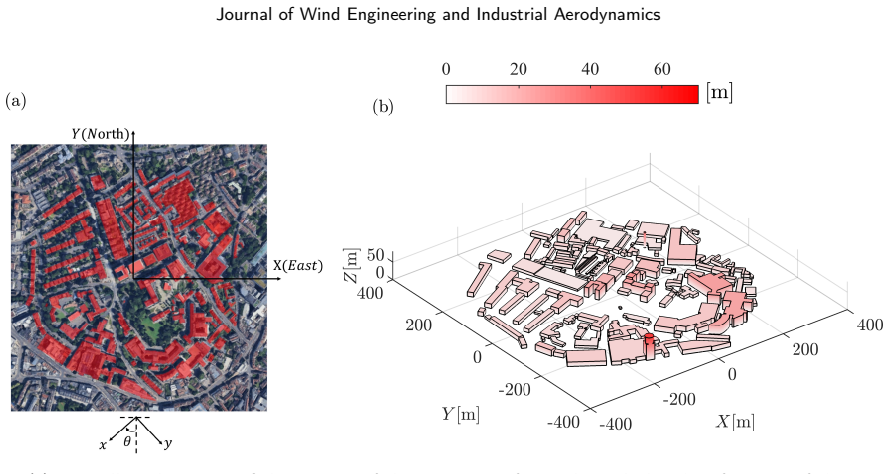
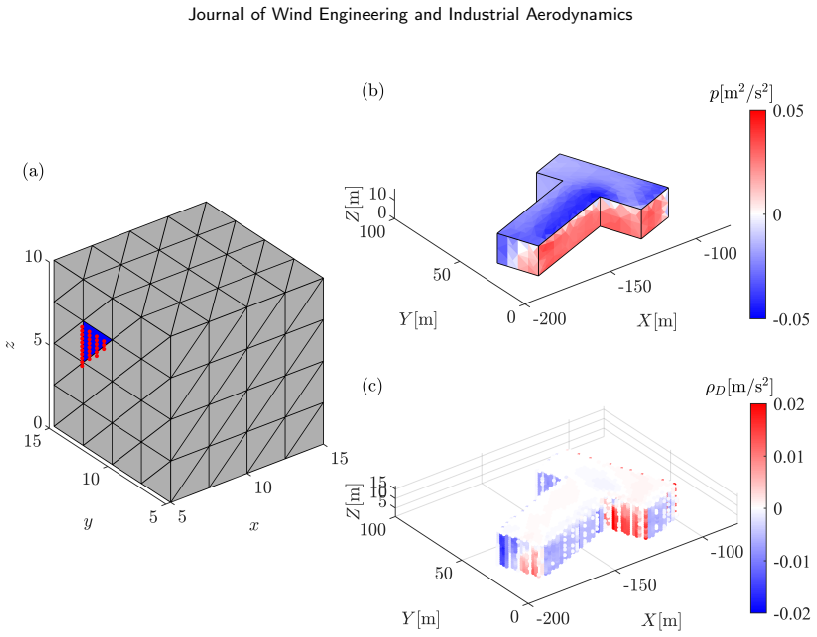
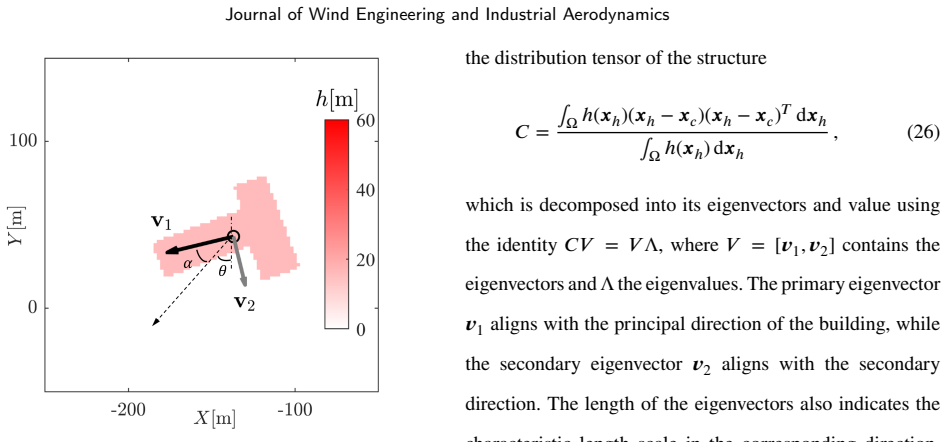
Shielding by upstream buildings is a fundamental control on urban drag, yet its influence remains poorly quantified in realistic urban environments. Here, we investigate shielding effects using building-resolved large-eddy simulations of the University of Bristol campus, comprising 110 buildings of varying height, shape and orientation. Twenty-four wind directions are considered, allowing each building to experience a wide range of upstream shielding conditions. While the total drag of the campus exhibits only moderate directional variability, the drag acting on individual buildings varies substantially. In the present case, approximately $20\%$ of buildings account for $80\%$ of the total drag, which is primarily attributed to a small number of large buildings that contribute disproportionately high drag forces. To quantify shielding, we introduce two dimensionless parameters: the upstream fetch ratio, $L_s/H_s$, and the relative height ratio, $H_s/H$, where $L_s$ is the distance to the nearest upstream obstacle, $H_s$ is the height of the upstream obstacle, and $H$ is the height of the target building. These parameters distinguish between near- and far-wake conditions and between sheltered and exposed buildings, providing a simple method to characterise shielding effects in realistic urban environments. The study provides valuable quantitative insight into drag and shielding in the Bristol campus morphology; more importantly, it establishes a general framework for analysing drag and shielding that can be applied in other complex urban environments. The results identify shielding as a primary control on building drag and motivate shielding-aware measures of effective frontal area and drag coefficient
Editorial analysis
A structured set of objections, weighed in public.
Referee Report
Summary. The manuscript reports results from 24 building-resolved large-eddy simulations of the University of Bristol campus (110 buildings) under constant pressure gradient forcing. It finds that the campus-scale drag coefficient shows moderate directional variation while individual-building drag varies strongly due to shielding; 20% of buildings account for ~80% of total drag. Two dimensionless ratios (upstream fetch L_s/H_s and relative height H_s/H) are introduced with fixed thresholds of 5 and 1 to classify buildings into four shielding regimes. A modified drag coefficient obtained by partially or fully excluding buildings in the near-wake shielded regime is shown to reduce directional anisotropy and produce a more directionally consistent effective frontal area.
Significance. If the reduction in anisotropy holds under the proposed modification, the work supplies a concrete, simulation-derived route to improve urban-canopy drag parametrizations that currently ignore directional shielding. The use of 24 independent, building-resolved LES runs under identical forcing supplies a reproducible dataset that directly supports the central claim without circular fitting.
major comments (1)
- [Abstract and shielding-regime definition] Abstract and the paragraph defining the shielding regimes: the thresholds L_s/H_s = 5 and H_s/H = 1 are stated without derivation, calibration against the LES drag values, or any sensitivity test. Because the modified drag coefficient is obtained precisely by excluding buildings classified as near-wake shielded under these exact cut-offs, the reported reduction in directional anisotropy and the improved consistency of effective frontal area rest on an untested choice; modest shifts in either threshold could reclassify enough of the high-drag buildings to alter the quantitative improvement.
minor comments (1)
- [Methods] The notation for L_s, H_s and the four regime labels should be accompanied by an explicit equation or schematic in the methods section to avoid ambiguity when readers attempt to reproduce the classification.
Simulated Author's Rebuttal
We thank the referee for their constructive assessment and for highlighting the importance of justifying the regime thresholds. We respond to the single major comment below and will revise the manuscript to address the concern.
read point-by-point responses
-
Referee: [Abstract and shielding-regime definition] Abstract and the paragraph defining the shielding regimes: the thresholds L_s/H_s = 5 and H_s/H = 1 are stated without derivation, calibration against the LES drag values, or any sensitivity test. Because the modified drag coefficient is obtained precisely by excluding buildings classified as near-wake shielded under these exact cut-offs, the reported reduction in directional anisotropy and the improved consistency of effective frontal area rest on an untested choice; modest shifts in either threshold could reclassify enough of the high-drag buildings to alter the quantitative improvement.
Authors: We agree that the thresholds require explicit justification and testing. The values were chosen to reflect typical near-wake recovery distances (L_s/H_s ≈ 5) and height ratios (H_s/H = 1) drawn from prior urban canopy studies on wake extent, but the original manuscript does not derive them from the present LES data or test sensitivity. In revision we will add a dedicated paragraph in the methods section explaining the physical basis and include a new sensitivity analysis (varying each threshold by ±20 % and recomputing the modified drag coefficient and anisotropy metrics). This will demonstrate robustness of the reported reduction in directional variability. The revised abstract will briefly note the physical motivation for the cut-offs. revision: yes
Circularity Check
No significant circularity; results computed directly from LES outputs
full rationale
The paper performs 24 building-resolved LES runs under fixed pressure gradient and computes drag coefficients and frontal areas directly from the velocity and pressure fields. The two ratios L_s/H_s and H_s/H are introduced as classification criteria with fixed numerical thresholds; buildings are then binned and a modified C_d is obtained by excluding or down-weighting the near-wake-shielded subset. This is a post-processing choice applied to the simulation data, not a fitted parameter whose value is adjusted to force the reported reduction in directional anisotropy, nor a self-citation chain, nor a renaming of a known result. No equation in the supplied text equates the final modified drag to any input quantity by algebraic identity. The derivation chain therefore remains independent of its own outputs.
Axiom & Free-Parameter Ledger
free parameters (2)
- Ls/Hs threshold =
5
- Hs/H threshold =
1
axioms (2)
- domain assumption Large-eddy simulations with building-resolved grids accurately capture the drag forces exerted by urban structures
- domain assumption A constant imposed pressure gradient produces a representative mean flow equivalent to real atmospheric forcing
invented entities (1)
-
Four shielding regimes (near-wake shielded, far-wake non-shielded, etc.)
no independent evidence
discussion (0)
Sign in with ORCID, Apple, or X to comment. Anyone can read and Pith papers without signing in.