REVIEW 3 major objections 5 minor 56 references
Evolution of superthin galaxies under Milgromian dynamics
T0 review · 3 major / 5 minor · reviewed 2026-08-04 · deepseek-v4-flash
Pith's one-line read Simulations show that a MOND model of UGC 7321 keeps most of its stellar disc superthin after 5 Gyr, despite a strong bar and a buckling episode.
desk verdict First systematic MOND hydro sims of superthin survival; the broad trend with MOND depth is credible, but the UGC 7321-specific claim rests on a low-mass model that its own rotation-curve fit contradicts. read the letter →
The pith
A machine-rendered reading of the paper's core claim, the machinery that carries it, and where it could break.
The reading
What carries the argument
The argument is carried by the quasi-linear formulation of MOND called QUMOND. The Newtonian potential is first solved from the baryonic density, then a second Poisson equation with the interpolating function ν(y) = (1 + sqrt(1 + 4/y))/2 builds the Milgromian potential; this is the gravity law the simulations evolve. The second ingredient is the MOND depth index D_M = 1 − M_bar(< r_M)/M_bar, the fraction of baryonic mass outside the MOND radius r_M = sqrt(G M_bar/a0), which quantifies how much of the galaxy lies in the low-acceleration regime. The third is the simulated vertical restoring field K_z, measured near the disc plane; its persistence through the run shows that baryonic matter alon
What would settle it
Re-run the fiducial simulation with the stellar mass increased to the MOND fit value (M/L_B ≈ 2.99, roughly doubling the stellar mass) and measure h_z/R_D after 5 Gyr; if a substantial radial range exceeds 0.1, the claim that a mass-consistent MOND model of UGC 7321 stays superthin is falsified.
Extended reading notes
Core claim
The central claim is that a superthin baryonic disc can survive long-term isolated evolution in MOND without being puffed up by its own instabilities. In the UGC 7321 model, the stellar disc forms a strong bar and undergoes a buckling episode at t ≈ 1 Gyr, yet after 5 Gyr the average h_z/R_D has increased by only about 1.5–1.8 times and most of the disc remains below the 0.1 superthin threshold. The authors interpret this as a balance between heating from non-axisymmetric structures and vertical confinement by the Milgromian gravitational field. Across the M1–M5 sequence, lower-D_M models (higher baryonic mass or smaller scale length) heat more and thicken more, while higher-D_M models (lowe
Load-bearing premise
Everything rests on assuming the photometric stellar mass of 1.6e9 solar masses is right; the paper's own MOND rotation-curve fit requires about twice that, and the adopted model under-predicts the observed outer rotation, so if the galaxy really is heavier the disc may not stay superthin.
Editorial extensions
If this is right
- If MOND is the correct description, superthin galaxies no longer require compact dark-matter haloes; the baryonic disc itself generates enough vertical restoring force to survive 5 Gyr of isolated evolution.
- Bars and bar buckling do not by themselves destroy superthin discs in MOND: the simulated bar weakens after buckling and the disc remains thin, matching the boxy/peanut isophotes seen in UGC 7321.
- The D_M trend predicts a population correlation: galaxies whose baryonic mass lies mostly inside the MOND radius (low D_M) should be thicker and warmer, while high-D_M galaxies should be the thinnest and most persistent.
- D_M alone is not enough: models with equal D_M, like M2 and M3, evolve differently, so mass and scale length still matter for predicting vertical structure.
Reading between the lines
- If the fiducial mass were raised to match the paper's own best-fit MOND rotation curve (M/L_B ≈ 2.99), the galaxy would sit near model M2, which exceeds h_z/R_D = 0.1 over a substantial radial range; so the superthin conclusion may hinge on the photometric mass scale.
- The MOND-depth trend suggests a testable mapping between observable surface brightness and diffuseness and vertical thickness among edge-on LSB galaxies: high-D_M candidates should show the smallest h_z/R_D at fixed age.
- Because these runs are isolated, the warped outer H I disc of UGC 7321 likely requires an external field or accretion; the paper's setup could be extended with static or time-varying external fields to test both warp and vertical heating.
- Including a more realistic multiphase gas or star-formation feedback could change the early bar strength and hence the heating; the paper's isothermal gas treatment is a simplification that future simulations should vary.
Editorial analysis
A structured set of objections, weighed in public.
Referee Report
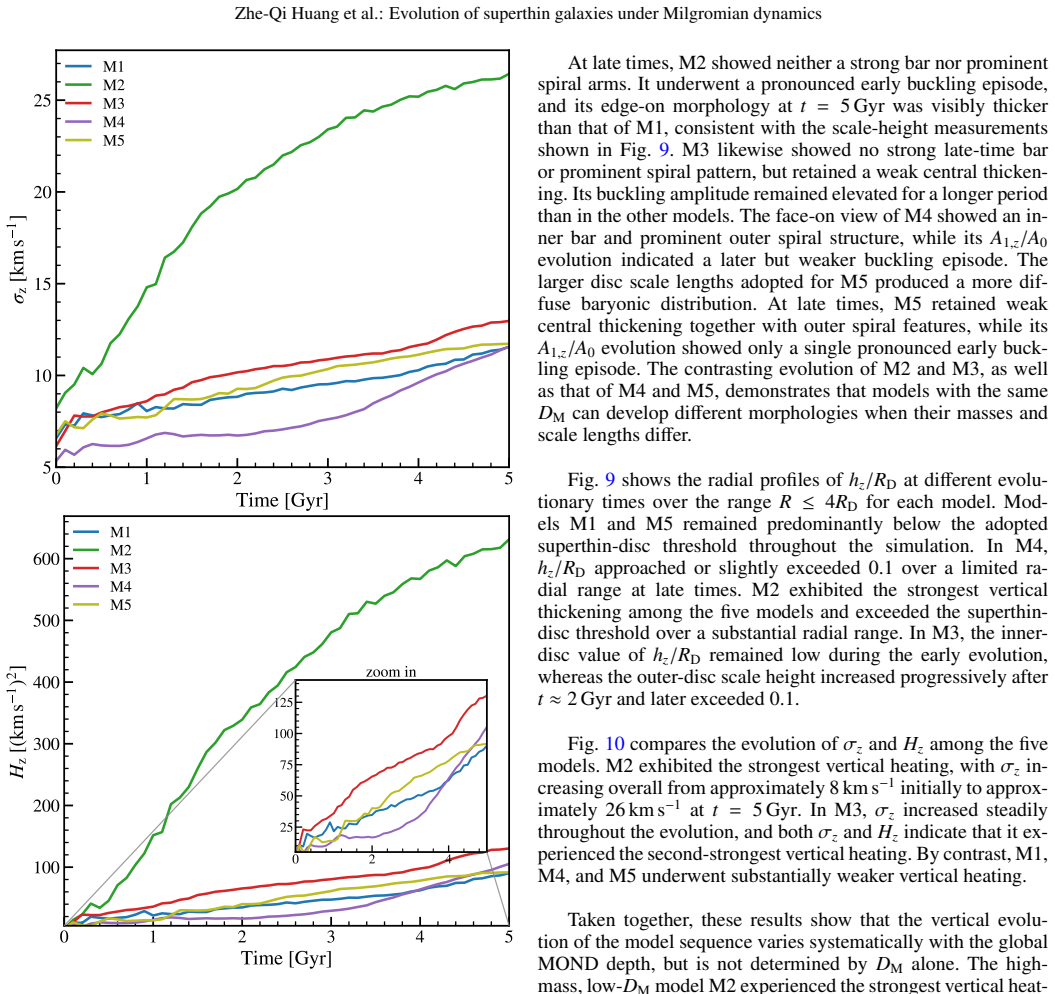
Summary. The paper uses the Phantom of RAMSES (POR) code to run three-dimensional QUMOND hydrodynamical N-body simulations of an isolated, superthin, low-surface-brightness galaxy modeled on UGC 7321. The fiducial model consists of exponential stellar and gas discs with parameters chosen from photometric and HI observations, evolved for 5 Gyr. The paper reports that the disc develops a strong bar and a buckling episode near 1 Gyr, but the vertical heating is limited and most of the stellar disc remains below h_z/R_D < 0.1 at the end of the simulation. The paper also introduces the MOND depth index D_M (Eq. 14) and compares five models (M1–M5) that vary total baryonic mass or disc scale lengths, finding that lower-D_M models tend to heat and thicken more, while higher-D_M models remain thinner. The main conclusions are that superthin discs can remain vertically thin in isolated MOND evolution and that the long-term maintenance of thinness is at least partly related to the degree to which the galaxy lies in the low-acceleration regime.
Significance. If the central claim is correct, the paper would extend the empirical successes of MOND from rotation curves to the long-term vertical structure of the thinnest known disc galaxies, a regime in which standard ΛCDM simulations have difficulty producing such flat discs. The study has notable strengths: it uses a publicly available, well-tested code; the diagnostics (Fourier amplitudes, h_z/R_D profiles, vertical velocity dispersion, vertical heating, and restoring force) are standard; the model parameters are reported in enough detail to reproduce the runs; and the authors are transparent about numerical resolution and the caveats on the isothermal gas treatment. The five-model D_M suite is a reasonable first step. However, the observational anchoring of the fiducial model is undermined by the paper's own rotation-curve fit, which requires roughly twice the adopted stellar mass. Since the higher-mass model M2 thickens beyond the superthin threshold over a substantial radial range, the paper does not currently establish that a galaxy matching UGC 7321's observed kinematics would remain superthin in MOND.
major comments (3)
- [§2, Fig. 2, Table 1] The 'observationally constrained' fiducial model is inconsistent with the paper's own MOND rotation-curve fit. The fit in Fig. 2 requires Υ_B=2.99, which with L_B=1.1e9 L_sun implies M_star≈3.3e9 M_sun, whereas Table 1 uses M_star=1.6e9 M_sun and M_gas=1.5e9 M_sun. The DICE model (red curve) visibly underpredicts the observed outer rotation curve. This low mass sets D_M=0.81 and the favorable initial h_z/R_D=0.057. Model M2, with M_bar=6.2e9 M_sun and D_M=0.69, exceeds h_z/R_D=0.1 over a substantial radial range (Fig. 9). The mass implied by the rotation-curve fit lies between M1 and M2, so the trend suggests realistic UGC 7321 could thicken well beyond the fiducial result. The central claim that an observationally constrained UGC 7321 remains superthin is therefore not established. The authors should either rerun the fiducial model at the fitted mass normalization (or an intermediate va
- [§3.2.2, Figs. 9–10] The D_M comparison does not isolate MOND depth as a causal variable. Models M2 and M3 have identical D_M=0.69 but differ in total baryonic mass and scale lengths (Table 2), and they show different vertical heating and morphology; M4 and M5 likewise share D_M=0.89 with different outcomes. Thus the apparent trend 'lower D_M implies stronger vertical heating and thickening' is confounded with total baryonic mass, surface density, and compactness. The text acknowledges that D_M alone does not uniquely determine evolution, but the Abstract and Conclusions still state that maintenance is influenced 'at least partly' by the degree of low-acceleration regime. To support that causal statement, the authors need a model set that varies D_M while holding mass and scale lengths fixed (e.g., via a0 or an external field) or a quantitative decomposition separating these effects. As presented, the eviden
- [§3.2.2] The resolution comparison is reported only qualitatively for the vertical-thickness claim. The high-resolution fiducial and the lower-resolution M1 have the same physical parameters but different peak bar strengths, buckling times, and late-time m=2 amplitudes; the text says their edge-on morphologies and h_z/R_D profiles both indicate limited thickening, but no quantitative h_z/R_D comparison is shown. Because vertical heating in this study is driven by the bar and buckling, which are explicitly resolution-sensitive, the central claim 'the disc remains globally superthin after 5 Gyr' needs a quantitative resolution check, e.g., a plot of Δ(h_z/R_D) at late times for the two runs, or an error bar on the final thickness. Without this, the reader cannot judge whether the survival result is converged.
minor comments (5)
- [§2 text] Minor grammatical issue: 'The radial gas scale-height profile constructed following the method of Banik et al. (2020)' should read '... profile was constructed following...'.
- [Fig. 2 caption] The caption uses 'D = 10.00 Mpc, i = 88.0' while the text states D=10.0 Mpc and i=88°. Please use consistent notation and units throughout.
- [Eq. (11)] The angular-momentum flux tensor equation does not show the local average indicated by the overbar in the text, and the index contraction is implicit. Adding an explicit overbar on ρ_star v_k v_α or stating 'local average' directly in the equation would improve clarity.
- [Fig. 4 colorbar] The colorbar label 'log10 ( /10^3 M pc^-2)' is ambiguous; please specify the quantity explicitly, e.g., log10(Σ / (10^3 M_sun pc^-2)), and state the projected mass surface density of which component is shown.
- [§3.1.2] The statement about |K_z|/(2πG) having dimensions of surface density but not being a direct baryonic surface density is useful; consider adding a one-sentence reminder when interpreting Fig. 7 in the text, since the shape of this profile is close to a surface-density profile.
Circularity Check
No significant circularity: the thickness evolution and D_M trends are simulation outputs, not fitted to the target results.
full rationale
The paper's central result—that an initially superthin disc can remain mostly below h_z/R_D = 0.1 after 5 Gyr in MOND—is a genuine N-body simulation outcome. The initial h_z/R_D = 0.057 is set from photometric/structural inputs, and the final thickness is measured from the evolved particle distribution; nothing in the evolution is adjusted to reproduce the final h_z/R_D. The MOND depth index D_M is defined by Eq. (14) from the input baryonic mass distribution and disc scale lengths, before evolution, and is not refit to the simulation outcome. The M1–M5 suite is an explicit parameter study varying baryonic mass and scale length, and the resulting trends in vertical heating and thickness are outputs, not identities. The paper does acknowledge a limitation in Section 2: its independently constrained DICE model underpredicts the observed outer rotation curve, while the algebraic MOND fit requires M/L_B = 2.99, roughly twice the adopted stellar mass. This is a model-validity/representativeness concern, not a circular reduction: the paper explicitly does not use the fitted M/L_B in the fiducial simulation, and the thickness prediction is not derived from that fit. There are no load-bearing self-citations by the present authors, and the D_M index is imported from Eappen & Kroupa (2026) as an external descriptor rather than as an unverified uniqueness or ansatz result. No equation in the paper forces the final h_z/R_D to equal the initial value or to equal D_M by construction.
Assumptions & free parameters
free parameters (5)
- Effective isothermal gas temperature T_gas =
2.5e4 K
- DICE stability parameter Q_lim =
1.25
- Initial stellar vertical scale height h_z,0 =
0.119 kpc
- MOND rotation-curve mass-to-light ratio (rejected fit) =
M/L_B = 2.99
- Structural scalings for models M2-M5 =
mass x2, x0.5; scale length x0.7, x1.5
assumptions (7)
- domain assumption QUMOND with the simple interpolating function (Eqs. 1-2) correctly describes non-relativistic galactic dynamics.
- domain assumption a0 = 1.2e-10 m s^-2 is the MOND acceleration scale.
- domain assumption The stellar and gas discs have exponential radial profiles and sech^2 vertical density profiles.
- domain assumption Gas vertical equilibrium is set by the algebraic MOND condition in Eq. (5).
- domain assumption UGC 7321 evolves in isolation with no external gravitational field for 5 Gyr.
- domain assumption The Bell & de Jong photometric mass-to-light calibration gives the stellar mass of UGC 7321, despite the paper's own MOND rotation-curve fit requiring about twice that mass.
- domain assumption Numerical resolution with levelmax = 13 for the fiducial run and levelmax = 12 for M1-M5 is adequate for the conclusions.
Cite this review
Pith. "Pith review of Evolution of superthin galaxies under Milgromian dynamics." pith.science (2026). https://pith.science/paper/EHWG6KLJ
@misc{pith2026260801632,
  author       = {Pith},
  title        = {Pith review of: Evolution of superthin galaxies under Milgromian dynamics},
  year         = {2026},
  howpublished = {\url{https://pith.science/paper/EHWG6KLJ}},
  note         = {Machine review of arXiv:2608.01632}
}
abstract
This work investigates the long-term evolution of the vertical structure of superthin galaxies within the framework of Milgromian dynamics (MOND). By constructing an observationally constrained model of UGC 7321, we test whether its disc can maintain an extremely flattened structure in a MOND gravitational field. We also construct models with different values of the MOND depth index $D_{\rm M}$ to study how the global MOND depth affects disc evolution. We perform three-dimensional hydrodynamical $N$-body simulations using the code Phantom of RAMSES. The evolution of the disc is quantified using $(h_z/R_{\rm D})$, Fourier amplitudes characterizing non-axisymmetric structures and vertical buckling, measures of vertical heating, and the vertical restoring force. In the observationally constrained model of UGC 7321, the galaxy develops a strong bar and undergoes a buckling instability during the early stages of the simulation. The bar strength then decreases, and the system eventually exhibits a weak bar structure. The stellar disc undergoes only limited vertical thickening, and most of the disc remains largely within the superthin regime, $h_z/R_{\rm D}<0.1$, after 5 Gyr. The comparison of models with different $D_{\rm M}$ values suggests that models with lower $D_{\rm M}$ values, associated in our model suite with higher baryonic masses or more compact discs, exhibit stronger vertical heating and more significant disc thickening. By contrast, models with higher $D_{\rm M}$ values, corresponding to lower masses or more diffuse structures, tend to maintain a superthin structure. Overall, the simulation results indicate that superthin discs can remain vertically thin during long-term isolated evolution in MOND, and that the long-term maintenance of superthin structures is influenced, at least partly, by the degree to which a galaxy lies in the low-acceleration regime.
Figures


Figures from the paper (6 more)


Reference graph
Works this paper leans on
- [1]
- [2]
- [3]
- [4]
-
[5]
Aditya, K., Banerjee, A., Kamphuis, P., et al. 2023, MNRAS, 526, 29
work page 2023
- [6]
- [7]
- [8]
Show all 56 references
-
[9]
& Jog, C
Banerjee, A. & Jog, C. J. 2013, MNRAS, 431, 582
2013
-
[10]
D., & Jog, C
Banerjee, A., Matthews, L. D., & Jog, C. J. 2010, New A, 15, 89
2010
-
[11]
2020, ApJ, 905, 135
Banik, I., Thies, I., Famaey, B., et al. 2020, ApJ, 905, 135
2020
-
[12]
G., Broeils, A
Begeman, K. G., Broeils, A. H., & Sanders, R. H. 1991, MNRAS, 249, 523
1991
-
[13]
& Milgrom, M
Bekenstein, J. & Milgrom, M. 1984, ApJ, 286, 7
1984
-
[14]
Bell, E. F. & de Jong, R. S. 2001, ApJ, 550, 212 Bílek, M., Thies, I., Kroupa, P., & Famaey, B. 2018, A&A, 614, A59
2001
-
[15]
V ., Kautsch, S
Bizyaev, D. V ., Kautsch, S. J., Sotnikova, N. Y ., Reshetnikov, V . P., & Mosenkov, A. V . 2017, MNRAS, 465, 3784
2017
-
[16]
& Milgrom, M
Brada, R. & Milgrom, M. 1999, ApJ, 519, 590 de Blok, W. J. G. & McGaugh, S. S. 1997, MNRAS, 290, 533
1999
-
[17]
2025, arXiv e-prints, arXiv:2505.21638
Desmond, H. 2025, arXiv e-prints, arXiv:2505.21638
2025 arXiv
-
[18]
& Kroupa, P
Eappen, R. & Kroupa, P. 2026, Galaxies, 14, 22
2026
-
[19]
& McGaugh, S
Famaey, B. & McGaugh, S. S. 2012, Living Reviews in Relativity, 15, 10
2012
-
[20]
Gentile, G., Famaey, B., & de Blok, W. J. G. 2011, A&A, 527, A76
2011
-
[21]
Goad, J. W. & Roberts, M. S. 1981, ApJ, 250, 79
1981
-
[22]
Grand, R. J. J., Springel, V ., Gómez, F. A., et al. 2016, MNRAS, 459, 199
2016
-
[23]
2022, ApJ, 925, 183
Haslbauer, M., Banik, I., Kroupa, P., Wittenburg, N., & Javanmardi, B. 2022, ApJ, 925, 183
2022
-
[24]
2024, Research in Astronomy and Astrophysics, 24, 075019
Hu, J., Xu, D., & Li, C. 2024, Research in Astronomy and Astrophysics, 24, 075019
2024
-
[25]
D., Karachentseva, V
Karachentsev, I. D., Karachentseva, V . E., & Parnovskij, S. L. 1993, Astronomis- che Nachrichten, 314, 97
1993
-
[26]
Kautsch, S. J. 2009, PASP, 121, 1297
2009
-
[27]
2010, Astron
Khoperskov, A., Bizyaev, D., Tiurina, N., & Butenko, M. 2010, Astron. Nachr., 331, 731
2010
-
[28]
2020, MNRAS, 499, 5690
Komanduri, A., Banerjee, I., Banerjee, A., & Sengupta, S. 2020, MNRAS, 499, 5690
2020
-
[29]
C., & de Grijs, R
Kregel, M., van der Kruit, P. C., & de Grijs, R. 2002, MNRAS, 334, 646
2002
-
[30]
N., et al
Kurapati, S., Banerjee, A., Chengalur, J. N., et al. 2018, MNRAS, 479, 5686
2018
-
[31]
S., & Schombert, J
Lelli, F., McGaugh, S. S., & Schombert, J. M. 2016, AJ, 152, 157
2016
-
[32]
2023, MNRAS, 520, 1243
Li, X., Shlosman, I., Pfenniger, D., & Heller, C. 2023, MNRAS, 520, 1243
2023
-
[33]
2024, MNRAS, 527, 11026 Lüghausen, F., Famaey, B., & Kroupa, P
Li, X., Shlosman, I., Pfenniger, D., & Heller, C. 2024, MNRAS, 527, 11026 Lüghausen, F., Famaey, B., & Kroupa, P. 2015, Canadian Journal of Physics, 93, 232
2024
-
[34]
Matthews, L. D. 2000, AJ, 120, 1764
2000
-
[35]
D., Gallagher, J
Matthews, L. D., Gallagher, J. S., I., & van Driel, W. 1999, AJ, 118, 2751 Article number, page 12 Zhe-Qi Huang et al.: Evolution of superthin galaxies under Milgromian dynamics
1999
-
[36]
Matthews, L. D. & Uson, J. M. 2008, AJ, 135, 291
2008
-
[37]
S., Lelli, F., & Schombert, J
McGaugh, S. S., Lelli, F., & Schombert, J. M. 2016, Phys. Rev. Lett., 117, 201101
2016
-
[38]
S., Schombert, J
McGaugh, S. S., Schombert, J. M., Bothun, G. D., & de Blok, W. J. G. 2000, ApJ, 533, L99
2000
-
[39]
1983, ApJ, 270, 365
Milgrom, M. 1983, ApJ, 270, 365
1983
-
[40]
2009, ApJ, 698, 1630
Milgrom, M. 2009, ApJ, 698, 1630
2009
-
[41]
2010, MNRAS, 403, 886
Milgrom, M. 2010, MNRAS, 403, 886
2010
-
[42]
N., Huchtmeier, W
Mitronova, S. N., Huchtmeier, W. K., Karachentsev, I. D., Karachentseva, V . E., & Kudrya, Y . N. 2005, Astronomy Letters, 31, 501
2005
-
[43]
T., Banik, I., Thies, I., et al
Nagesh, S. T., Banik, I., Thies, I., et al. 2021, Canadian Journal of Physics, 99, 607
2021
-
[44]
T., Kroupa, P., Banik, I., et al
Nagesh, S. T., Kroupa, P., Banik, I., et al. 2023, MNRAS, 519, 5128 O’Brien, J. C., Freeman, K. C., & van der Kruit, P. C. 2010, A&A, 515, A63
2023
-
[45]
E., Impey, C
Pickering, T. E., Impey, C. D., van Gorkom, J. H., & Bothun, G. D. 1997, AJ, 114, 1858
1997
-
[46]
2018, MNRAS, 473, 4077
Pillepich, A., Springel, V ., Nelson, D., et al. 2018, MNRAS, 473, 4077
2018
-
[47]
2003, A&A, 409, 485
Pohlen, M., Balcells, M., Lütticke, R., & Dettmar, R.-J. 2003, A&A, 409, 485
2003
- [48]
-
[49]
2012, MNRAS, 421, 333
Saha, K., Martinez-Valpuesta, I., & Gerhard, O. 2012, MNRAS, 421, 333
2012
-
[50]
Saha, K., Pfenniger, D., & Taam, R. E. 2013, ApJ, 764, 123
2013
-
[51]
Saha, K., Tseng, Y .-H., & Taam, R. E. 2010, ApJ, 721, 1878
2010
-
[52]
& Jog, C
Sarkar, S. & Jog, C. J. 2019, A&A, 628, A58
2019
-
[53]
& Combes, F
Tiret, O. & Combes, F. 2007, A&A, 464, 517
2007
-
[54]
& Combes, F
Tiret, O. & Combes, F. 2008, A&A, 483, 719
2008
-
[55]
Uson, J. M. & Matthews, L. D. 2003, AJ, 125, 2455 V ogelsberger, M., Genel, S., Springel, V ., et al. 2014, Nature, 509, 177
2003
-
[56]
2020, ApJ, 890, 173 Article number, page 13 A&A proofs:manuscript no
Wittenburg, N., Kroupa, P., & Famaey, B. 2020, ApJ, 890, 173 Article number, page 13 A&A proofs:manuscript no. main Appendix A: Additional figures for the MOND-depth models 6 5 4 3 2 1 0 log10 ( /103 M pc 2) 20 10 0 10 20 y [kpc] M1 M2 M3 M4 M5 20 10 0 10 20 x [kpc] 10 5 0 5 1...
2020
Reviewed August 4, 2026 · model on record in the stance chip above.
Discussion (0). Sign in to comment.